Crypto
Bitcoin down while stock and commodities markets move higher this week
Bitcoin was down again for the week by 8 percent, with most cryptos shedding 15 percent to 30 percent.
“A whole bunch of big technological shocks occurred when Asian innovations – paper, gunpowder, the stirrup, the moldboard plow and so on – came to Europe via the Silk Road.” —Charles C. Mann, author, “1491: New Revelations of the Americas Before Columbus”
“Now we are talking about concluding a free trade agreement between the Eurasian Economic Council, recently established in the post-Soviet space, and China. A similar agreement was concluded a short time ago with Vietnam. Then, we will coordinate, at least we are ready to do this, the Chinese concept of the Silk Road Economic Belt with our newly-created regional organization. So, do you understand how diverse, multi-faceted and deep Russian-Chinese ties have become over the last couple of decades? And we resolved the border issue.” —Vladimir Putin, President of Russia
“As the 19th century progressed, Europe’s innovations, norms and categories came to achieve a truly universal hegemony.” —Pankaj Mishra, Indian essayist & novelist
“The era of US economic dominance is rapidly coming to an end as an “American Gothic” age sets in and China becomes the new global leader.” —Niall Ferguson, author, “Colossus: The Rise and Fall of the American Empire”
Is China the colossus that wants to stride the world? The Economist’s lead article this week is entitled “Planet China.” China’s “project of the century” is what is being called “the Belt and Road Initiative” (BRI). It is known as the revival of the ancient “silk road” that traversed Eurasia and seas between China and Africa. The ancient “silk road” had its start in the Han Dynasty (207 BCE–220 CE) and lasted into the 15th century. It played a significant role in the development of numerous civilizations including China, Korea, Japan, the Indian subcontinent, Persia (Iran), Europe, the Horn of Africa, and Arabia. One could even say it was the first globalization.
The Economist goes into more detail in a “Briefing” with its article “Gateway to the Globe: China has a vastly ambitious plan to connect the world.” Note: a subscription may be required for these articles, although they do allow a certain number of free articles.
What stands out is the concern over China’s motives for the BRI. The west views it as China building a series of ports for its warships and indebting many countries so that China gains political influence and access to natural resources. If that sounds familiar, it should, because this script was written years ago by the U.S.A. Starting with Bretton Woods (1944) the world was to be dominated by the U.S. and, to a lesser extent, the United Kingdom as the US$ was set as the world’s reserve currency. Bretton Woods also created the U.S.-dominated and U.S.-based institutions of the International Monetary Fund (IMF) and the World Bank. Even the United Nations, initially, at least, was U.S.-dominated as well as being based in the U.S.
Talk of building the “New Silk Road” had been ongoing for years. Russia, China, and others have been wanting to escape the U.S. hegemony as well as the dominance of the US$ as the world’s reserve currency. Much of the developing world was dependent on the U.S. for helping to bring their economies out of poverty. But, like the accusations hurled at China and its motives for the BRI, the countries were indebted with US$ loans, with much of the benefit going to a wealthy elite even as large development plans did help raise the living standards of the broader population.
Much of that was outlined in John Perkin’s book “Confessions of an Economic Hitman,” where Perkins, through his career as an engineering consultant, was at the forefront of convincing underdeveloped countries to accept substantial loans for construction and engineering projects that primarily benefited the wealthy families that ran the country. The loans came from the World Bank, U.S. Aid, and even private U.S. banks. Eventually, the loans overburdened the country, threatening bankruptcy unless they went along with the U.S. government to, in particular, gain access to their natural resources, gain political influence, and often to establish military bases. Perkin’s book is controversial and many have heavily criticized it, including those calling it fiction. Nonetheless, it was a bestseller and Perkins followed it up with more controversial books.
That the West, led by the U.S., needs to halt China’s ambitions or at least slow them down is not out of the question. China’s quest is a threat to U.S. global hegemony and a threat to the supremacy of the US$ as the world’s reserve currency—a situation which benefits the U.S. as it allows them to run the huge deficits of trade and budget.
China has been behind the creation of the Asian Infrastructure Investment Bank (AIIB), a Beijing-based bank similar to the U.S.-based World Bank. Similar attempts are underway for a Chinese answer to the IMF and also to the U.S.-dominated global payments system known as SWIFT. The currency: the Chinese Yuan. Already. the Yuan is coming into wide use in trade, particularly between Russia and China. There are moves afoot to have oil priced in Yuan, a move that would most definitely be a threat to the U.S. petrodollar.
The tension between the rise of China and the West (U.S.) is palpable and is most likely behind many of the geopolitical machinations that have taken place over the past two decades. The aim is to put a wrench into China’s plans for the BRI by taking control of strategic countries that would help block China’s ambitions.
So, what has all of this got to do with markets? Well, plenty. One of the reasons the U.S. is able to run such huge deficits is because of the supremacy of the US$ as the world’s reserve currency. The U.S., unlike many other central banks, has the ability to effectively print money and issue debt. And the debt they have issued now amounts to over $21 trillion. Much of the global debt, which now totals an estimated $247 trillion, is also written in US$. But that has become a problem for many countries and their corporations. In China, there is an estimated $250 billion of bad loans in insolvent banks and state-owned enterprises. On top of that, there is bad debt in off-book liabilities of provincial governments, wealth management companies, and property developers.
There are also huge potential problems with emerging market debt. There are at least 70 countries whose Moody’s Investment Services credit ratings are Ba1 or lower. Ba1 and lower are considered as highly speculative or junk bonds. A small sampling of those countries shows Portugal (Ba1), Russia (Ba1), Turkey (Ba2), Brazil (Ba2), Argentina (B3), Pakistan (B3), Ukraine (Caa2), and Venezuela (Caa3). One country has a C rating—Puerto Rico.
Ironically, Puerto Rico is listed as an unincorporated U.S. territory and uses the US$ as its currency. It was devastated last year by Hurricane Maria. The U.S. has basically refused to bail it out and because of its link to the U.S., we are not sure it is eligible for an IMF bailout. A C rating is as low as Moody’s ratings go. Pakistan needs an IMF bailout, but the U.S. has instructed the IMF not to bail out their bad debt to China. The political machinations continue.
Over the past several years, there have been moves by the West (U.S.) to either invade, sanction, or bomb countries that potentially stand in the way of China completing the BRI. Aggression against Iraq, Iran, Syria and Libya also had a monetary context. In 2000, Iraq under Saddam Hussein wanted to price his oil in Euros to get around U.S. sanctions. Iran in 2006 made moves to open an oil bourse trading in Euros, Yuan, Rials and Rubles. Iran more recently announced it would drop the US$ for trade.
It was right after that announcement that the U.S. dropped the Iran nuclear deal and has even threatened invasion. Libya wanted to introduce a gold-backed currency, the dinar, to create a joint Pan-African Union. Not only did that fly against U.S. wishes, but it also undermined French interests in Africa. Iraq and Libya were attacked not long after announcing these moves. Coincidence? Possibly, but you usually won’t find them as reasons as to why they were invaded or attacked. Iraq, in particular, would be a key cog in the creation of the BRI as would Iran, Syria and even Afghanistan.
The U.S. has placed sanctions on Russia, allegedly for its seizing of Crimea and the ongoing conflict in the Donbas of Eastern Ukraine. But Russia has also been active behind moving away from the US$ for trade, even asking for payment for its oil and gas in Euros. Russia trades with China and elsewhere in Yuan. The U.S.-dominated NATO has also moved troops closer to the Russia border, effectively encircling it. China has been expanding into the South China Sea as a part of its BRI plans and military plans, but that has brought the U.S. and China close to conflict as the U.S. (and other countries as well) warships prowl the region. The trade wars are heavily directed at China, and China has been often accused of being a currency manipulator.
The U.S. needs lots of US$ spread about the globe to help finance its debt. It is no surprise that some $6.2 trillion of U.S. debt is held by foreign central banks. More is believed to be held in foreign sovereign wealth funds and other large pools of funds. China’s PBOC is the largest holder with almost $1.2 trillion, according to the latest figures supplied by the U.S. Treasury. On the other hand, the Bank of Russia (BofR) has sold off almost a $100 billion of U.S. Treasuries in the past few months, leaving them with very little. Both PBOC and the BofR have been buying gold to shore up their currencies the Yuan and the Ruble.
Currency wars between countries and often directed at the U.S. have been ongoing since 2010. They could be intensifying. Trade wars are an extension of currency wars. The U.S. has been creating spats between its major trading partners by enacting, threatening, backing off, and then supposedly seeking a deal. When none is forthcoming, start over again. The same is happening over sanctions as the U.S. threatens anyone who deals with those they have sanctioned.
The list is growing with Russia, Iran, Syria and North Korea heading a list that, according to the U.S. Treasury, contains 45 different entries, although not all currently apply. The result has often been countries and corporations working around U.S. sanctions through back doors, currencies other than US$, exchanges at sea, smuggling and more, including outright refusal to bend to U.S. sanctions. China has made it clear they will continue to buy Iranian oil.
All of this is happening against the backdrop of record global debt and the U.S. hiking interest rates because of a stronger U.S. domestic economy. If there is one thing, however, about the Fed, it is that it often starts too late in hiking interest rates and then overshoots at the end. Others, such as Canada and the United Kingdom, have also been hiking interest rates.
Quantitative easing (QE) has turned into quantitative tightening (QT). Years of low, even zero and sub-zero interest rates along with QE have created a debt bubble of immense size. That, in turn, has fed into the stock markets, and with rising interest rates, the threats of trade wars along with currency wars, the world could be teetering on the edge of another financial crisis that could outstrip the one in 2008. But there is a big difference with this one: the central banks do not have the wherewithal to combat it in the same way they did in 2008. And that alone is worrying.
China’s BRI is just the outer show of a challenge against the U.S. global hegemony and the dominance of the US$ as the world’s reserve currency. We should note the last time the world faced two superpowers challenging each other’s dominance, we fell into two world wars with a Great Depression in between. Substitute China/U.S. with Germany/Britain. Back then, the equivalent of China’s BRI was known as the Berlin-Baghdad railway as Germany sought to break Great Britain’s domination by linking overland into Asia.
The currencies were the Deutsche Mark and the British Pound. And once again, the Mid-East was at the center through the Ottoman Empire. As Germany attempted to build the railway and use the restive natives of the Muslim world against Britain, the British were trying to stop the building of the Berlin-Baghdad railway. Germany courted Persia (Iran) and Afghanistan to use for attacks on British India. Ironically, the Berlin-Baghdad railway wasn’t completed until 1940. Today, the attempt is to stop the BRI. History doesn’t repeat itself, but it does rhyme.
The ancient Silk Road

The ancient Silk Road route. (Photo by Simon Pielow via Flickr. CC BY-SA 2.0)
Bitcoin watch
© David Chapman
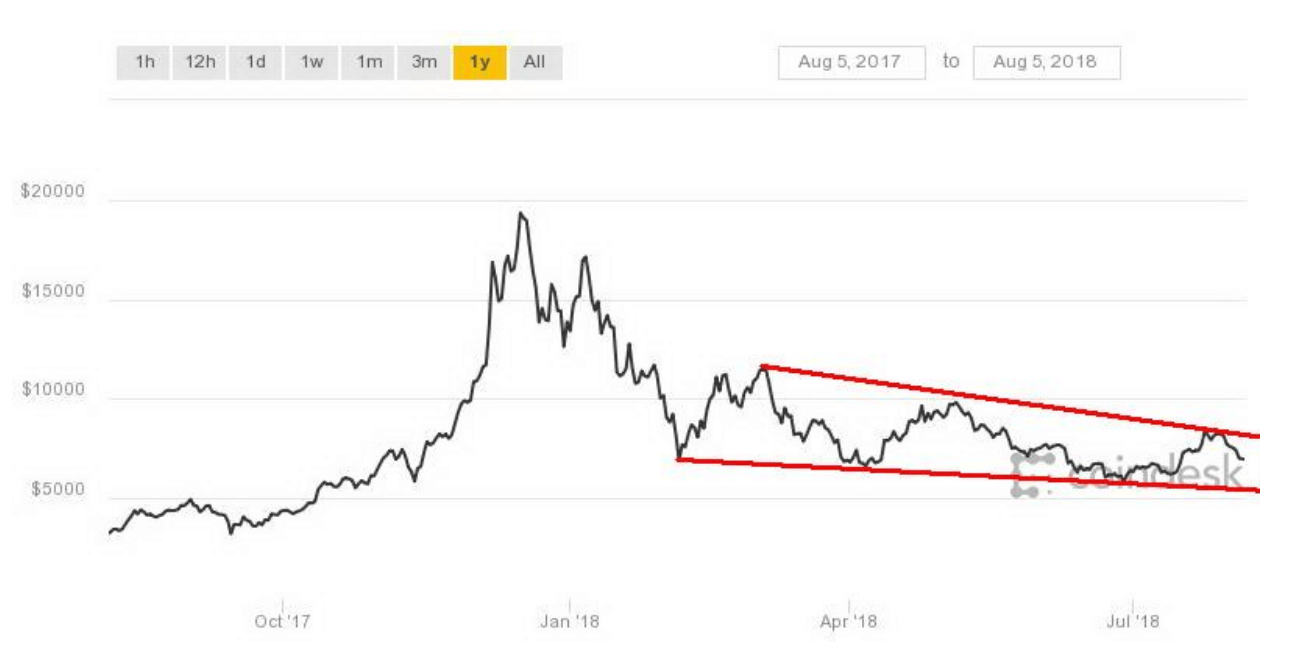
Last week, with Bitcoin running up over $8,000 and threatening to break out over $8,500, we read a number of bullish stories as to why Bitcoin was now going to start on its way to $50,000—okay, at least to $10,000. The point was we thought there were too many bullish stories too soon when we never reached any kind of depressive bottom that usually signals a bottom. Besides, little had changed. Exchanges were still getting hacked, regulation was still spotty, coins proliferated, and people were still getting scammed. We could go on.
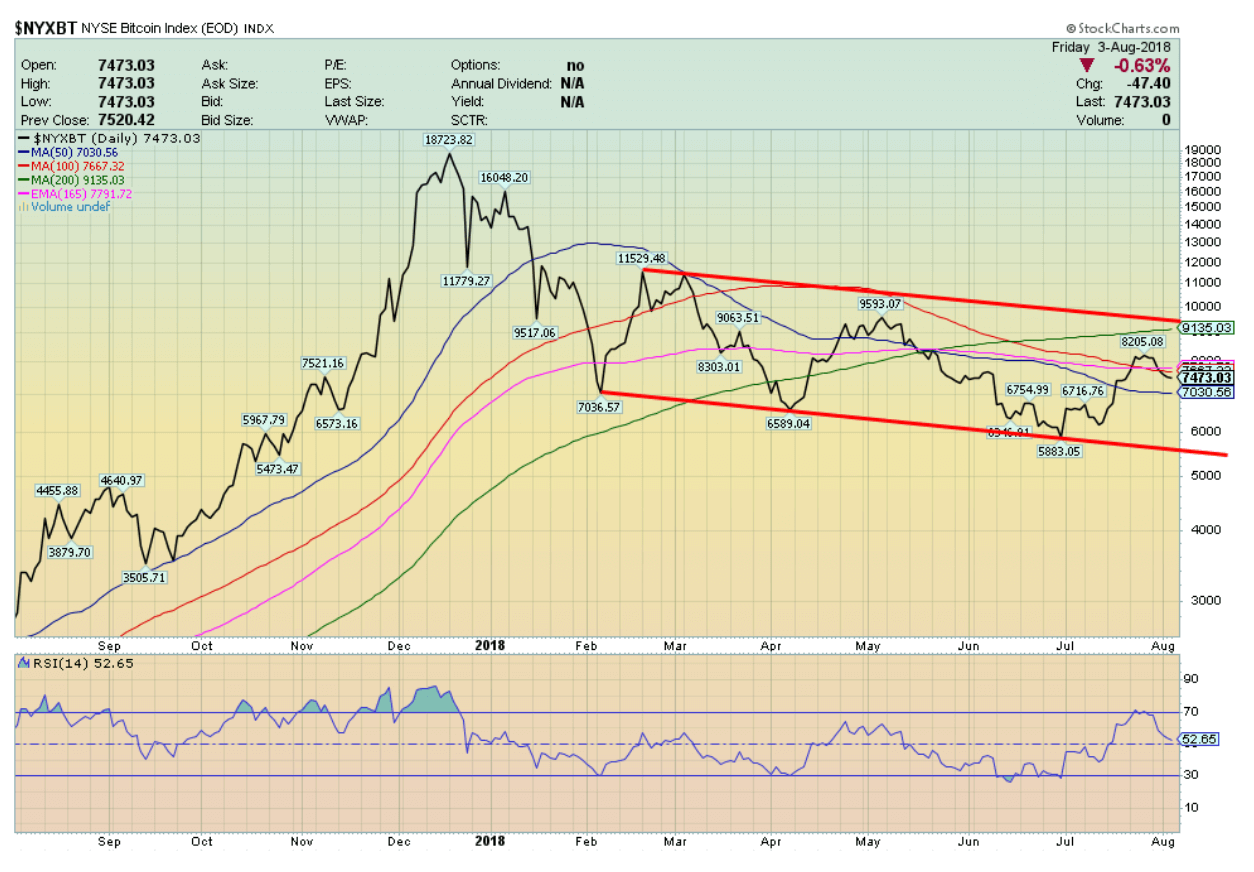
So maybe it’s no surprise to find Bitcoin back down again this week, off some 8 percent from last week. Still, Bitcoin still has a way to go to reach the bottom of the current channel near $5,000. There remains some support at $7,300 and $6,800. A break under $6,200 would suggest to us that we should soon fall under $6,000.
Most cryptos were down this week with many off 15 percent to 20 percent and some down more than 30 percent. This week’s tally from Coin Market Cap shows only 18 cryptos with a market cap over $1 billion, down from 19 the previous week. The market cap of all cryptos slipped to $273 billion, down from $288 billion the previous week. But the number of different cryptos continues to proliferate. There were 1,752 listed this past week, an amazing jump of 96 in one week. We confess we don’t know what to make of it. Maybe one of our readers can explain why so many are proliferating.
It certainly couldn’t be because more coins were added to Dead Coins. Some 889 dead coins were listed this week, up from 885 the previous week.
Even the stories we did read this week say this pullback in Bitcoin is only a short-term bear market. A pullback of this nature is backing and filling, not a short-term bear market. An 8 percent move in Bitcoin from one week to the next is a fluctuation in Bitcoin terms. Defense of Bitcoin is appearing at $7,300, but if they push through that to $7,000, then we should head down to $6,800 support.
We read that the creditors of the defunct coin exchange Mt. Gox are trying to recoup money. All we can say is good luck. The money has probably vaporized.
© David Chapman
Markets and trends
New highs/lows refer to new 52-week highs/lows. © David Chapman
© David Chapman
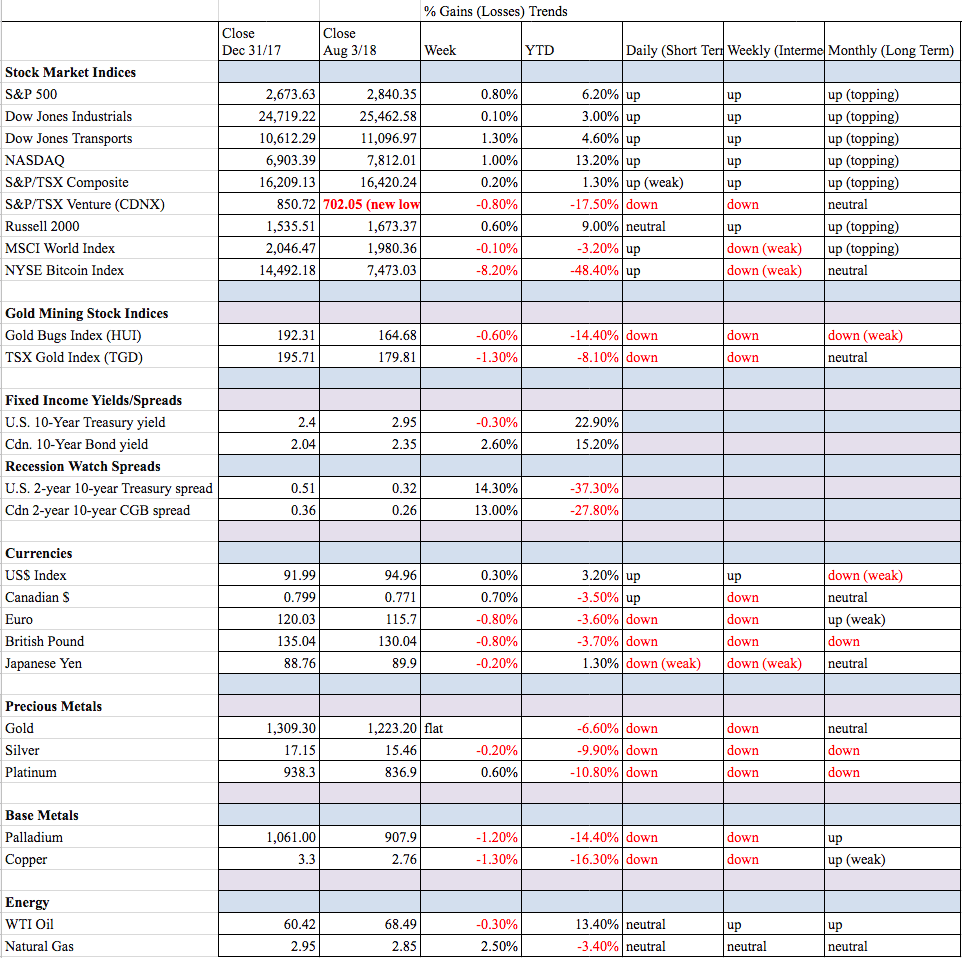
The markets moved higher this week, shrugging off trade war fears, Trump’s ramblings to have Attorney General Jeff Sessions fire Mueller, the weaker than expected jobs numbers, and saber rattling at Iran. The S&P 500 gained 0.8 percent on the week. The Dow Jones Industrials (DJI), however, was essentially flat, gaining barely 0.05 percent. Thanks to weaker oil prices, the Dow Jones Transportations (DJT) jumped 1.3 percent while the tech-laden NASDAQ, thanks to Apple, jumped 1 percent. The small cap Russell 2000 was up 0.6 percent but remains off its recent highs.
Elsewhere in Canada, the TSX Composite was up 0.2 percent, but the junior TSX Venture Exchange (CDNX) fell to new 52-week lows, down almost 0.8 percent and off 17.5 percent on the year. Overseas, the MSCI World Index fell about 0.1 percent, the London FTSE was flat, the Paris CAC 40 fell 0.6 percent, and the German DAX was down 1.9 percent, all reflecting weakness in the EU. The Tokyo Nikkei Dow (TKN) was down 0.8 percent while the Chinese Shanghai Index (SSEC) fell a sharp 4.6 percent as Chinese investors continued to bail on fears of financial collapses and trade wars.
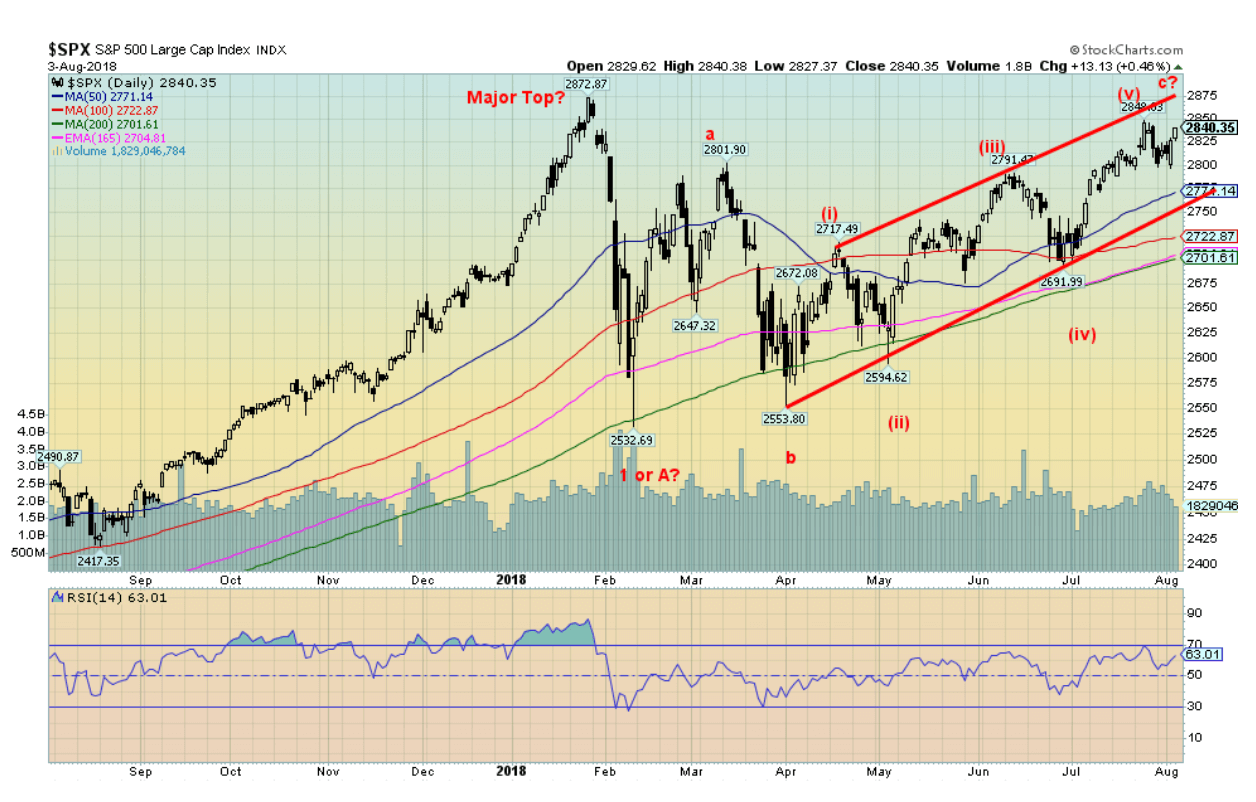
But the North American markets seem immune to all of that. That is until they aren`t. We don`t know whether the current up move is finished, but we suspect we are getting near the end. The top of the channel is currently up near 2,875, and that would imply new highs, but barely. The breakdown point is a way off as it would need a drop under 2,750 to suggest the rally is over. A drop under 2,800 would be the first sign of some possible trouble, but still, it would need a drop under 2,750 to signal further losses. More serious trouble could start under 2,700. The stock market appears to be topping here, but we can’t rule out higher prices first. We could also be forming a double top with the January 2018 high of 2,872.
© David Chapman
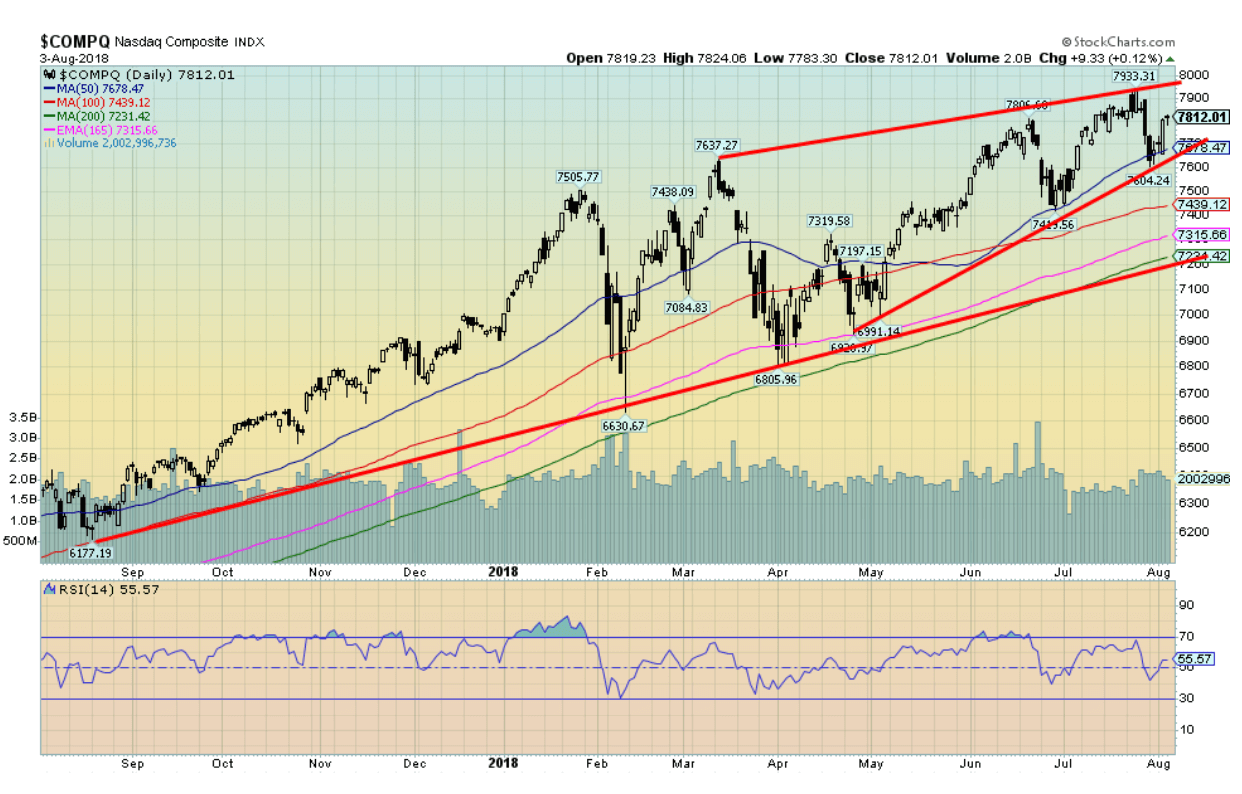
Thanks to the trillion-dollar company, Apple, the NASDAQ snapped back this week following its outside reversal week to the downside seen the previous week. So, is the NASDAQ headed back up to new highs? We’d be surprised as we appear to form a wedge triangle which should be bearish. But the 50-day MA at 7,678 appears to have provided support, so as long as the NASDAQ can hang above 7,600, it could return to the highs and even make new highs. Resistance is up to 7,950. The FAANGs led the market up, and they could well lead the market down. The FAANGs rally remind us of the “nifty fifty” rally of late 1972. That culminated in a top in early 1973, and by December 1974, the DJI was down 45 percent with other indices down even more.
© David Chapman
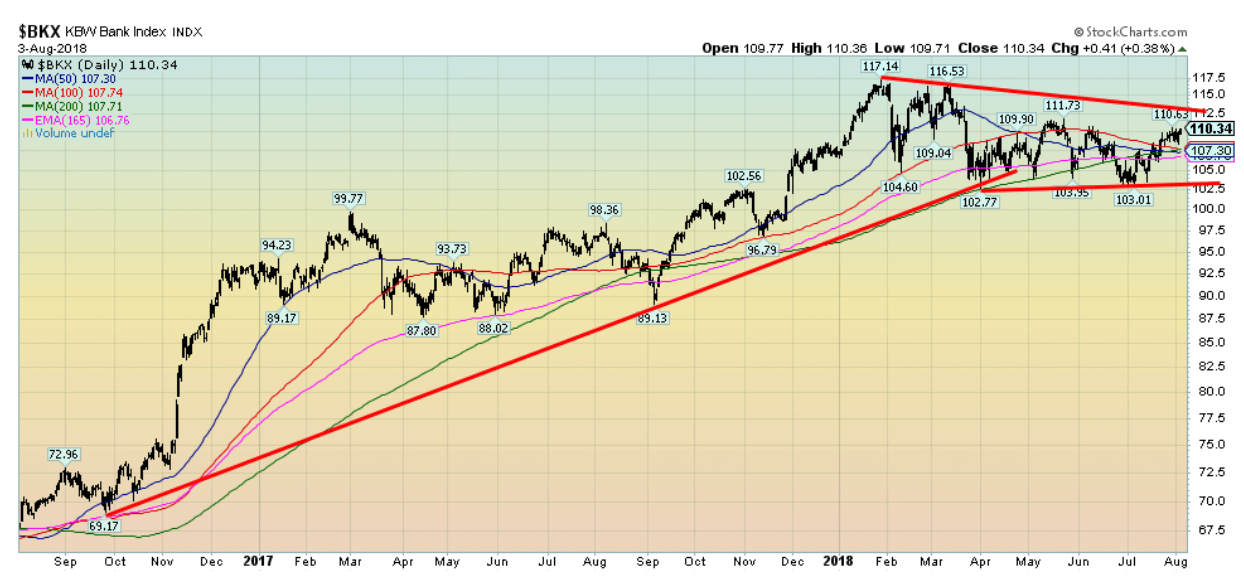
The KBW Bank Index (BKX) appears to be forming a large topping pattern. The top was seen earlier in the year and, like the broader markets, it has failed to make new highs. Indeed, it struggles to keep its head above the converging MAs. Overall. the BKX looks weaker than the S&P 500 and since the financial industry is so key to the market it is not a positive sign.
© David Chapman
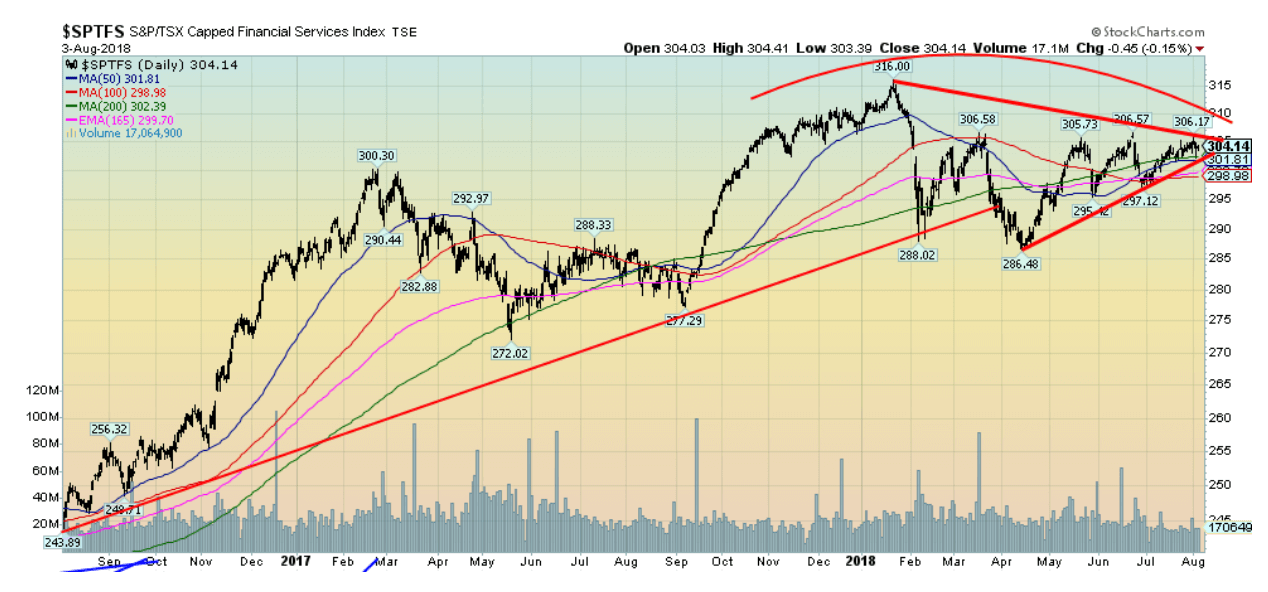
Like the BKX, the TSX Financial Index (TFS) appears quite weak. The fall it suffered in February to April was worse than what was seen in the U.S. markets. It has struggled back but remains below the highs of January 2018. It appears to be forming a large triangle pattern that we interpret as a topping pattern. A firm break of 300 might send the TFS tumbling lower.
© David Chapman
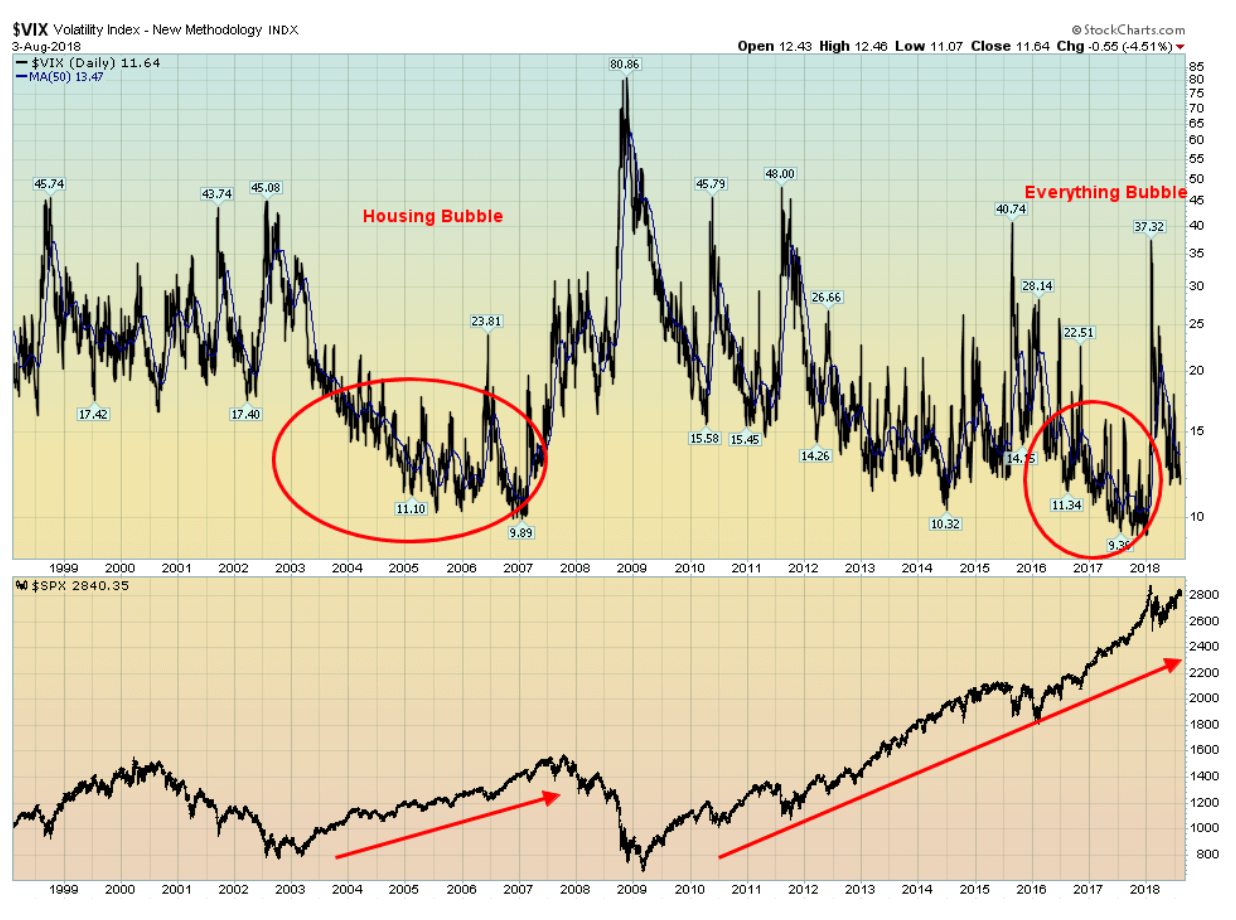
The VIX volatility index is a measurement of fear and greed in the stock market. A low VIX signifies greed and a high VIX fear. It moves inversely to the S&P 500. The exceptionally low VIX during the period 2004–2006 reflects the housing bubble and the similarly the low VIX from 2015–2018 reflects the “everything” bubble. The VIX jumped in February when the markets fell, but it has come down once again, reflecting greed and no fear that the market might fall. We note there was a jump in 2006 before another run to the downside in 2007. Of course, what followed was the financial crash of 2008. The current decline is looking like that one.
© David Chapman
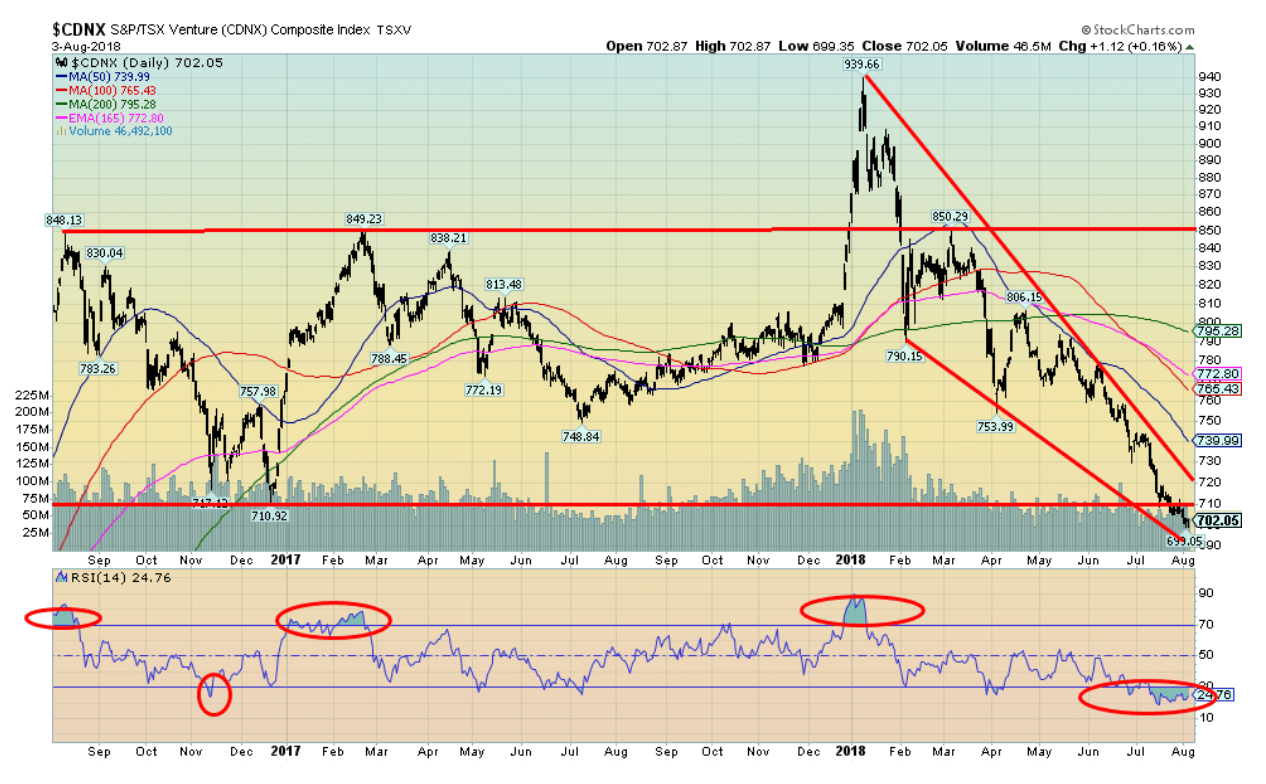
We keep showing this chart of the TSX Venture Exchange (CDNX) because it is so compelling. The descending wedge triangle that appears to be forming is a large one. A firm breakout over 720 would suggest to us to that the CDNX is headed back to at least the former highs near 940. The sentiment toward the CDNX is off the charts, as negative as we have ever seen. Junior mining stocks that trade on the CDNX can report excellent results and the price falls.
Nobody cares. The CDNX has made new 52-week lows again. The RSI is off the charts although currently near 25. Junior mining companies are converting into marijuana companies. At the bottom of the market in the early 2000s, they were converting into high-tech or dot.com companies. Yet, despite all this misery, many junior mining companies, especially gold explorers, really haven’t lost all that much. But these companies are the lifeblood of the industry because if no one is looking and exploring, then there will soon be a supply crunch.
US job numbers
© David Chapman
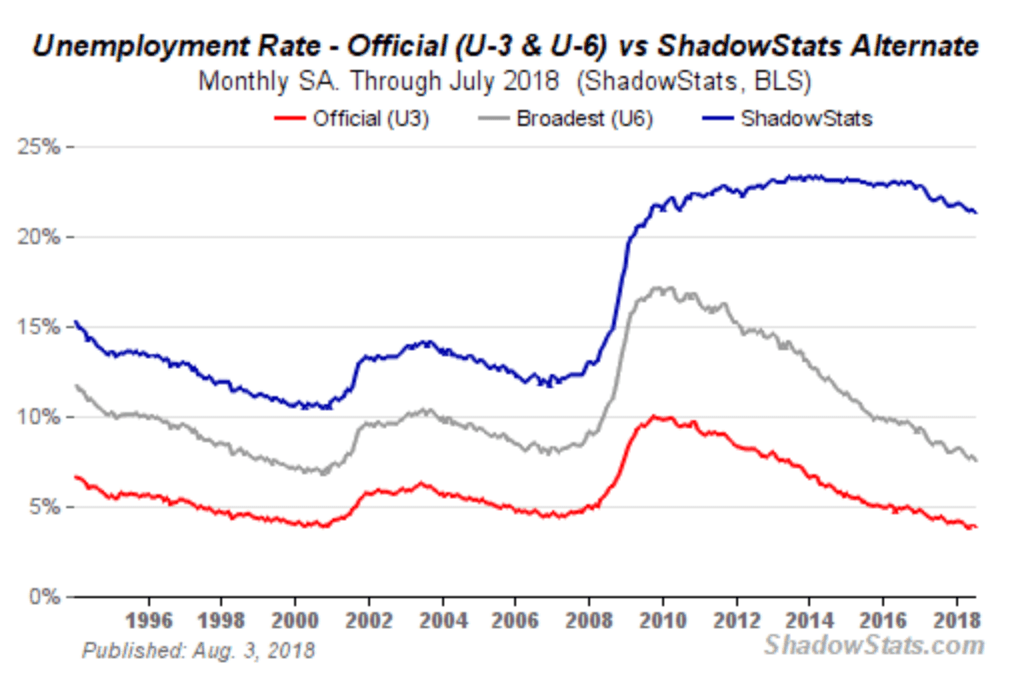
The July job numbers came out on Friday, somewhat weaker than expected. July’s nonfarm payrolls were reported as 157,000 when the market expected 193,000. The unemployment rate (U3) fell to 3.87 percent from 4.05 percent while the U6 unemployment rate, the Bureau of Labor Statistics (BLS) highest category fell to 7.54 percent from 7.79 percent. The U6 unemployment rate is U3 plus short-term discouraged workers, and other marginally attached workers plus part-time workers seeking full-time employment. The Shadow Stats unemployment number fell to 21.3 percent from 21.5 percent. The Shadow Stats number is U6 plus long-term unemployed workers defined out of official existence in 1994.
Analysts were encouraged by the fact that the unemployment rate for high school dropouts fell to 5.1 percent in July. That suggested they were coming back into the market. The not in the labor force category came in at 96,011 thousand vs. 95,915 thousand in June. Of that, 52,292 thousand are retirees. The labor force participation rate was unchanged at 62.9 percent with the core 25–54 age group also steady at 81.8 percent. Total employed persons were 155,965 thousand in July vs. 155,576 thousand in June, a gain of 389 thousand. The total unemployed fell to 6,280 thousand vs. 6,574 thousand in June. Part-time workers were listed at 27,028 thousand vs. 26,883 thousand in June. Total job vacancies fell to 6,671 thousand in July vs. 7,195 thousand in June.
Despite all these so-called good numbers, 80 percent of Americans say they live paycheck to paycheck. We suspect it is not much different in Canada. Many university grads are working in jobs they are overqualified for, while there is an army of contract workers with no job security and no benefits. Many part-time workers really want full-time jobs and many work two jobs. In the numbers, there is a certain amount of double-counting, so if a worker holds two jobs he is counted as being employed twice, making it appear it is two people and not the same person. Wages remain stagnant and job benefits are for some, not all. Average wages are around $44,500, the same basically as it was 40 years ago, adjusted for inflation.
Canadian employment is out this Friday.
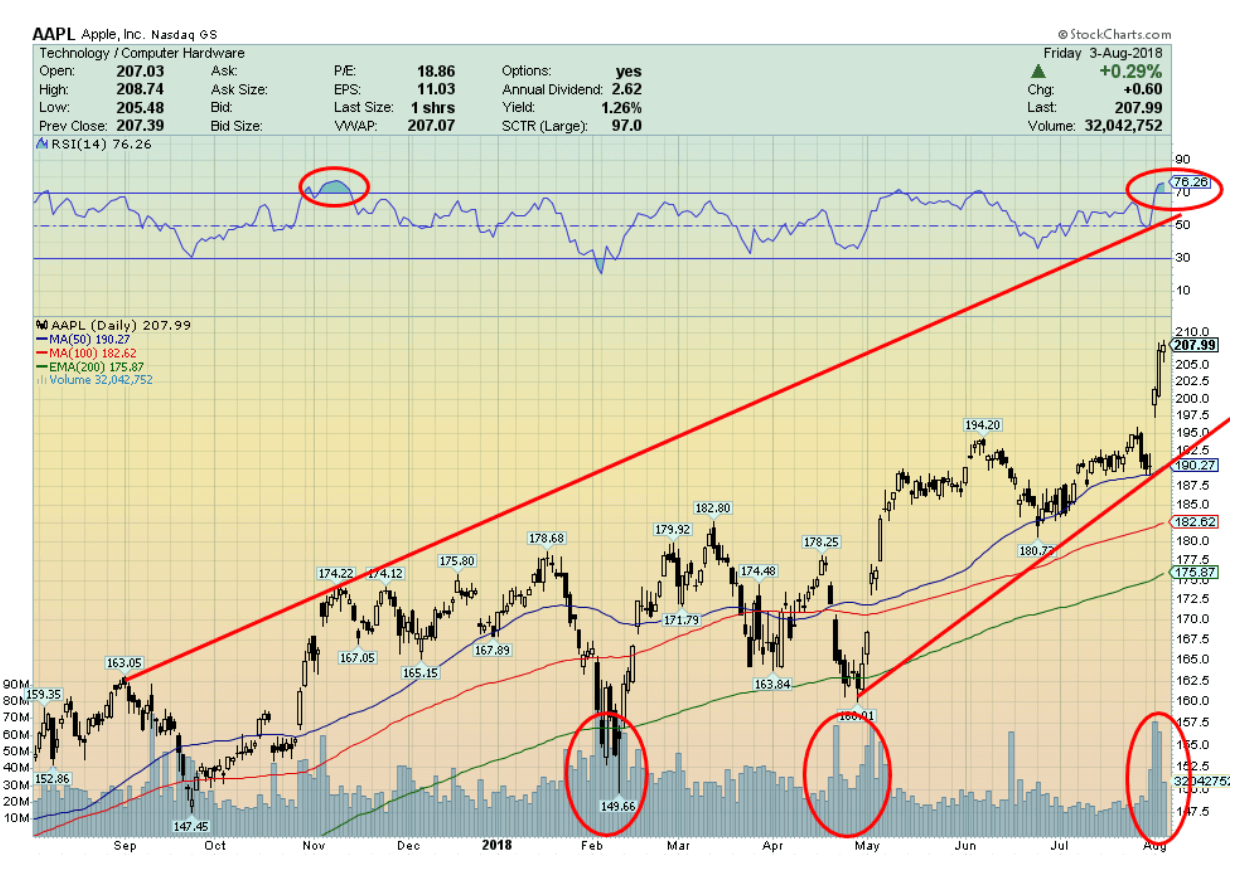
© David Chapman
It’s the trillion-dollar man. Yes, Apple (AAPL-NASDAQ) hit a record high this week as the company is now worth $1 trillion. But don’t get too excited. Apple wasn’t the first. PetroChina (PTR-NYSE) hit the trillion-dollar mark way back in October 2007. After that it collapsed 78% as the 2008 financial collapse got underway. Today it still sits down 62% from that illustrious high. How the mighty have fallen.
To put Apple in some perspective, with a market cap of $1 trillion it represents roughly 1% of the world’s GDP which is estimated at $80.6 trillion. Apple is bigger than 183 out of 199 countries listed at the World Bank by GDP. Apple is roughly 5% of the U.S.’s GDP of $19.3 trillion. Apple is also bigger than most stock exchanges around the world, including Spain’s, Mexico’s, Singapore’s, and Saudi Arabia’s. Apple is the equivalent of the combined net worth of the 11 richest people in the world. It is now bigger than the U.S.’s budget deficit, although Trump is doing a great job of catching up.
Is Apple the biggest company ever? Well, maybe, but maybe not. Let’s have a different look.
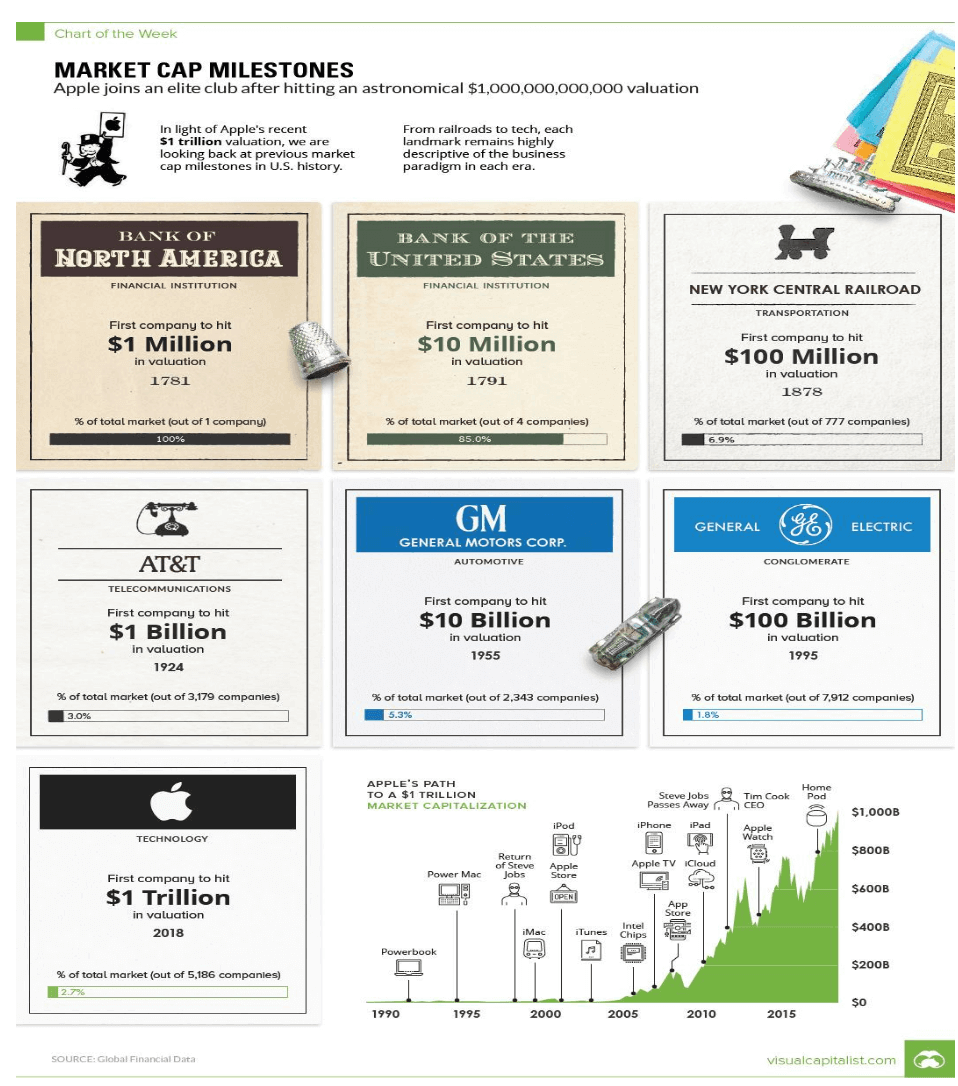
© David Chapman
Here’s a nifty little chart that shows the evolution of companies by market cap. It is, when one looks at it this way, an astronomical amount. But is it? Way back in 1878, the NY Central Railway became the first company to hit $100,000,000. So, what would Apple’s $1 trillion be worth in 1878? Well, only about $40,000,000. NY Central Railway would have been worth in today’s dollars $2.5 trillion. Sorry, Apple. You just don’t cut it.
© David Chapman
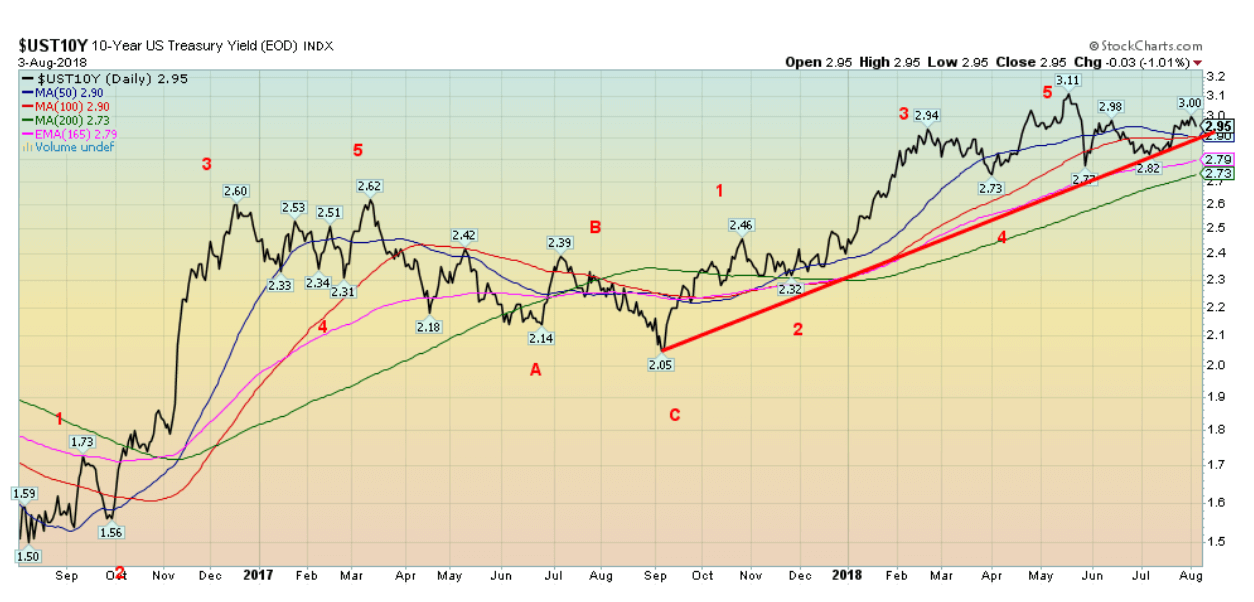
The U.S. 10-year Treasury note failed to hold above 3.00% this past week as it slipped back under closing at 2.95%. Friday’s weaker than expected nonfarm payroll helped push the 10-year down 3 bp on Friday. If the 10-year is put in new highs then it is essential to remain above 3% so that a push above the 3.11% high can be considered. The uptrend remains in place, but it is faltering. A break of 2.90% could send the 10-year lower towards 2.75%. 3% remains resistance.
The Fed met this past week and it was no surprise that they left interest rates unchanged. With GDP growth coming in stronger than expected the Fed underscored the fact that a rate hike is to be expected in September.
Recession watch spread
© David Chapman
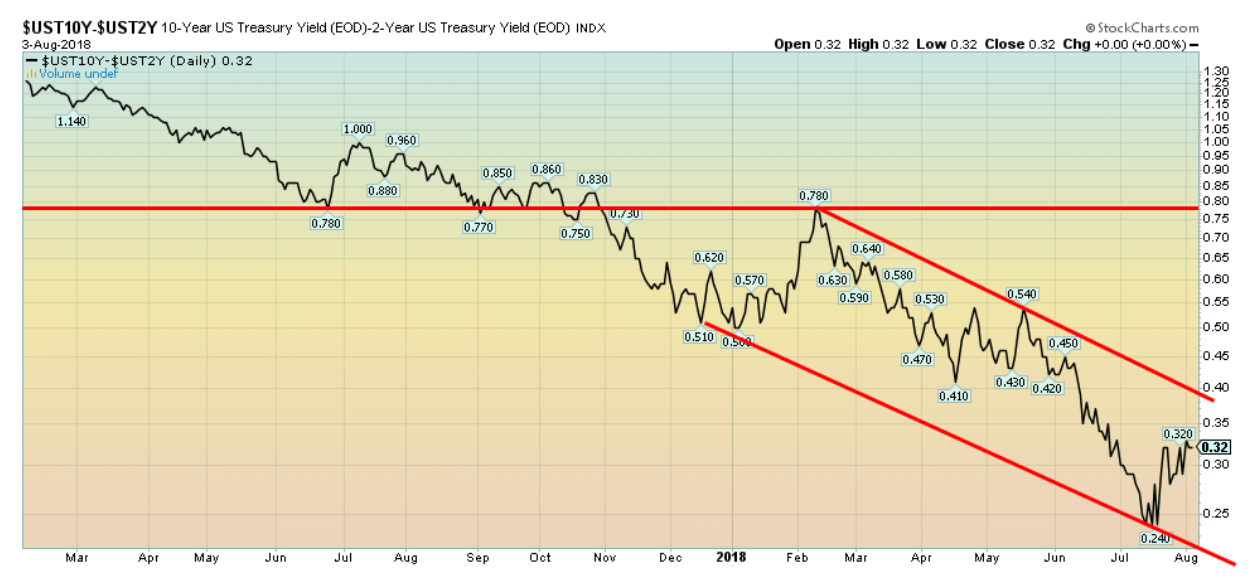
Friday’s weak nonfarm payrolls helped push the U.S. 2-year Treasury note lower by 3 bp and as a result the 2–10 spread widened slightly this past week to 32 bp. The trend remains to the downside. Only a breakout above 40 would turn the spread to the upside. The 2–10 spread appears to be in a down channel with the bottom near 20. The past few recessions have seen a negative 2–10 spread for 4 to 6 months before the onset of a recession. We maintain that the 2–10 spread could turn negative in 2019 following two more rate hikes and more possible rate hikes in 2019. Fed funds continue to predict another rate hike in September and probably December as well.
© David Chapman
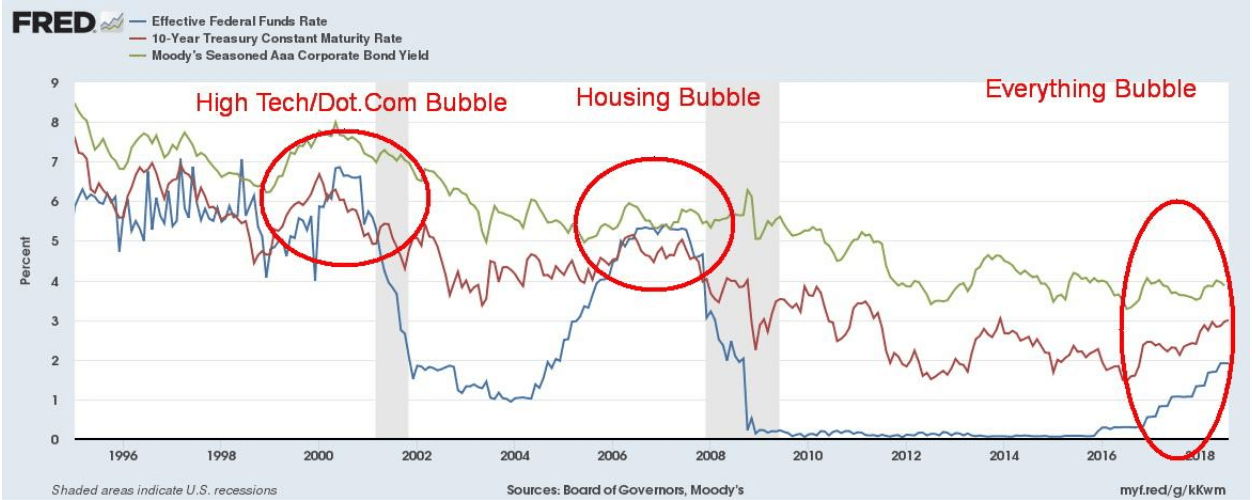
This chart of interest rates since the mid-1990s shows clearly how low interest rates contributed to the debt and stock market bubble we have seen grow since the financial crisis of 2007–2009. Rarely, if ever, have we witnessed such a sustained period of low, even negative interest rates for such a long period of time as we have seen from 2009 to present. Despite the recent rise in interest rates they are still low by historical standards, especially when measured more recently against the level of interest rates seen in the late 1990s before the peak in the high-tech/dot.com bubble and even before the top in the housing bubble in the mid 2000s.
This is another reason why we believe the coming crisis will also outstrip the two previous collapses. It is also doubtful that the current rise in interest rates is over as the Fed has indicated two more in 2018 and probably more in 2019. The corporate AAA rates (green line) have barely budged compared to the rise in Fed Fund (blue line) and a rise in the U.S. 10-year Treasury note (red line). You can also see how the Fed Fund rate crossed over the 10-year before the collapse. To quip a famous phrase—beware!
© David Chapman
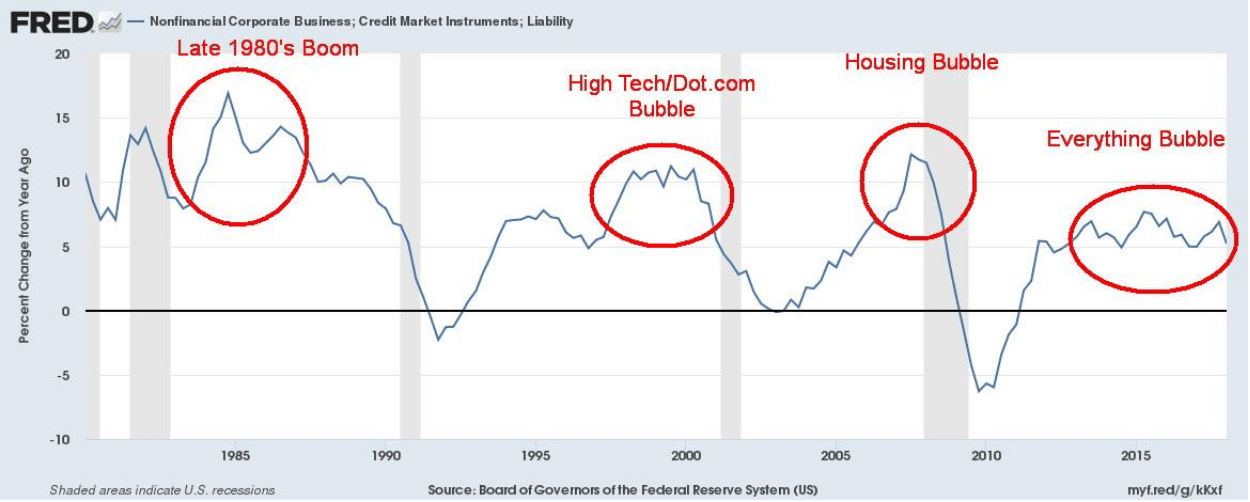
This is merely another way of looking at the same thing. This one shows the year-over-year annual % change of corporate debt outstanding. Notice how it rises as interest rates fall and the bubble is created. We can see that in the late 1980s boom, the high-tech/dot.com bubble, and the housing bubble. Sure, the current pace is lower percentage-wise, but it has been more sustained and it is occurring at higher levels then it did in the previous bubbles. When the shock hits the system, the decline is rapid. Could the current one be making what appears as a small head and shoulders top?
© David Chapman
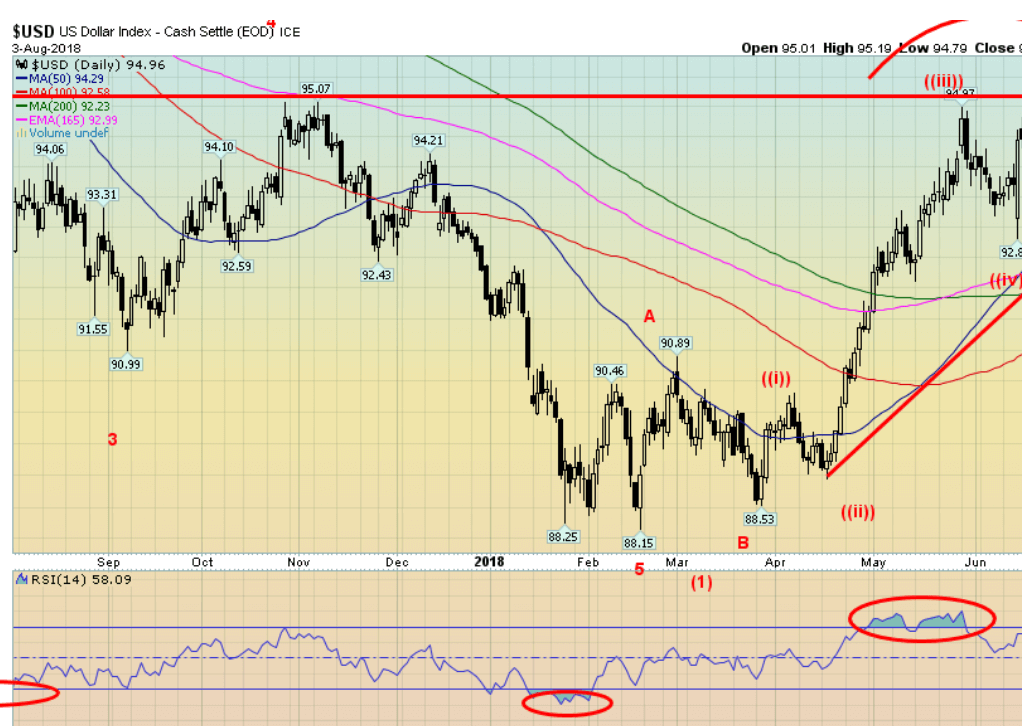
The US$ Index was sparked higher this past week by positive comments from the Federal Reserve. Trump threatened more tariffs against China and, in return, China threatened more tariffs on the U.S. It’s a never-ending game, except nobody has really done anything yet. They just threaten. Despite all the threats, the US$ Index rallied. That meant others fell. The Euro was off 0.8%, the Pound fell 0.8% thanks to Brexit sabre rattling, while the Japanese Yen was off a small 0.2%. The Cdn$ bucked the trend, rising about 0.7% thanks to stronger than expected GDP numbers. The US$ Index continues to wedge itself up against resistance around 95.
We could argue it is forming an ascending triangle given that series of rising lows against a flat top, the definition of an ascending triangle. If that is the case, then a firm bust over 95.25 and the recent high at 95.44 could push the US$ Index to new highs with a potential target up near 98. That wouldn’t be particularly good for gold or commodities. However, in the past we have seen stranger things and sometimes gold rallies with the US$. A break of 94 might begin to shift this scenario and a break under 93.50 would likely send the US$ Index back down to at least 92. Curiously, the Euro commercial COT is at 45%, a level associated with rallies of the Euro in the past. Gold also rallied on Friday despite the strong week for the US$ Index, although Friday’s action was flat.
© David Chapman
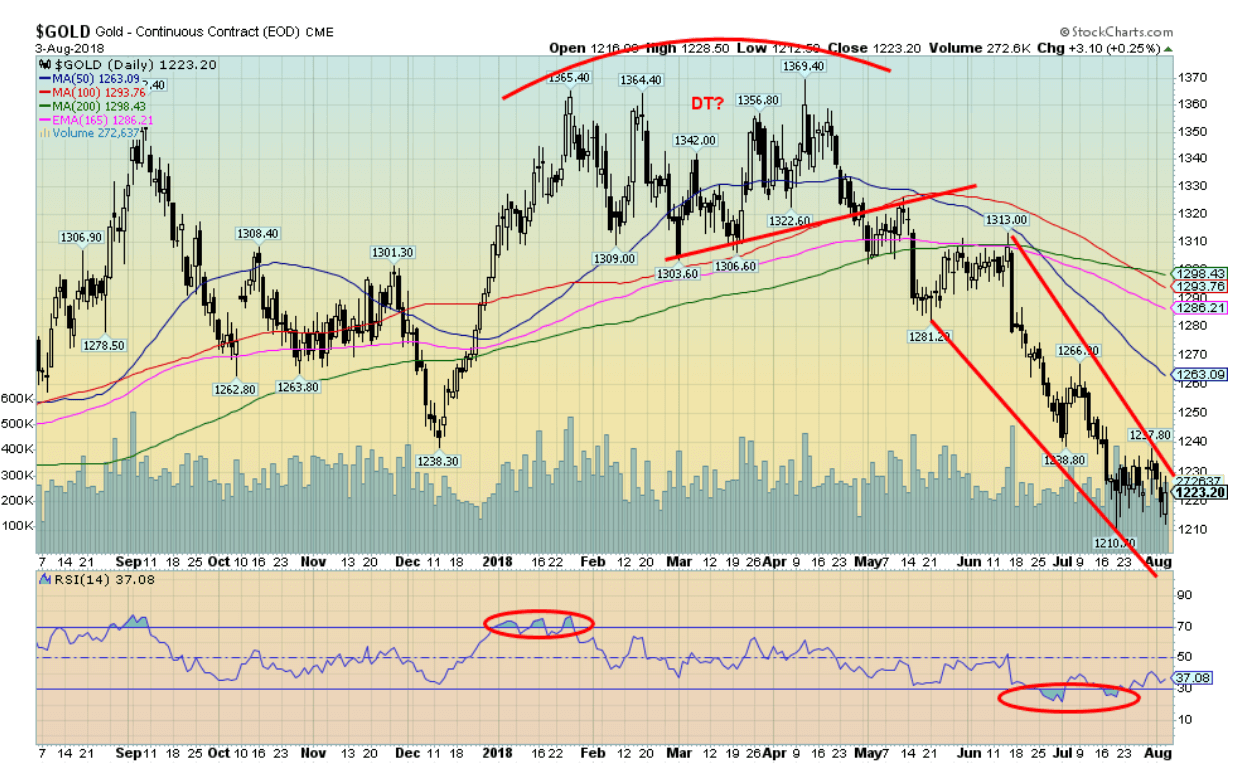
Gold was essentially flat on the week, thanks to the weak nonfarm payrolls on Friday as gold gained about 0.3%. Gold did not see new lows this past week, so $1,210 remains it for the time being. There is key support ranging from $1,190 to $1,210. A break of that zone would be far more bearish and could imply continued declines towards $1150. Sentiment towards gold, silver, and the gold stocks is as bad as we have seen it since the bottom in December 2015.
A reminder that was a major low. Friday’s action saw an outside day reversal for gold as it made a lower low, then a higher high and a higher close than the previous day. It would have been more meaningful if that had happened on a low day for the move, but it didn’t. Still, it is a potentially positive sign. Seasonals should be turning positive and it is possible Friday’s action was the first sign. Still gold has work to do. A break above $1,230 would be positive, but we believe we need a break and close above $1,240/$1,250 to confirm a bottom. Given the exceptionally weak sentiment, it is noteworthy that in 2016 gold had a powerful rally following the exceptionally weak sentiment seen in December 2015 going from $1,045 to $1,377.
A similar move today could take gold up to $1,540. Major resistance remains at $1,370. Gold has been pressured lower by a strong US$ and a continued strong U.S. economy. Even the Fed is upbeat about the U.S. economy. As a contrarian, we’d exercise caution about that. While, overall, gold demand supposedly remained soft in Q2, what was noteworthy was strong buying by Russia and Iran. Iran purchased some 15.2 tonnes in Q2, their highest in four years.
U.S. sanctions helped spark demand as it was a hedge against sanctions and a falling Iranian Rial. While Chinese demand was not noteworthy according to the World Gold Council, others are saying demand remained strong in China in Q2. Friday’s action for gold was positive, but what is needed now is follow-through this coming week. Above $1,230 would be the first positive sign but, really, a close above $1,240/$1,250 would confirm that a low is in.
© David Chapman
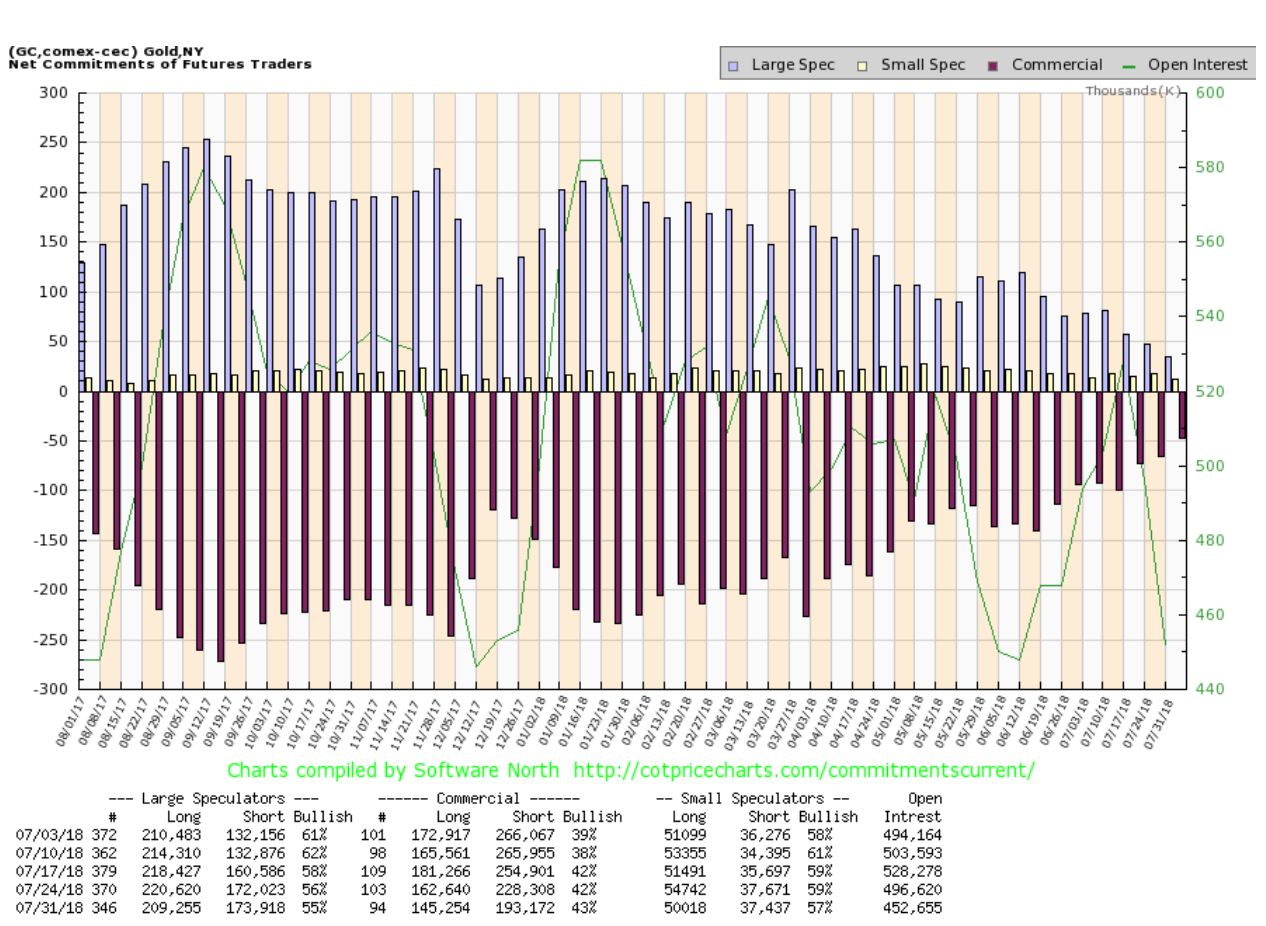
The gold commercial COT rose slightly this past week to 43% from 42% the previous week. Long open interest fell roughly 17,000 contracts; however, short open interest also fell down roughly 35,000 contracts as the commercials continued to shed their shorts. The decline in longs might have had to do with spreads. The large speculators COT (managed futures, hedge funds) slipped to 55% from 56% and managed futures have record shorts on. That should be a positive sign for gold going forward.
© David Chapman
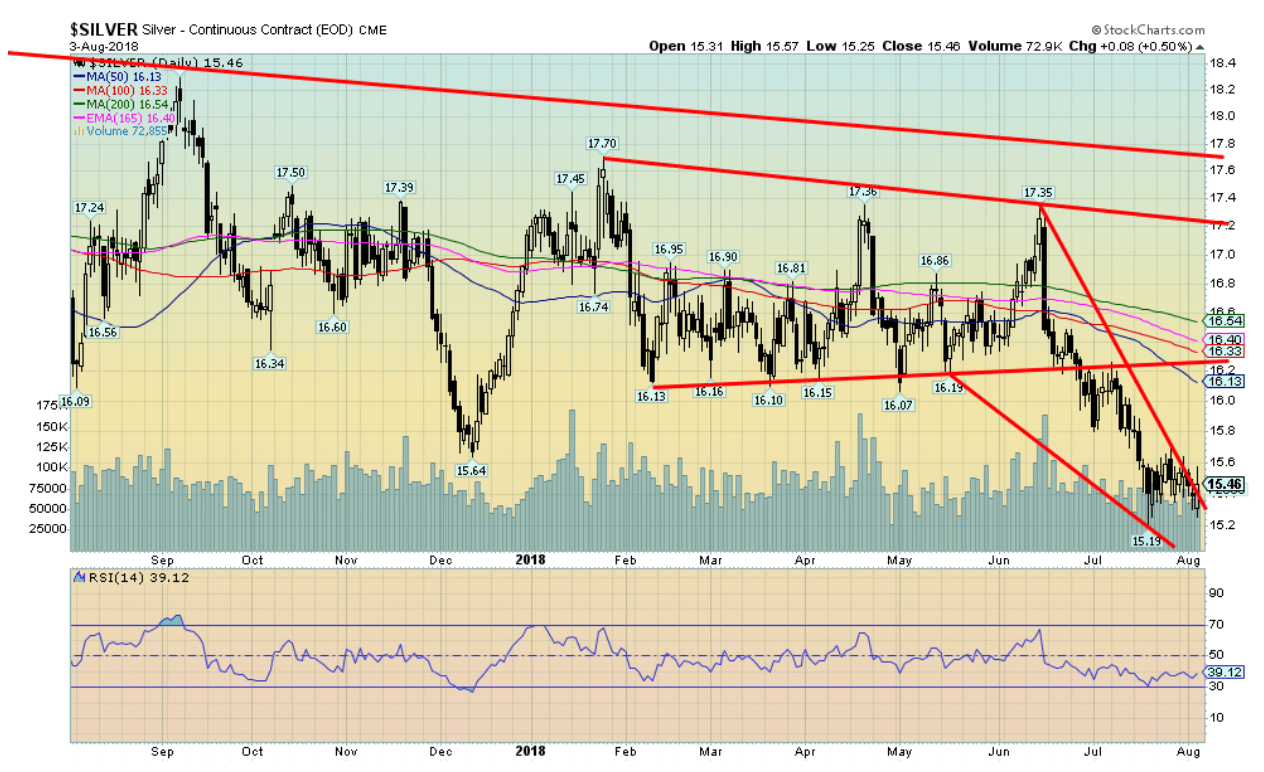
Silver prices fell a small 0.3% this past week even as Friday was a positive day with a gain of 0.5%. Friday’s action was actually an outside reversal day as silver made a lower low from the previous day, then reversed and made a higher high and a higher close. Silver, however, did not see new lows for the move down. The low so far is seen at $15.19. The key MAs seem a long way off, ranging between $16.13 and $16.54.
Regaining $16 would be positive, but we’d feel more comfortable seeing silver regain at least above $16.40. Silver has fallen 11% since June. A rather unexpected decline, but, like gold, it has been driven by the strong US$ and the strength of the U.S. economy. Friday’s nonfarm payroll helped both gold and silver to gains on Friday. Sentiment towards silver remains very low and that, in turn, is often what sparks a turnaround. Regaining $15.70 would be the first good sign that a low might be in.
© David Chapman
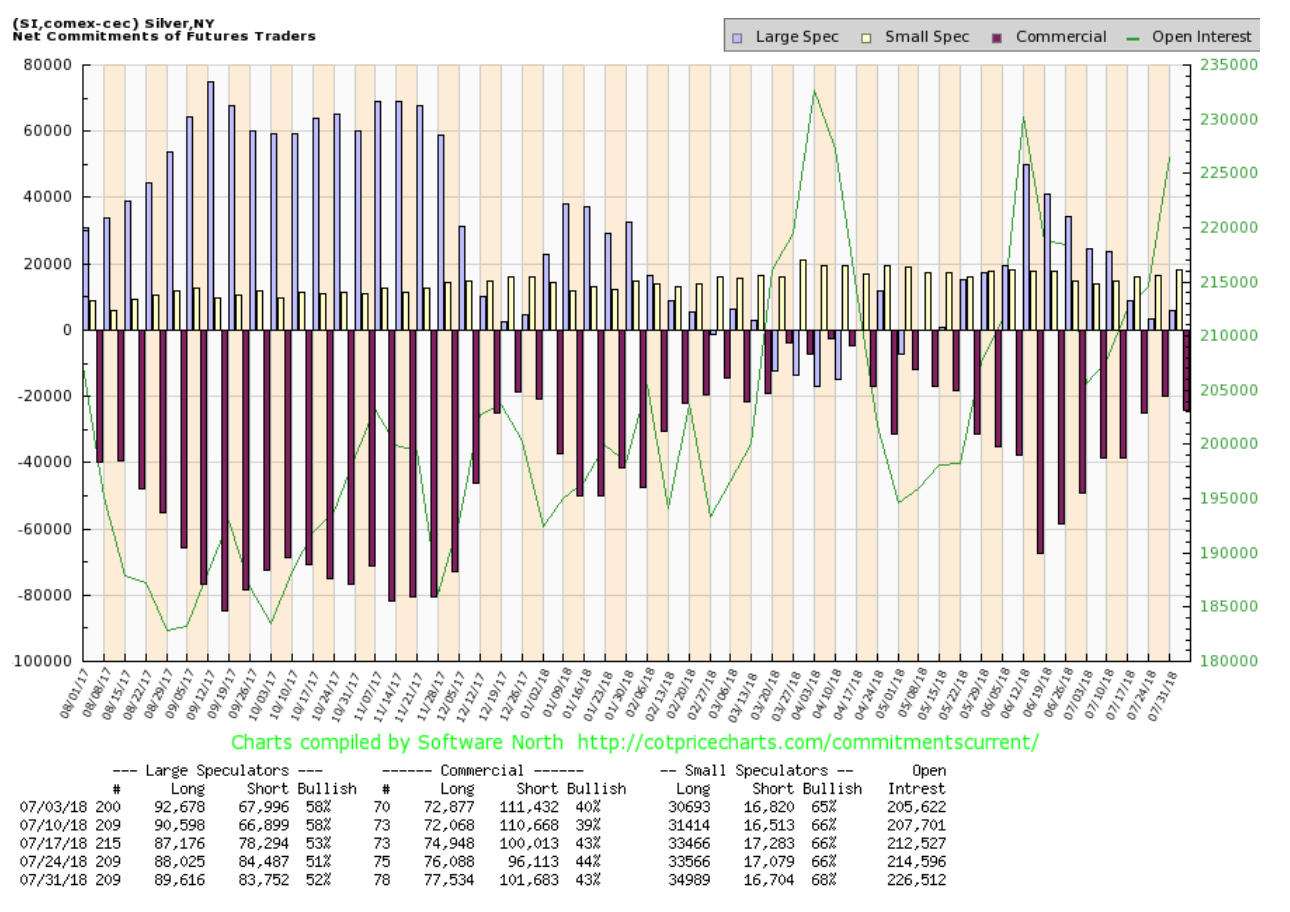
The commercial COT for silver slipped slightly this past week to 43% from 44%. Long open interest rose about 1,500 contracts while short open interest rose over 5,000 contracts. The large speculators COT rose slightly to 52% from 51%. The week was essentially flat and, overall, the COT remains friendly towards silver.
© David Chapman
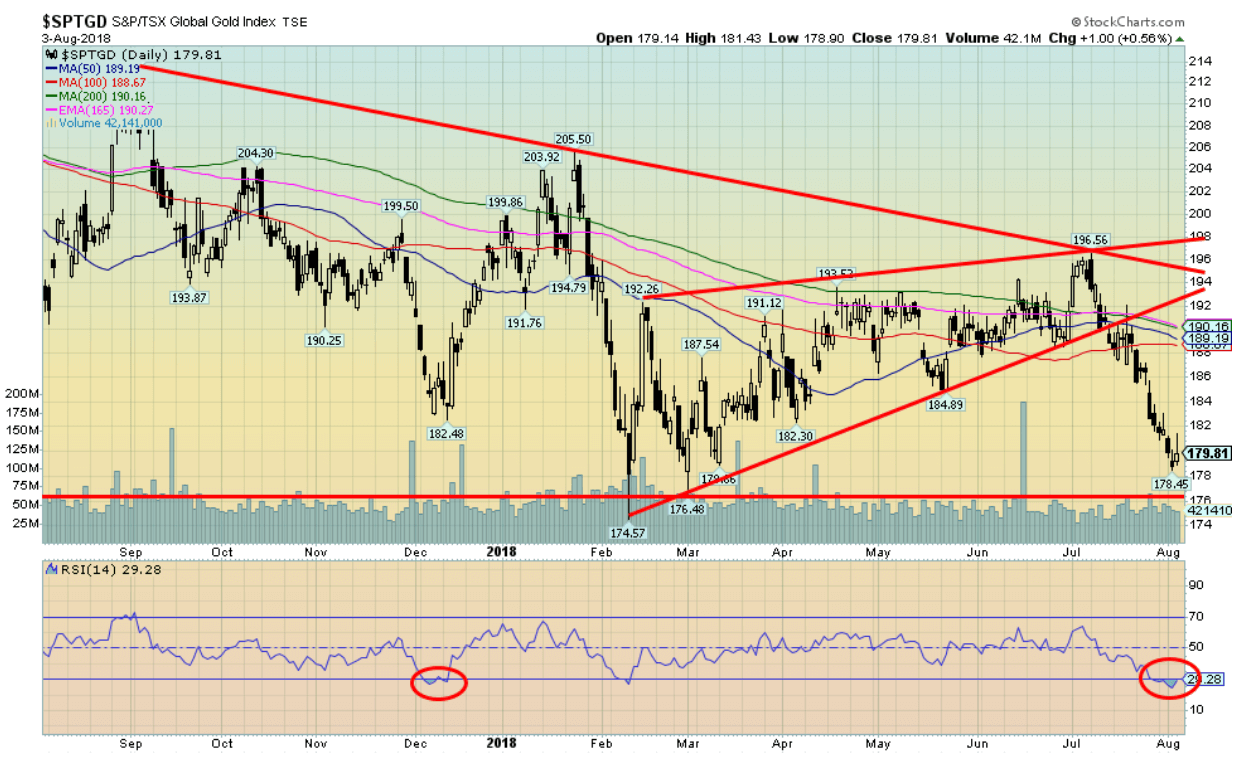
Misery continues for the gold stocks as the TSX Gold Index (TGD) fell another 1.3% this past week and is now down 8.1% on the year. The Gold Bugs Index (HUI) also suffered, falling 0.6%, and is down 14.4% on the year. One has to wonder why anyone would want to buy or own gold stocks. The sentiment is as rock bottom as we have ever seen it—despite rumblings of potential suitors for Detour Gold (DGC-TSX) recently that helped propel Detour out of its misery. The TGD fell to a low this past week at 178.45 which is not far from the February lows of 174.57 and 176.48.
Any further decline and we could be recording new 52-week lows. We are supposed to be moving into a seasonal sweet spot for gold and silver and that, in turn, would propel the gold stocks higher. The week ended on a positive note with the TGD gaining 0.6% on Friday. Indicators are oversold, but oversold is merely a term and does not necessarily signal a bottom. Right now, the key MAs seem distant, up near 190 or about 5.5% away.
Major resistance remains up to 194 while key support is now 174/175. Given oversold conditions and potential seasonal positivity, our expectations are that a rebound should soon get underway. The first sign of a rebound would be the TGD regaining above 183. The Gold:HUI ratio remains high at 7.43, but is off recent highs near 7.80. The ratio would be more neutral under 5.5. The ratio continues to tell us the gold stocks are cheap in relation to gold.
© David Chapman
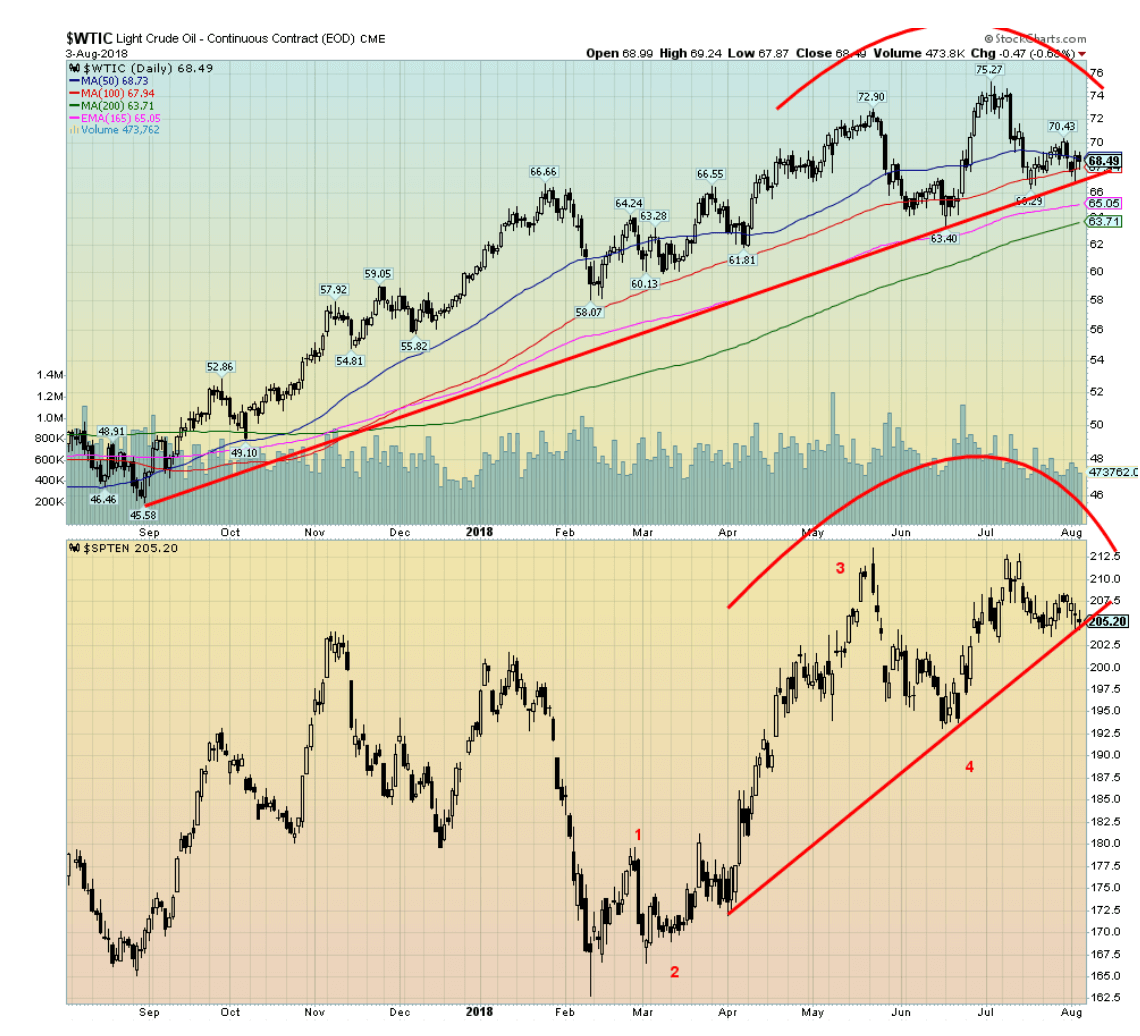
WTI oil was basically flat this past week with a small loss of 0.3%. The geopolitical scene remains positive for oil with threats against Iran coming from both the U.S. and Israel, while Iran threatens to shut the Straits of Hormuz, the world’s most important oil chokepoint. Iran threatens to block the straits only if attacked. Nonetheless, Iran is planning a naval exercise near the straits. About 20% of the world’s oil passes through the Straits of Hormuz.
Oil demand remains robust through the summer driving season. Seasonally, oil and, by extension, energy stocks tend to do best between December and July. They do poorest between September to November. August might be a transition month. And, so far, that seems to be how things are shaping up as both WTI oil and the TSX Energy Index (TEN) appear to be forming a top pattern. The TEN may have completed five wave ups from a low last February.
Trader sentiment is a bit more cautious as the commercial COT is reflecting weak sentiment. Global supply continues to weigh on the market as well as Saudi Arabia has pumped up output to offset possible losses of Iranian oil because of sanctions. Venezuelan oil is also impacted by sanctions.
A break under $66 could suggest a decline to $63. Only new highs might change this scenario and the little we see suggests new highs are imminent unless things blow up in the Mid-East. It is noteworthy that Iraq invaded Kuwait some 28 years ago on August 2, 1990.
Chart of the week (1)
© David Chapman
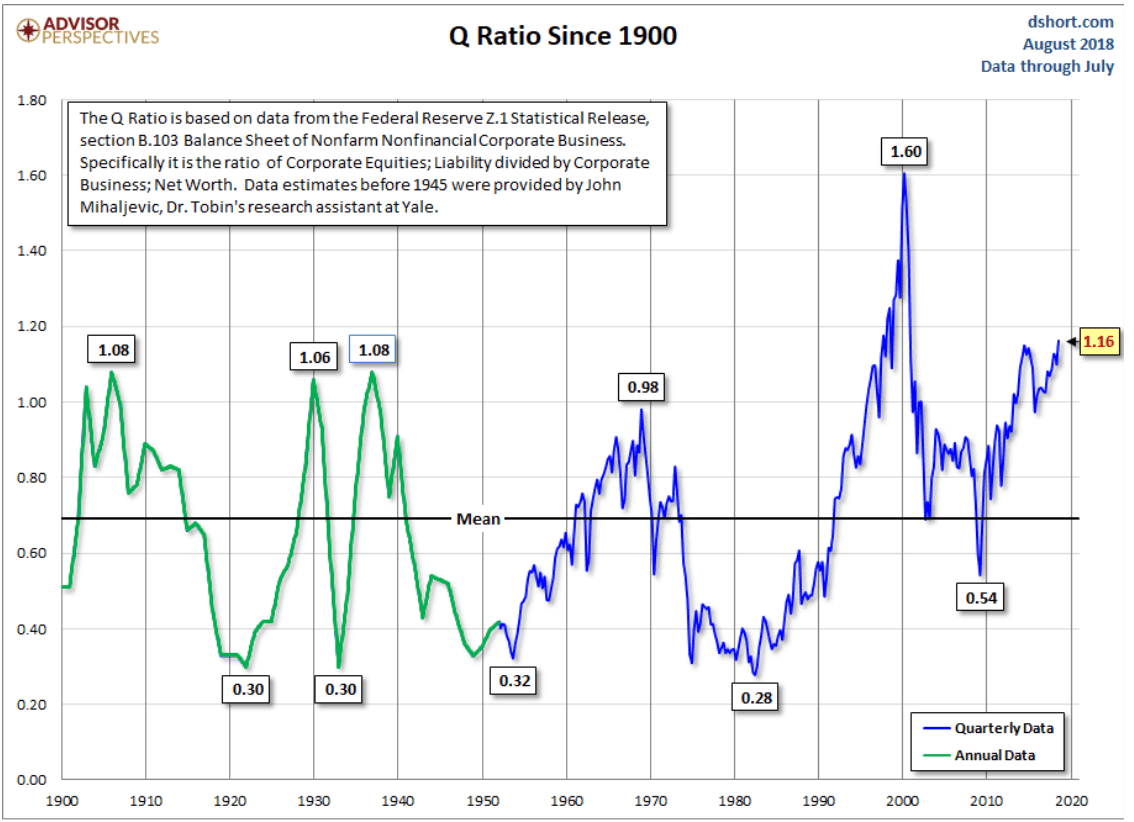
The Tobin Q Ratio was developed as a method for estimating the fair value of the stock market. Apparently, it is a simple concept but laborious to calculate. It takes the total price of the market divided by the replacement cost of all its companies. The Fed keeps the data. So, the creators and calculators of the ratio use Z1-Financial Accounts of the United States.
The data always lags by about two months, and since Z1 is only released quarterly one has to wait another three months for updated data. Still, it is quite useful. Notice the big jump in the Q ratio before market collapses in 1930, 1937, the late 1960s, especially the one before the high-tech/internet/dot.com bust of 2000–2002, and the current levels. Following the 2000–2002 collapse it popped back, but didn’t reach previous heights before the 2007–2009 financial collapse. No, it doesn’t tell when the market is going to fall and it can go higher. But it is at least a warning sign that one should be cautious going forward.
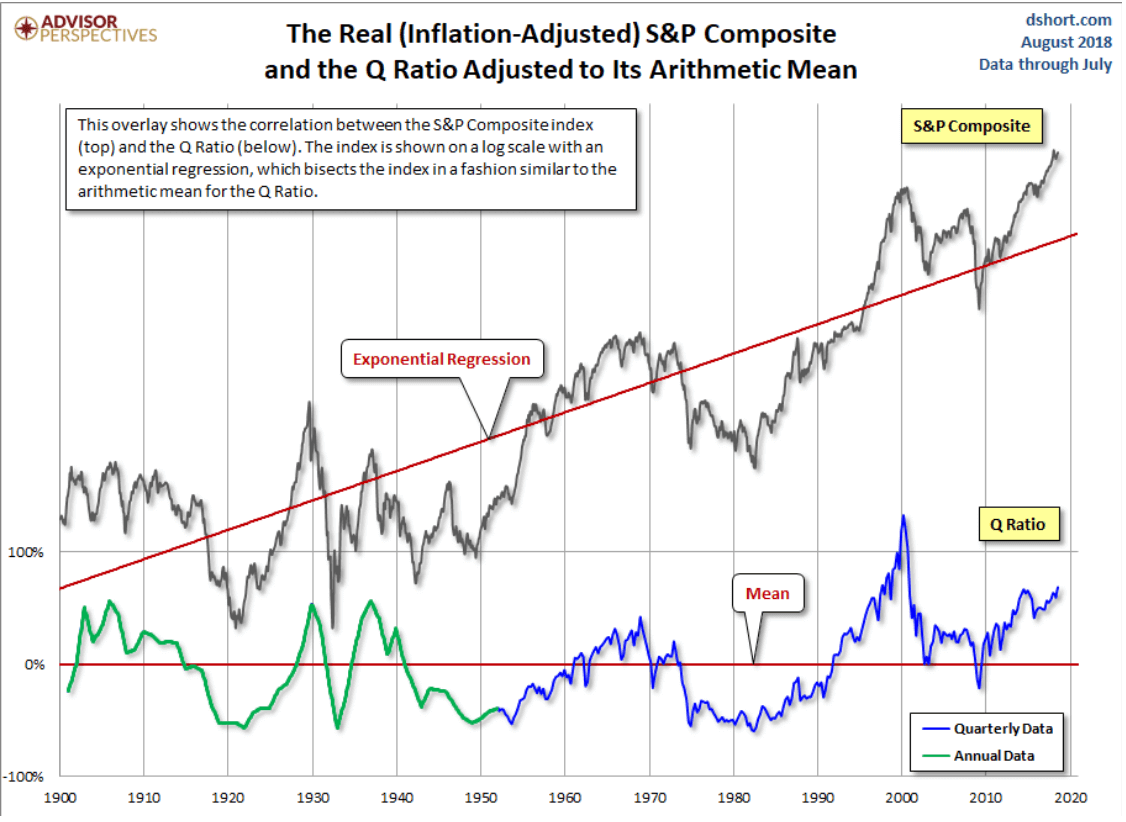
© David Chapman
The second half of our Q ratio charts shows the Q ratio against the backdrop of the S&P 500 on an inflation-adjusted basis. The S&P 500 has a long-term exponential regression uptrend line attached to it. It is similar to the mean shown for the Q ratio. What one should note is whenever things get out of line it always returns to the mean, usually by spending a period of time under the mean to offset the period of time above the mean. Right now, the S&P 500 is signaling that it is further above the mean exponential regression line then it was even before the 2007–2009 collapse. Time, we suspect, is running out on this market and, in all likelihood, it is merely a question of when, not if, the S&P 500 is returned to its mean.
(All charts are courtesy of Stock Charts and COT Price Charts.)
—
DISCLAIMER: David Chapman is not a registered advisory service and is not an exempt market dealer (EMD). We do not and cannot give individualized market advice. The information in this article is intended only for informational and educational purposes. It should not be considered a solicitation of an offer or sale of any security. The reader assumes all risk when trading in securities and David Chapman advises consulting a licensed professional financial advisor before proceeding with any trade or idea presented in this article. We share our ideas and opinions for informational and educational purposes only and expect the reader to perform due diligence before considering a position in any security. That includes consulting with your own licensed professional financial advisor.


PayPal’s Slowdown: From Fintech Leader to Low-Growth Dividend Stock
PayPal has shifted from fintech leader to low-growth, value-style stock, losing over 25% in market value and trading at a...


Tilray (TLRY) Falls as Bearish Momentum Persists Despite Marketing Push
Tilray (TLRY) fell 3.32% to $4.44, remaining below key moving averages and signaling continued bearish pressure. Despite a £1 million...


ESG Gap Persists as Firms Struggle to Link Sustainability to Financial Value
KPMG’s Global Survey shows a major gap between ESG awareness and financial integration. While 72% of managers understand sustainability strategies,...


Bitcoin and Ethereum Slide as Market Pressure Builds Amid Strategy Concerns and Layer 2 Disruptions
Bitcoin fell below $60,000 with heavy ETF outflows, pressured by concerns over Strategy’s finances and its STRC stock decline. Ethereum...


AI Venture Builder Launches €600K Crowdfunding Round to Scale Secure AI Solutions
AI Venture Builder, an Italian-British firm developing AI applications and vertical startups, returns to CrowdFundMe with a equity campaign. After...
 |
|
 |  |
 |
|
-

 Crowdfunding1 week ago
Temotiva Launches Crowdfunding Campaign to Advance Preventive Mental Health
-
 Crypto3 days ago
Bitcoin Holds Steady as Microtransactions Surge and ETF Inflows Continue
-

 Biotech1 week ago
AseBio 2025 Report Highlights Growth and Future Potential of Spanish Biotechnology
-
 Cannabis1 day ago
Tilray (TLRY) Falls as Bearish Momentum Persists Despite Marketing Push
You must be logged in to post a comment Login