Markets
The unemployment rate fell to 4.3% and the stock market made new highs
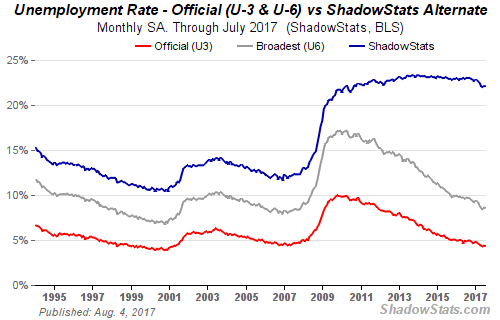
The jobs numbers were stellar, but were they as stellar as reported? As noted, the unemployment rate (U3) fell to 4.3% from 4.4%. However, it was reported in June the unemployment rate (U3) was actually 4.36% and fell to 4.35% in July.

Hallelujah! Happy days are here again. The jobs report released on Friday August 4, 2017 was a banner one. Better209,000 jobs were created in July, well above the expectations of 180,000 jobs. still, the June jobs numbers were revised upwards to 231,000 from 222,000. The unemployment rate (U3) fell to 4.3% from 4.4% while wages rose 2.5% year over year.
Overall, employment growth has averaged 184,000 monthly in 2017 vs. 187,000 in 2016. There was rejoicing all around. The stock market moved to new highs (again), albeit it was a lonely walk as only the Dow Jones Industrials (DJI) made new highs. The US$ Index had its best up day in months. But gold fell on the expectation that the Fed might once again hike interest rates. The Trump administration crowed on what great job creators they are ignoring the fact that at one time Trump declared the monthly job numbers to be fake.
The stellar jobs report almost overwhelmed the formation of a grand jury that was convened by special prosecutor Robert Mueller in Washington as they continued their probe into allegations of Russian interference in the November 2016 US election. Subpoenas have been issued to amongst others, President Donald Trump’s son, Donald Trump Jr. and the Russian lawyer they met. Others that may be subpoenaed include Donald Trump’s son-in-law Jared Kushner and Paul Manafort, Trump’s former campaign manager.
The convening of a grand jury is not in itself unusual. The reaction in markets at the news initially saw the stock market sell off and gold rally, the exact opposite of what took place following the release of the jobs numbers. It seems the jobs number “trumped” grand juries into potential allegations of Russian meddling and Trump campaign collusion. Both Russia and the Trump administration have denied any wrongdoing with Donald Trump describing it as a “witch hunt.” There have been rumors that Trump is preparing to fire Mueller and as a result, some senators—both Democrats and Republicans—introduced legislation to block Trump from firing Mueller.
But a grand jury does take this investigation to another level as it suggests that they may have evidence that could lead to criminal charges. As well, the investigation is moving into what one would call “follow the money.” What that means is apparently an examination of Trump’s tax returns could be on the table. The investigation could also delve into Trump’s business empire and a well-documented history of connections with Russian oligarchs and mobsters. And this is where the investigation could become dangerous and result in serious stock market ramifications. Attempts could be made to remove Mueller, which is the reason that some are taking action to prevent that from happening.
Trump signed the legislation imposing further sanctions on Russia, but it was clearly signed under duress as Trump declared that the legislation was significantly flawed and that it restricted his executive powers. Given the overwhelming support for the sanctions in both Congress and the Senate, they could easily override a Presidential veto. Russia had already retaliated with the expelling of a large number of diplomats and the seizing of properties used by the US. Donald Trump’s appointment of former military general John Kelly as Chief of Staff is bringing some discipline to the White House, a discipline that was sadly lacking before. Kelly has already shaken things up that saw the quick removal of Anthony Scaramucci as director of communications.
Naturally, it is hoped that the good news jobs story supersedes the formation of the grand jury. The good news on jobs will most likely only last until Monday. The grand jury and the investigation will drag on for months like a bad water drip.
(Source)
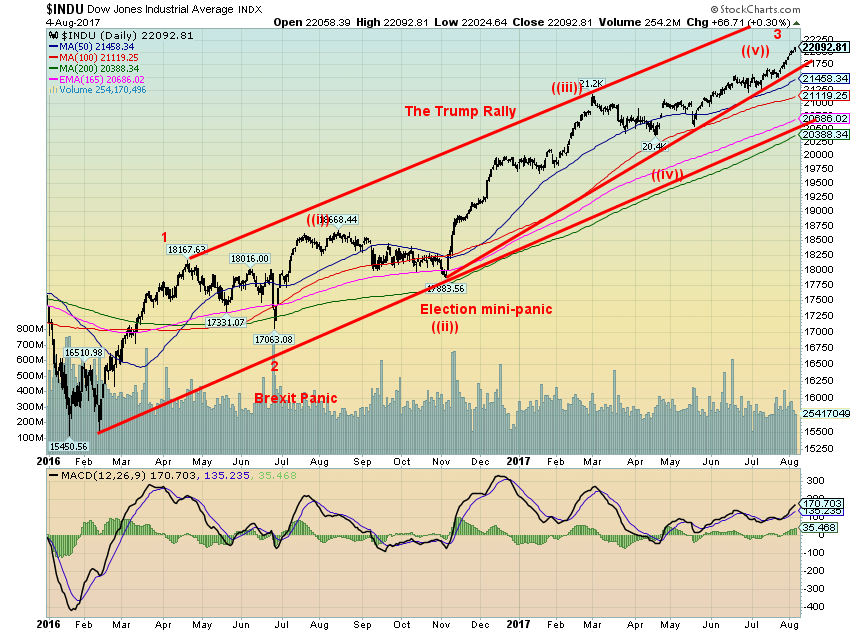
It is a lonely walk to the top. This past week the Dow Jones Industrials (DJI) was the only major US index that marched to new all-time highs. Not the S&P 500, the NASDAQ nor the Russell 3000 and especially not the Dow Jones Transportations (DJT). The MSCI World Index did make new all-time highs this past week but that is not a major US index. On July 27, 2017, a number of US indices had an outside reversal day. That potential key reversal remains in place making the DJI’s lonely walk look more and more out of step with the others. The DJT is already down 5% from its all-time high and the short-term trend has turned down while the intermediate trend has turned neutral. The Russell 2000 index (which-see below) also saw its short-term trend turn down this past week. The other indices are diverging negatively with the DJI. In order to confirm the new highs for the DJI, we would want to see new highs for other indices as soon as possible preferably in the next week. Failure to see new highs could be signaling trouble ahead in the markets.
We also can’t help but note a number of indicators such as the MACD indicator (shown above) are diverging with the DJI as well. As the DJI makes new all-time highs, the MACD indicator (along with many other indicators) is making lower highs. Volume is tailing off as well, another indication that the rally lacks “beef.”
The DJI’s first significant break comes under 21,750 (for the S&P 500 it is a break under 2,450). Confirmation of a high would come with a break under 21,500 (for the S&P 500 under 2,410). Until that happens the march to even further highs would remain in place. Nonetheless, many indicators are suggesting some caution is warranted here. Would it be the final high, though?
According to the wave count, this may only complete wave 3 up from the significant February 2017 low. That would suggest that following a corrective wave that could retrace anywhere from a minimum Fibonacci 23.6% of the move from the Brexit panic low and in an extreme up to around a Fibonacci 61.8% retracement, the markets could regroup and move once again to new highs. That would suggest a decline currently to around 20,900 or at worst a decline to around 19,000. If the markets do regroup following a pullback now it could result in a double-top scenario or a slight new high as was seen in 2007. After that October 2007 we all know what happened next.
Nonetheless, the warning signs are becoming clearer. And, despite the backdrop of the rosy jobs numbers the convening of the grand jury could be the ongoing event that halts the markets in their tracks.
(Source)
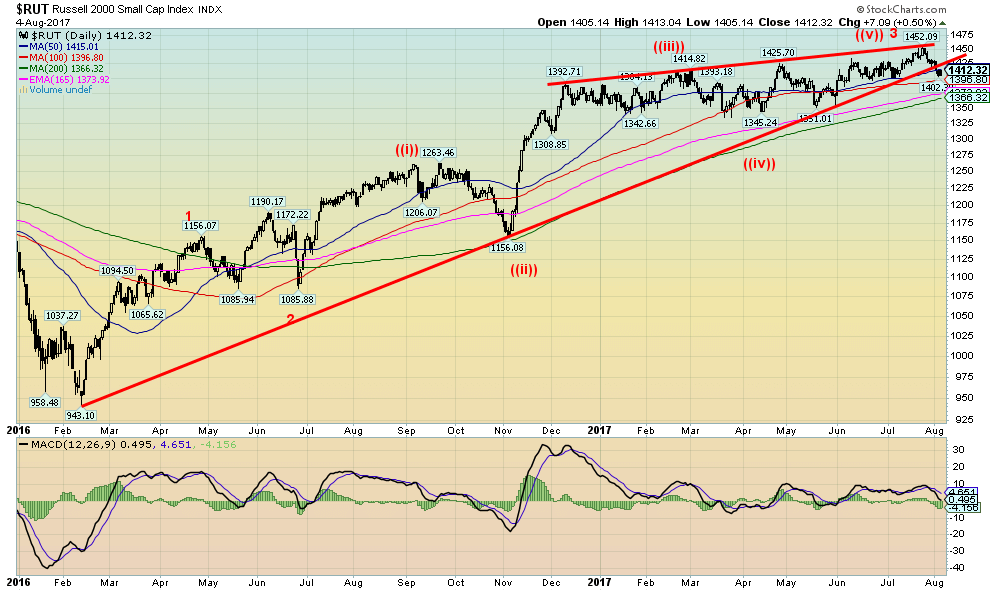
The Russell 2000 appears to be already breaking down under its trendline up from the February 2016 low. If correct this is significant and it is signaling that a top may already be in. There were considerable negative divergences in the indicators (MACD shown and it has already turned down) at the top. The Russell 2000 formed what appears an ascending wedge triangle as it marched to its top at 1,452. A breakdown under 1,365 would suggest that a more significant correction was getting underway. The DJI is the index of the top 30 stocks whereas the Russell 2000 is an index containing numerous small cap stocks. The Russell 2000 tends to outperform in both up and down markets and as well, it often leads. The Russell 2000 turning down now could be a sign of what is to come for the rest of the market.
(Source)
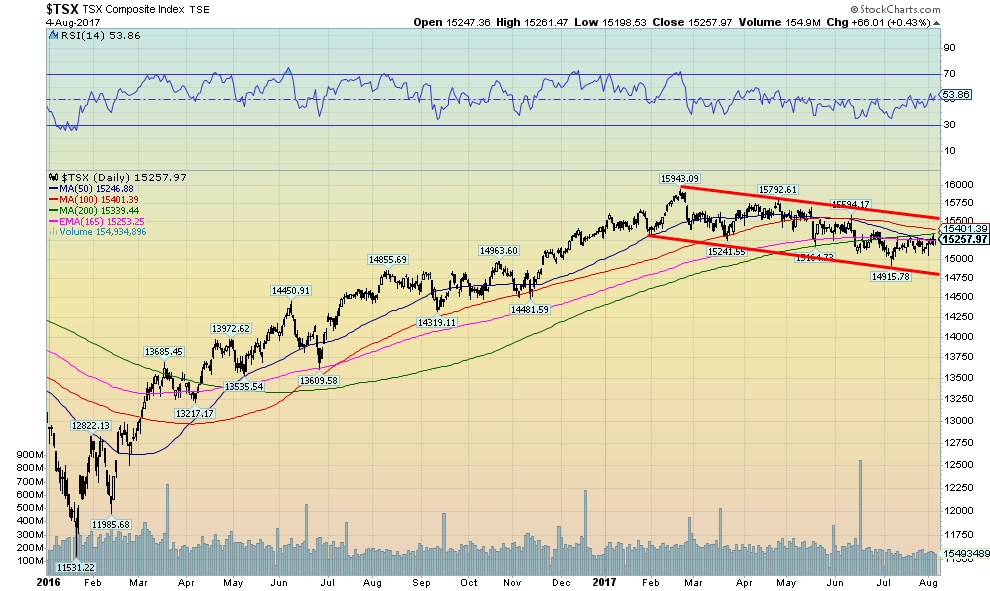
The S&P TSX Composite made its high back in February 2017. Since then the index has been in a steady downward trend. The S&P TSX Composite remains negative on the year off a small 0.2%. Nonetheless, a downtrend is underway. A breakdown under 14,750 could suggest that a new downward phase is underway that would take the index sharply lower.
The TSX Composite is, as we know, dominated by energy and materials stocks and, of course, financial stocks. Both energy and materials have been weak in 2017 dragging the index down. Health care is a sector locked in a downtrend. While most TSX sub-indices remain in uptrends, both real estate and income trusts along with utilities are showing signs of topping out. If they and financials were to turn down, it would pull the TSX composite down with them.
(Source)
The jobs numbers were stellar, but were they as stellar as reported? As noted, the unemployment rate (U3) fell to 4.3% from 4.4%. However, it was reported in June the unemployment rate (U3) was actually 4.36% and fell to 4.35% in July. So, while the broader market looked at it as falling from 4.4% to 4.3%, in fact, it barely budged. The US unemployment rate was reported as 8.6% unchanged from June (actual was 8.57% vs. 8.59% in June) while the Shadow Stats unemployment rate was 22.1%, unchanged from June. Still, all the focus is on the U3 unemployment rate and it was perceived as falling in July. The market rejoiced.
(Source)
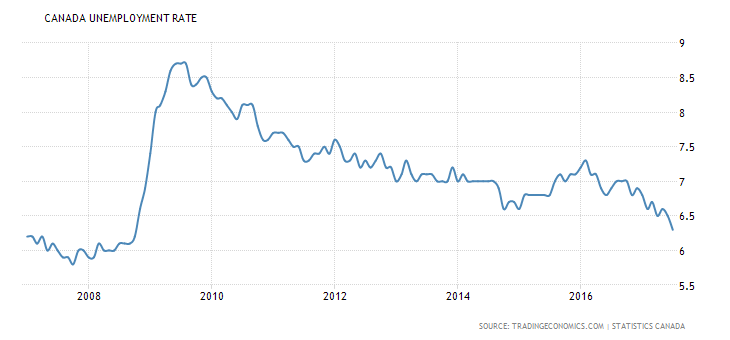
Canada had some cause for rejoicing as well when its job numbers for July were released. In July the Canadian economy created 10,900 jobs. While that was down from the 45,300 jobs created in June it was within economists’ expectations. The unemployment rate fell to its lowest since 2008 at 6.3% vs. 6.5% in June. However, we confess, it helped that the labor force participation rate for July fell to 65.7 vs. 65.9 in June. A declining labor force participation rate helps to lower the reported unemployment rate as fewer people are actually looking for work. Still, Canada`s job numbers have been pretty good of late and the Canadian economy appears to be doing well vs. its OECD peers. This has helped improve the Cdn$ vs. the US$. Of the jobs created in July 35,100 were ostensibly full-time jobs while part-time employment fell by 24,300 jobs. Overall, the Cdn economy has created some 290,000 jobs in 2017, the best in a decade.
(Source)
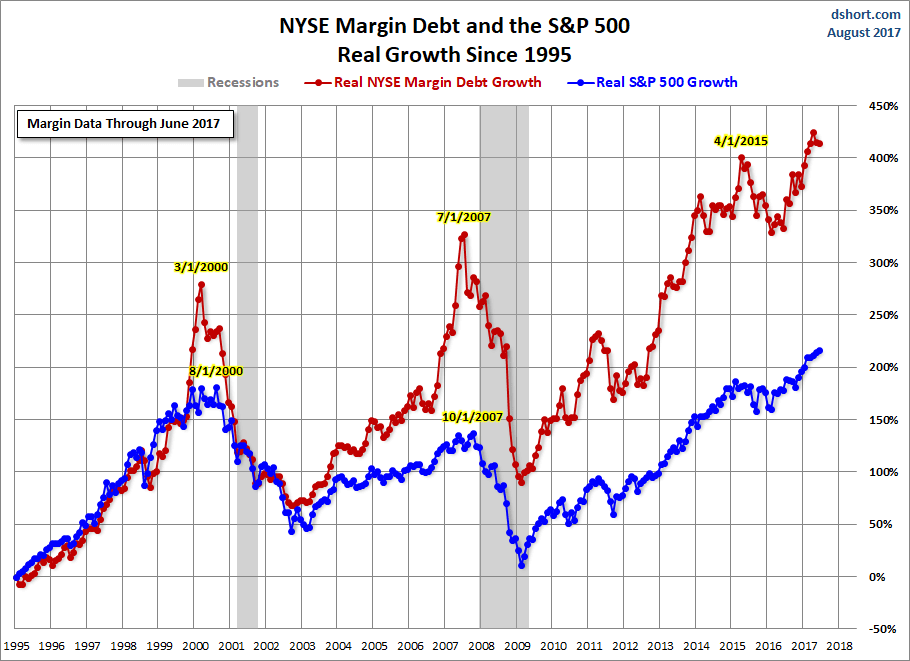
It seems inevitable as the stock market rises investors are leveraging up. Oh yes, margin debt did come off a little bit in the recent month but it remains at record levels. It is no surprise that as the tech bubble pushed markets higher and the sub-prime mortgage bubble pushed stock prices higher that margin debt grew. Indeed, margin debt has a propensity to grow faster than the market. Then when trouble hits margin debt crashes along with the market. La plus ça change, plus c’est la même chose.
Whether it’s debt to finance stock purchases or debt to finance your daily living expenses, debt bubbles always end in tears.
(Source)
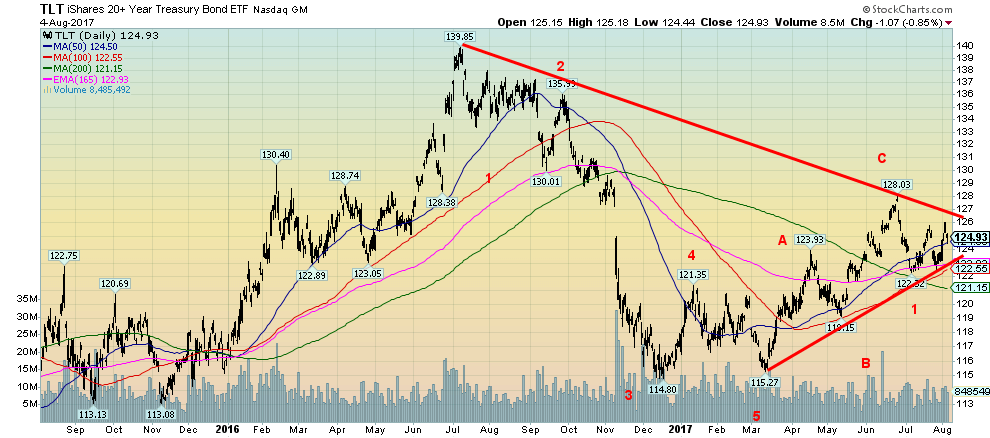
US Treasury bonds as represented here by the iShares 20+ year Treasury Bond ETF (TLT) remain below their recent highs. It may be that the bonds are tracing out a corrective to the first decline after making its C wave top on June 26, 2017. A firm breakout over 127 could change that scenario, but the expectation here is that the TLT should fall below 122 and especially under 121 and start its wave 3 to the downside. Ultimately the TLT could make new lows below the December 2016 low of 114.80. But, as noted, a break above 127 would negate this scenario and suggest that the C wave was still unfolding.
(Source)
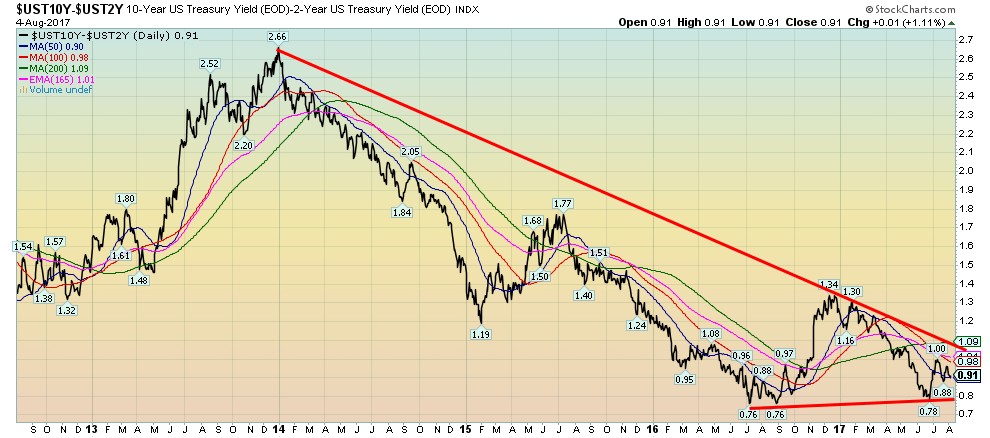
Spread watch. The spread between the ten-year US Treasury note and the two-year US Treasury note narrowed this past week from 0.96% to 0.91% this past week. The spread remains above key support at 0.80%. The expectation is that over time this spread should narrow. We have noted before the 2000–2002 recession and the 2007–2009 recession the 2-10 year spread went negative. While it is not essential to go negative a narrowing of spreads suggests an economy that could weaken going forward. We noted that subprime automobile loans delinquent rate has now soared to levels seen before the top in 2007. This is not to say trouble is around the corner but suggests there could be trouble. A firm breakdown under 0.80% could suggest a decline to around 0.20%. We will continue to keep a close eye on the 2-10 spread.
(Source)
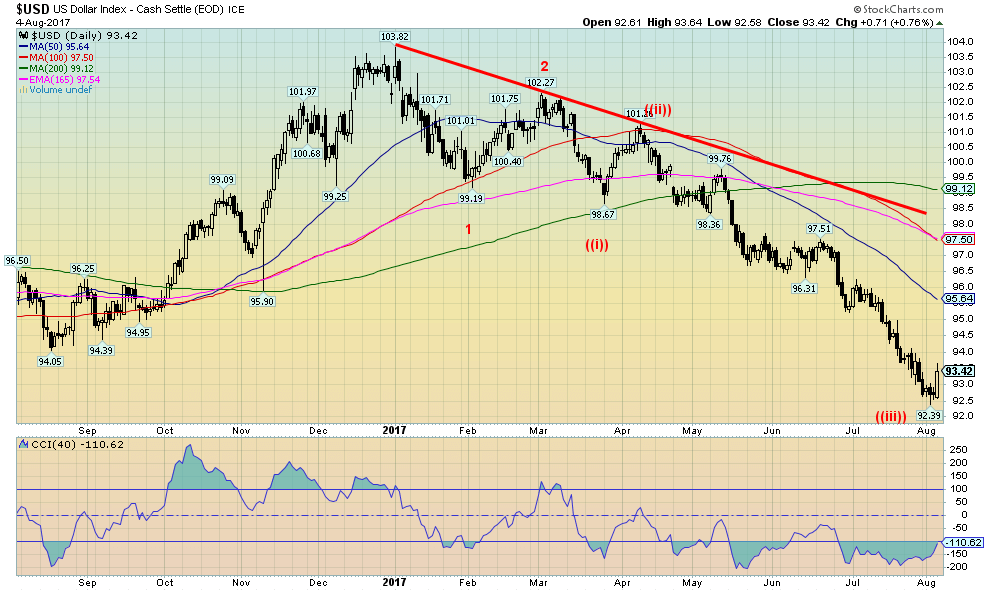
The US$ Index reversed to the upside this past week thanks to the larger than expected job numbers. This could be the start of a significant correction but more likely this will turn out to be a temporary rise thanks to the job numbers. But one of the prime reasons the US$ was falling was the perception of trouble in the White House administration. With the convening of the grand jury, the trouble in the White House could continue to be in play and the US$ should then resume its downtrend. Sentiment has been terrible so a bounce of some sort was certainly overdue. A good rebound would see the US$ Index test the falling 50-day MA currently at 95.64. We continue to have a target of 91–91.50 for the US$ index. With the low this week at 92.39, maybe that is it. But we doubt it. We note all this low seems to signify the US$ Index may have completed wave ((iii)) to the downside.
(Source)
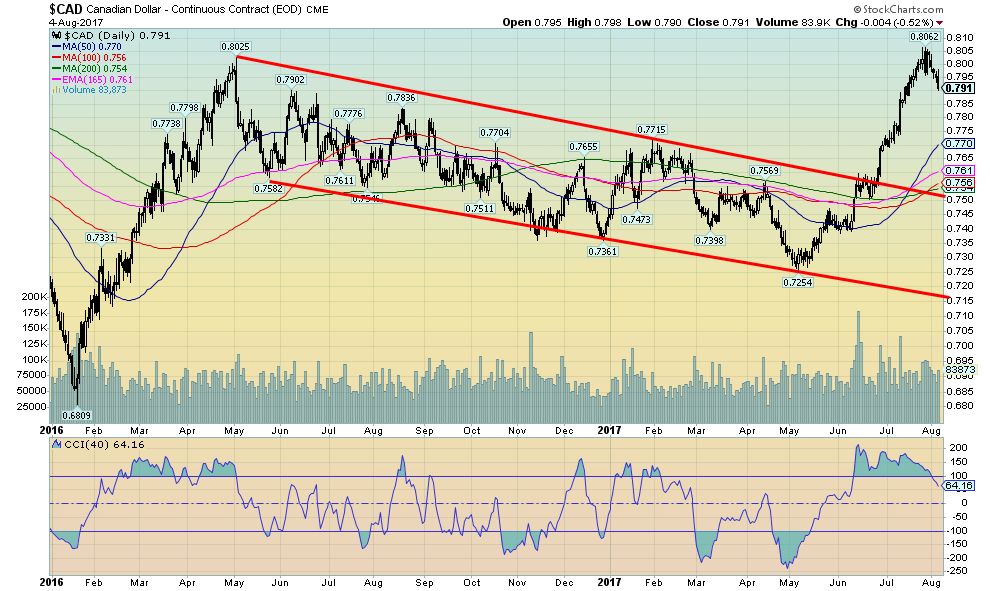
After making a nice run-up from the low of 72.54 back in May 2017 the Cdn$ appears to have at least temporarily topped out at 80.62. At least, we believe this is temporary as we continue to have potential objectives up to 83.30. Nonetheless, the Cdn$ has at least fulfilled some minimum objectives. We believe there is more to come, but that might not stop a Cdn$ decline back to test the rising 50-day MA currently at 77 or the now beginning to rise 100 and 200 day MAs as well as the 165 day EMA. Result: there should be significant support for the Cdn$ down to 75 to 75.50. Only a breakdown under 75 might suggest the Cdn$ is instead resuming the downtrend.
(Source)
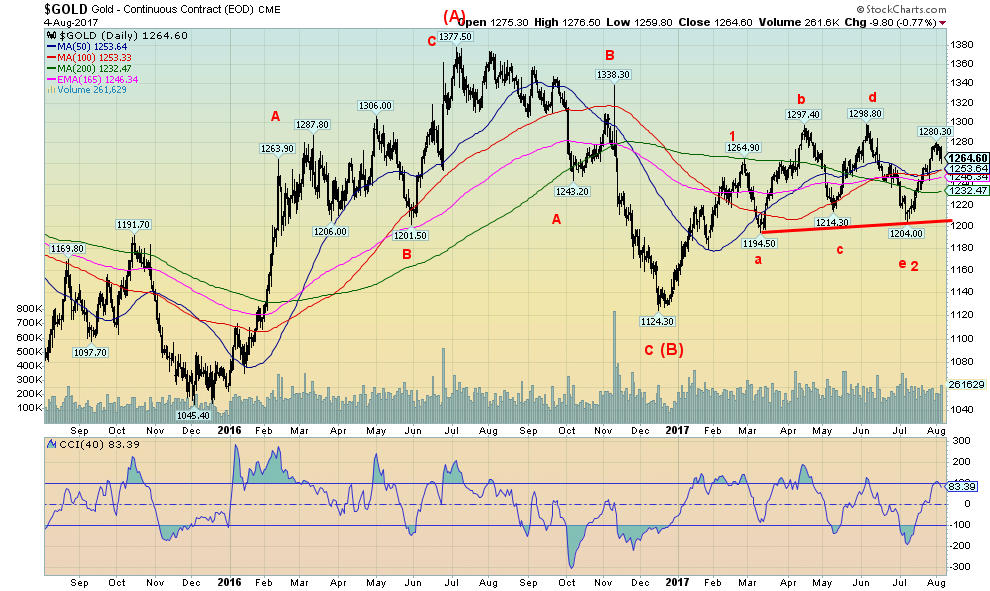
Little has changed in the technical picture for gold. The move from $1,204 unfolded in five waves to the upside suggesting that this was an impulse move. Gold has broken out above the key MAs of 50, 100, and 200. We suspect this is a corrective to the up move and it appears to be forming what we would call a bull flag or pennant. A complex correction we believe ended with the e wave at $1,204. At that point, the commercial COT was clearly covering their shorts and the bullish consensus was quite low. Meanwhile, the large speculators (hedge funds, managed futures, etc.) were cutting their long positions and increasing their short positions—typical behavior to help form a low. The clear break above $1,260 signaled to us odds now favored a return to $1,300 and probable new highs. Support looks solid down to $1,240 and $1,250. Our expectation here is that gold will soon break above $1,300 and head for $1,400 and even $1,500 this year. The backdrop is the growing political scandal in Washington that promises to get uglier. As well, the debt ceiling debate is fast approaching and our expectation there is like all other legislation in the Trump administration it will hit the shoals. They have to raise the debt ceiling but there are many Republicans vehemently opposed to it. The risk is the fight shuts down the government (it has happened before) and the US technically defaults. That is an event that would shake markets globally. But the risk is real. Gold would be a major beneficiary.
As well the seasonals are now turning positive so we believe that once this corrective is over gold should break out to new highs. A move back over $1,270 would be positive.
(Source)
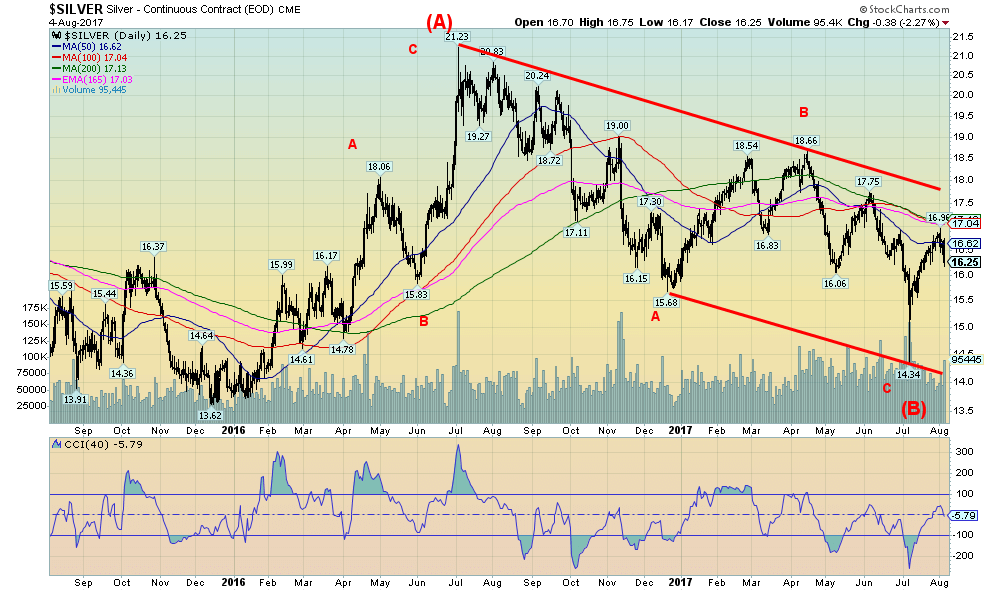
Silver has been very frustrating. It should be leading gold higher. But it is lagging. So is it suggesting that the rally in gold is not real? We doubt it. Silver made new lows in July taking out its low seen in December 2016 and falling short of the December 2015 low. That diverged with gold which did not see new lows below its December 2016 low. Silver has run into resistance at its falling 50, 100 and 200 day MAs. Oddly enough, when gold made a new high on August 1, 2017 silver did not—another non-confirmation. Silver does have considerable support down to $16 and we believe that zone should hold any pullback. The support zone can range down to $15.90. The sudden strength in the US$ on Friday following the nonfarm payrolls also did not help silver or gold for that matter. Resistance is at $17 then at $18. Once it’s above $18 silver could rally strong, challenging the 2016 high of $21.23. The forming bottom pattern suggests a move to at least $24 once silver breaks above $18.
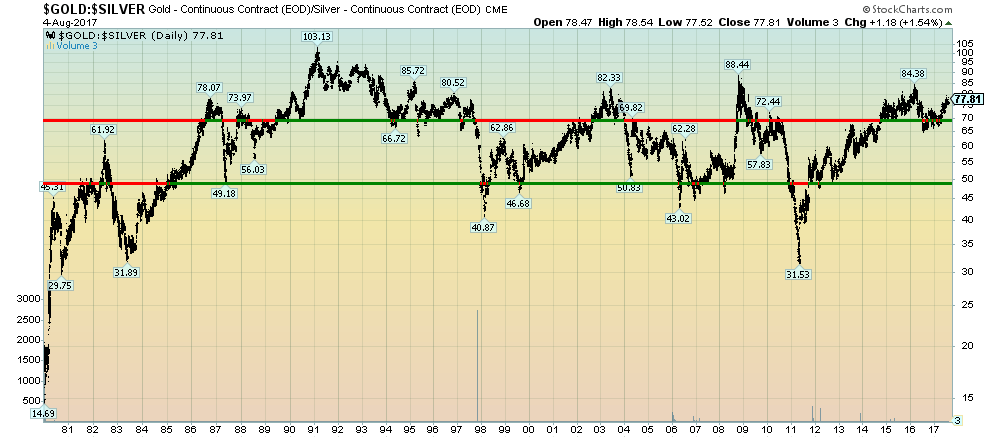
The natural ratio of gold to silver is around 16:1. However, the natural ratio is almost irrelevant in the investment world. The gold:silver ratio did fall to 14.69 at the 1980 peak when gold hit $875 and silver hit $50. But since then the range has been roughly 32 to 85 with a peak of 103 in 1990. According to our long term chart above, silver is cheap when the ratio is over 70 and silver is expensive when the ratio is under 50. The last bottom was in 2011 when gold hit $1,920 and silver peaked just below $50. It was short lived and by the time of the lows of December 2015 the gold:silver ratio peaked at 84.38. Today, it sits at 77.81 suggesting once again that silver is cheap vs. gold and one should favor silver over gold. The ratio needs to break under 65 to suggest that a bull market is under way in favor of silver. The past few years have been rough on silver bulls but everything runs in cycles. The gold:silver ratio appears to have a cycle range of roughly 5–7 years. We observe a low in 1983 followed by one in 1988 (5), 1994 (6), 1999 (5), 2004 (5), 2009 (5), and the last low was in 2016 (7) even if it wasn’t a very prominent low. The reality is a strong move in silver vs. gold is overdue. A break back under a ratio of 73 would be a start.
(Source)
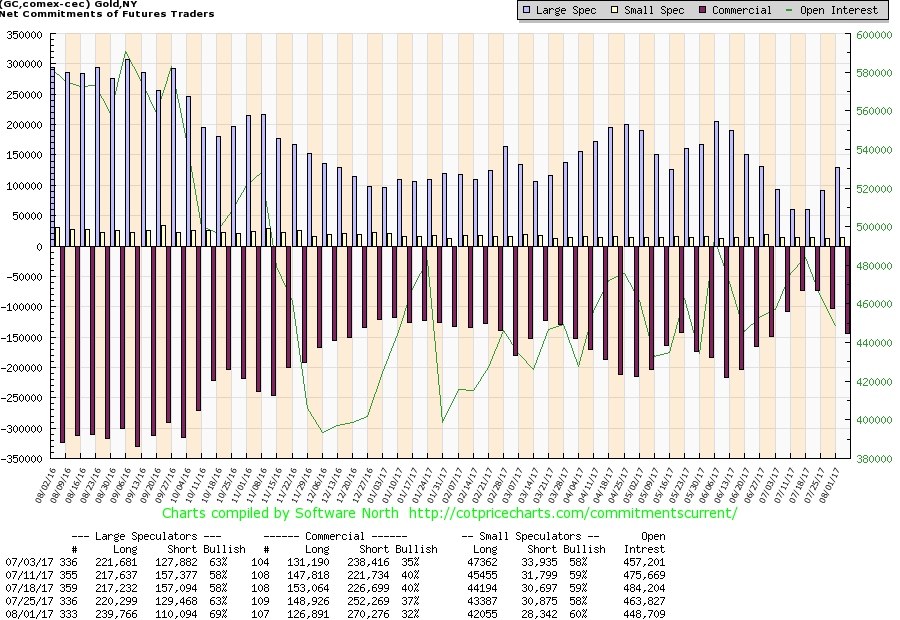
Are the commercials getting ready to pull the plug on gold once again? The commercial COT dropped this past week to 32% from 37% the previous week while the large speculators COT jumped to 69% from 63%. Commercials increased their open short position by roughly 18,000 contracts while contracting their open long position by about 22,000 contracts. The large speculators positions were roughly the same but in the opposite direction. We would become more concerned if the commercial COT were to fall into the mid-20s. The commercial COT can ebb and flow and the commercials have a tendency to increase their short position as the market rises but it doesn’t necessarily signal a top immediately. We are watchful. Curiously, the silver commercial COT change wasn’t as strong as gold’s. The commercial COT for silver slipped to 38% from 41%. It remains reasonably bullish.
(Source)
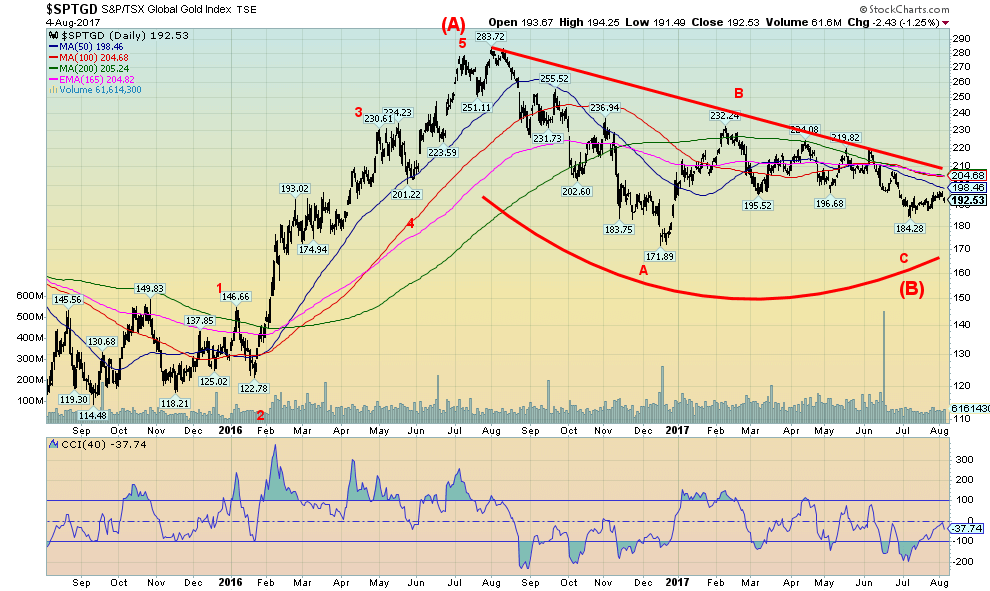
Gold stocks, thy name is frustration. Gold is up 9.8% thus far in 2017, but the gold stocks are lagging badly. The Gold Bugs Index (HUI) is up 5.3% but the TSX Gold Index (TGD) is actually down 0.9%. Gold stocks may have started off the year on a solid footing but since peaking in early June 2017 the trend has been down. After hitting a low of 184.28 on July 10, 2017 the TGD may have begun what we could call a stealth rally. A stealth rally occurs when the stock, index or whatever, is slowly rising not attracting a lot of attention but the rise is steady. The TGD was steadied this past week following the release of the US job numbers, but overall it is up 4.5% since July 10. Steady, but not spectacular. The result is sentiment towards the gold stocks is as low today as it was a month ago although not quite as low as it was at the December 2016 low.
Considerable work needs to be done. Resistance is seen from about 198 up to 210. A breakout over 210 could spark a sharp rally. While it is frustrating the TGD appears to be forming a nice bottom pattern. Seasonals are turning positive and that could spur buying in the gold stocks. Asian demand tends to pick up during this period. And gold jewelry demand also surges into Christmas.
A stealth rally appears to be under way. The bottom pattern that has formed over the past couple of years is compelling. Investors should note.
(Source)
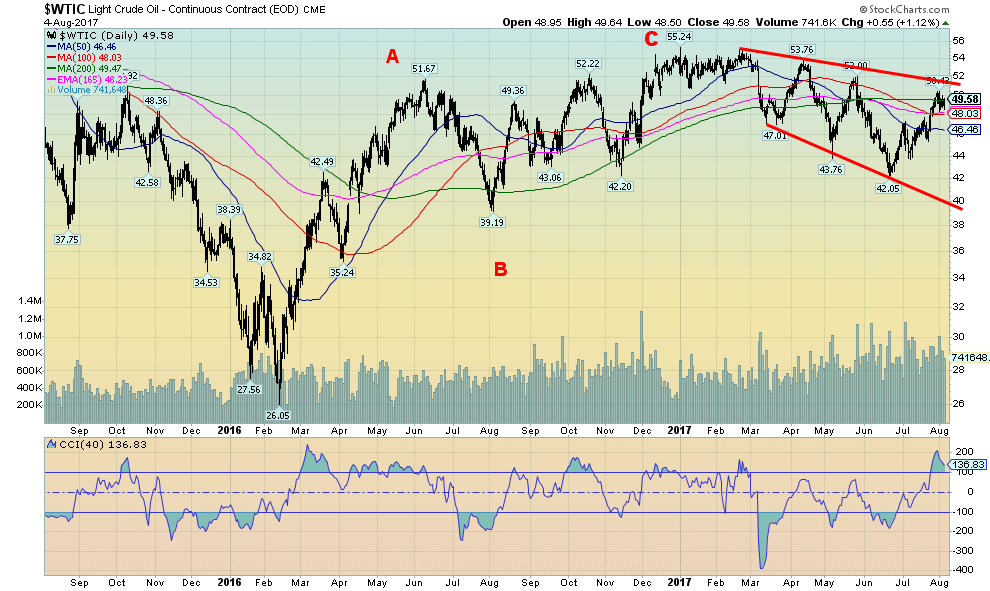
WTI oil prices appear to be failing just under our break-out point near $51.50. The high so far was $50.42. The 200-day MA also appears to be acting as stiff resistance (currently at $49.47). A move back under $48 would most likely confirm to us a failure and WTI oil prices should fall once again. Confirmation would come with a breakdown under $46. The decline since early 2017 has been quite irregular. But a reminder that oil’s positive seasonals are generally between December and June. Note that high in June 2016 and even on in late May 2017. Oil prices struggled between June and November/December 2016. The expectation here is that oil prices should continue this erratic up and down pattern into year-end. The only thing that would change that scenario now is a firm breakout over $51.50. We doubt that is in the cards.
—
DISCLAIMER: This article expresses my own ideas and opinions. Any information I have shared are from sources that I believe to be reliable and accurate. I did not receive any financial compensation in writing this post, nor do I own any shares in any company I’ve mentioned. I encourage any reader to do their own diligent research first before making any investment decisions.


SBTi Net-Zero Standard 2.0 Enhances Corporate Climate Action
The Science Based Targets initiative (SBTi) has released Corporate Net-Zero Standard Version 2.0, a major update to its global framework...


Europe’s Cannabis Shift: Rising Use, and New Risks
EUDA report shows cannabis remains Europe’s most used illegal drug, with 22 million adults trying it. Use is highest among...


Remote Work Reshapes Sales Management: Key Lessons for Moroccan Leaders
Remote work is rapidly expanding among Moroccan managers, yet practices lag behind. Insights from France show higher productivity but weakening...


Corn Prices Slip Amid Strong Crop Conditions and Favorable Weather
Corn was lower again last week on Midwest rains despite a neutral WASDE report. The report showed slightly higher beginning...


Advances in Biomarkers and Targeted Therapies Transform Kidney Care in Autoimmune Disease
New biomarkers and targeted therapies are reshaping the management of kidney damage in autoimmune diseases like lupus and vasculitis. Experts...
 |
|
 |  |
 |
|
-

 Crowdfunding2 weeks ago
Impact Food Launches Crowdfunding to Expand Plant-Based Fast Food Concept
-
 Cannabis15 hours ago
Europe’s Cannabis Shift: Rising Use, and New Risks
-

 Markets1 week ago
Sugar Markets Rise Slightly Amid War, Oil Price Pressure, and Strong Global Supply
-

 Africa2 weeks ago
Morocco’s Record Grain Harvest Spurs Temporary Import Barriers to Protect Farmers
You must be logged in to post a comment Login