Business
Market Advances End in Exhaustion
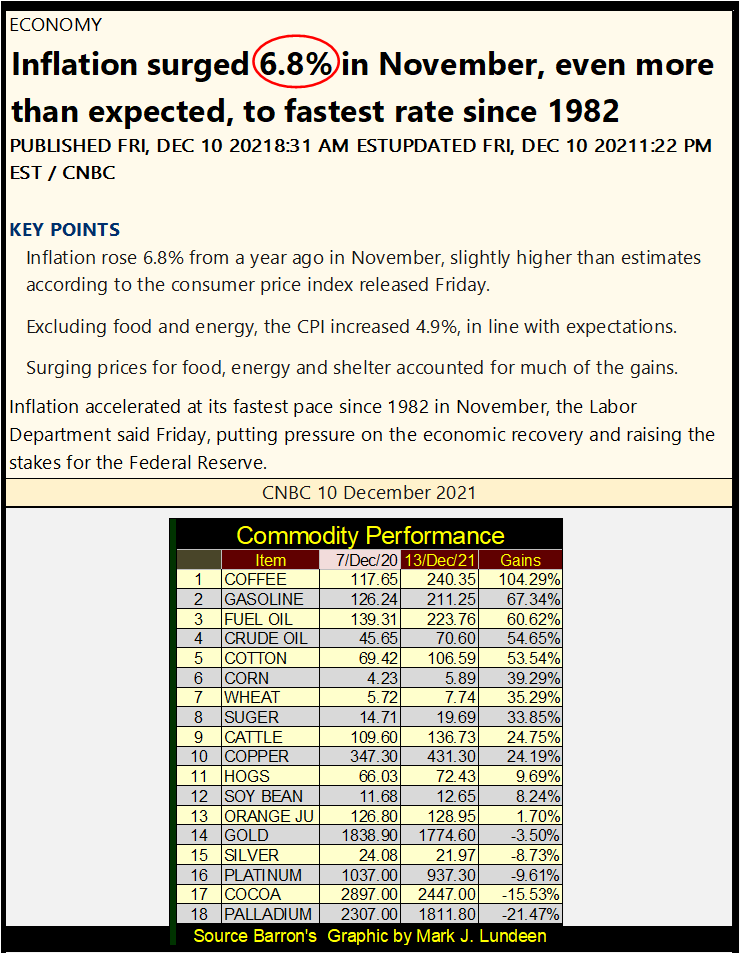
This week the financial media had some big news on inflation. CPI was up 6.8% from November 2020 to 2021. But such numbers concerning inflation are government manufactured and become preposterous when closer scrutiny is applied. The CNBC report on this story from the US Department of Labor, shows a shocking rate of inflation of 6.8%.
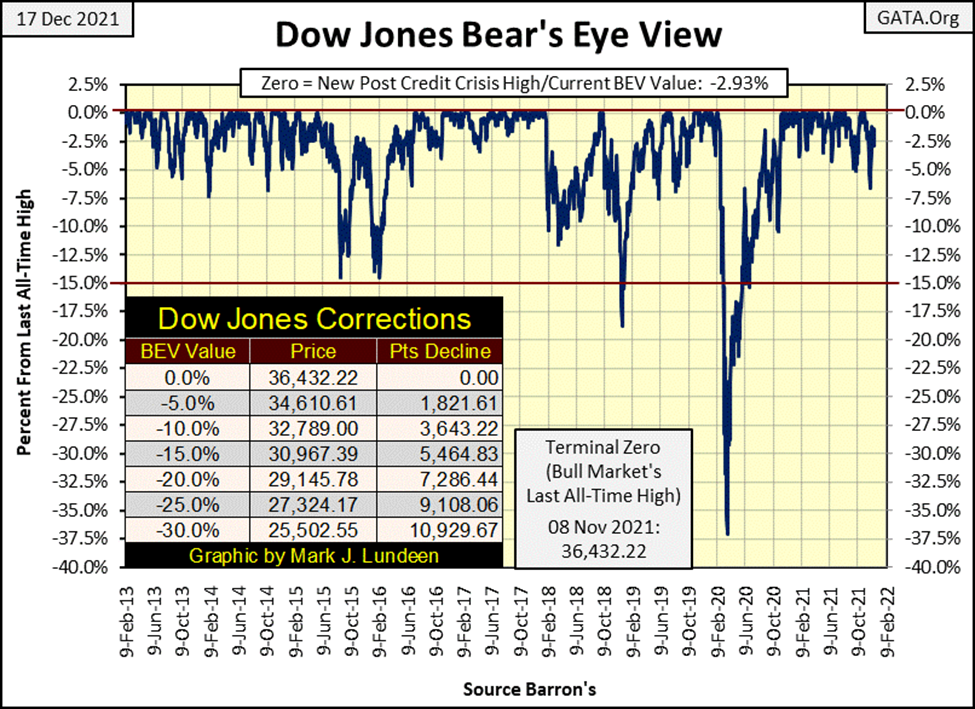
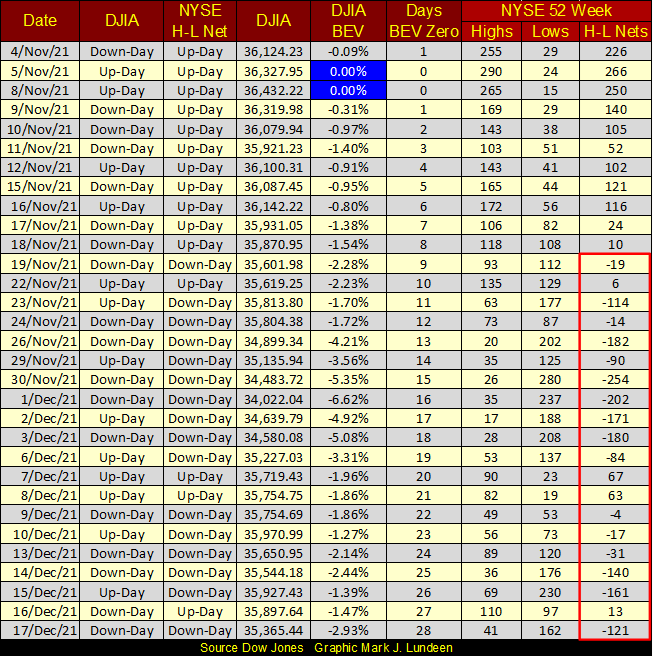
Looking at the Dow Jones’ BEV chart below, specifically the cluster of BEV Zeros for the post-March 2020 flash-crash advance; slowly but surely things are changing. It’s been over a month since our last BEV Zero (November 8th). That plus the bulls have been careless about defending the Dow Jones’ BEV -5% line. This is the line that separates daily closes, those in or out of scoring position. BEV values just short of a new all-time high, down to -4.99% from an all-time high are in scoring position, a position from where it’s easy for an index to advance up to a new all-time high.
None of this indicates the post-March 2020 flash-crash advance is over. But this advance has been going on for the past twenty-one months and advances like this end in exhaustion. The bulls, though still running wild and free, are increasingly looking exhausted.
Looking at my table for the major-market indexes’ Bear’s Eye View values (below), last week saw only one new all-time high for the entire week: the Dow Jones Utilities Average (#1). Last week the sole new all-time high was the S&P 500. This week the S&P 500 came close to making another BEV Zero on Wednesday (BEV -0.05%), but closed the week with a BEV of -1.94%.
The bulls couldn’t come up with another 0.05% to close on Wednesday at a new all-time high? What’s the problem here? Exhaustion?
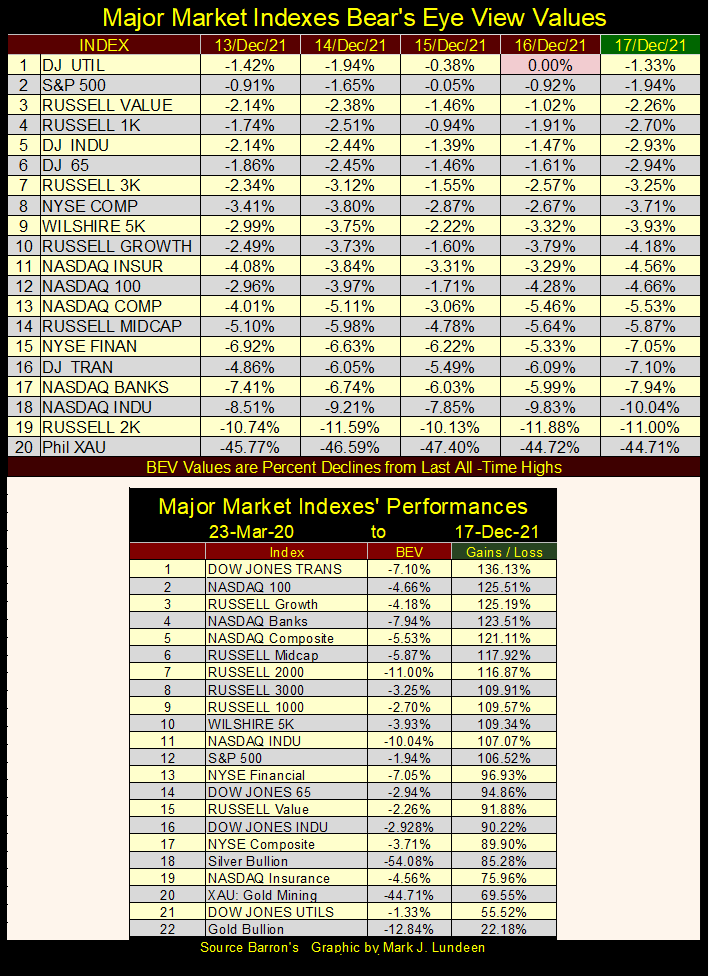
I can’t blame the bulls for being tired. Look at the advances from their 23 March 2020 bottoms in the table above, most of them are in the triple digits. Can they keep this up, and how much more do investors expect from these tried, old cows?
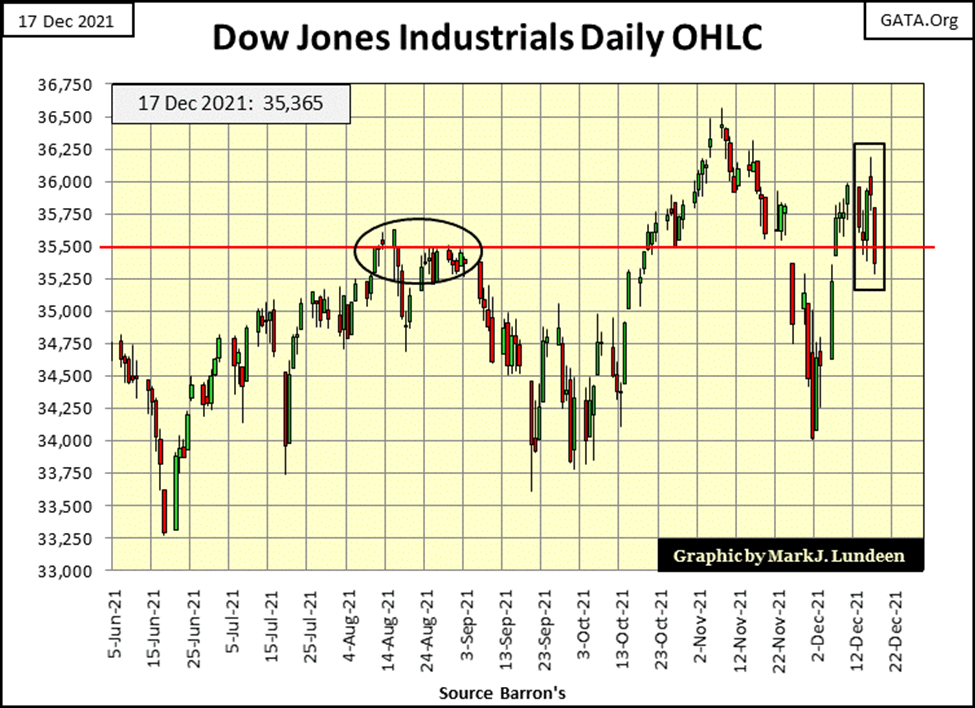
One problem that old age brings is confusion, and apparently, confusion ruled the Dow Jones this past week (black rectangle/chart below). Monday and Tuesday the Dow Jones is down big, then on Wednesday, it’s up big. Thursday and Friday the cows began running downhill again, closing the week below the Dow Jones support line at 35,500.
Looking at last week’s trading inside the box below leaves me confused too. I don’t care to speculate whether the Dow Jones will be up or down by the close of next week’s trading.
Looking at the 52Wk Highs and Lows for the NYSE in the table below provides no comfort for the bulls. In the H-L Nets column, since November 19th 52Wk Lows have dominated 52Wk Highs. I had to go back to the March 2020 flash crash to find a similar month, with this many negative daily H-L Nets. Though in March 2020, daily negative nets of over 2000 were common. So far, our most negative daily 52Wk H-L net was 254 on November 30th.
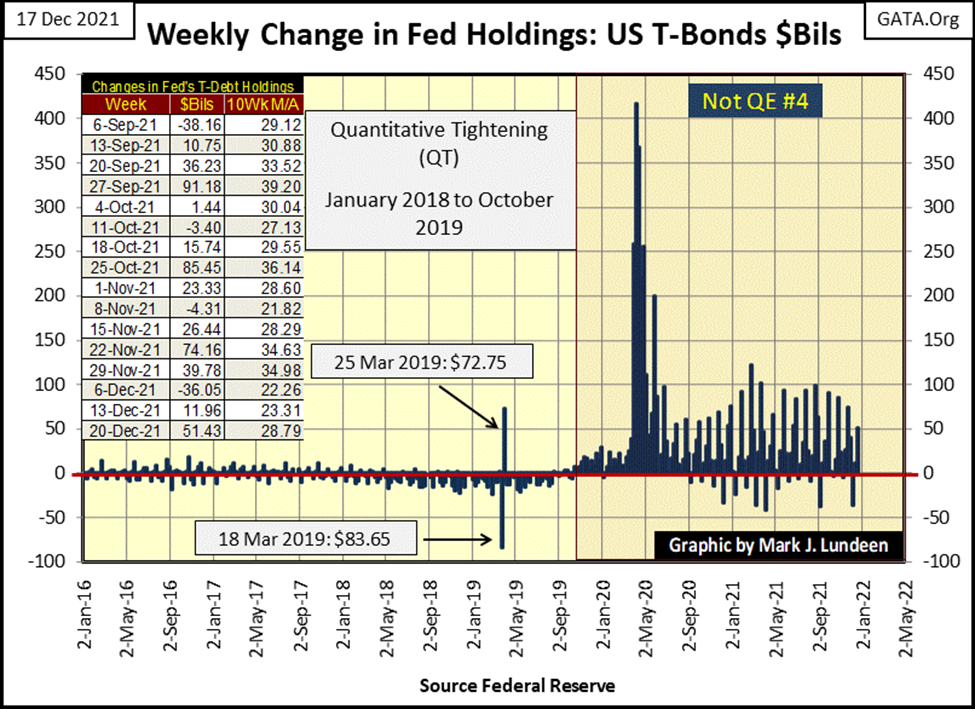
So, what now follows this week’s trading? Looking at the weak technical indicators shown above, I’m feeling a bit bearish. But keep in mind, where for the past twenty-one months all these BEV Zeros and triple-digit percentage advances have come from; the FOMC. With their ability to inflate the financial system with as many trillions of dollars as they care to, it’s hard to get very bearish on this market. This week, they “injected” an additional $51 billion into the financial system (see chart below). If they felt they had to, they could “inject” over $400 billion into the market in a single week, as they did in March 2020 below.
Will the FOMC continue “injecting” inflation into the financial system from now on, until California falls into the Pacific Ocean? No, though they could. The problem the idiot savants at the FOMC are having is since the Market’s March 2020 lows, “liquidity injected” into the financial system is now also flowing into commodity prices. That isn’t bullish for the stock or the bond market. In fact, rising CPI inflation is like unleashing a terminator on Wall Street.
This week the financial media had some big news on inflation. CPI was up 6.8% from November 2020 to 2021. But such numbers concerning inflation are government manufactured and become preposterous when closer scrutiny is applied.
Here’s the CNBC report on this story from the US Department of Labor, a shocking rate of inflation of 6.8%. But when this 6.8% rate of inflation is compared to the commodity price increases seen below, this government report of inflation begins looking rather bogus.
https://www.cnbc.com/2021/12/10/consumer-price-index-november-2021.html
The Department of Labor’s reply to any question concerning their numbers would be that people like me don’t understand how to properly calculate something as complicated as the rate of inflation in a very complicated mechanism, such as the American economy.
To which I would reply; I don’t care how the Labor Department calculates their statistics on inflation, as the end product of their labor obviously has no relevance on the reality of my life.
What I care about is, in the past year the prices I pay for energy, food, and everything else have increased much more than the Labor Department’s 6.8%. I wouldn’t be surprised if, in the past year, my actual cost of living was actually up by 15% or more. I’m sure that is true for everyone, even for the “journalists” who write copy for CNBC’s stories on inflation, and their “editors” who, for reasons best known to themselves, never question anything from a government source, no matter how absurd, such as the above 6.8% inflation rate.
The danger high rates of inflation present to “monetary policy”, as executed by the FOMC, is that at some point, a selling panic in the bond market will materialize.
Bonds, mortgages, consumer debt, any form of debt is traded. This means the price of debt is fixed by how much buyers of debt are willing to pay.
When the current high rate of inflation is finally integrated into the psyche of the debt buyers, buyers of debt will then refuse to buy debt yielding 1%, when that debt’s principle is being eroded by an annual inflation rate of 6.8%, or more. At this point, the sellers of debt will be forced to discount their debt, until its current yield increases to something that attracts buyers.
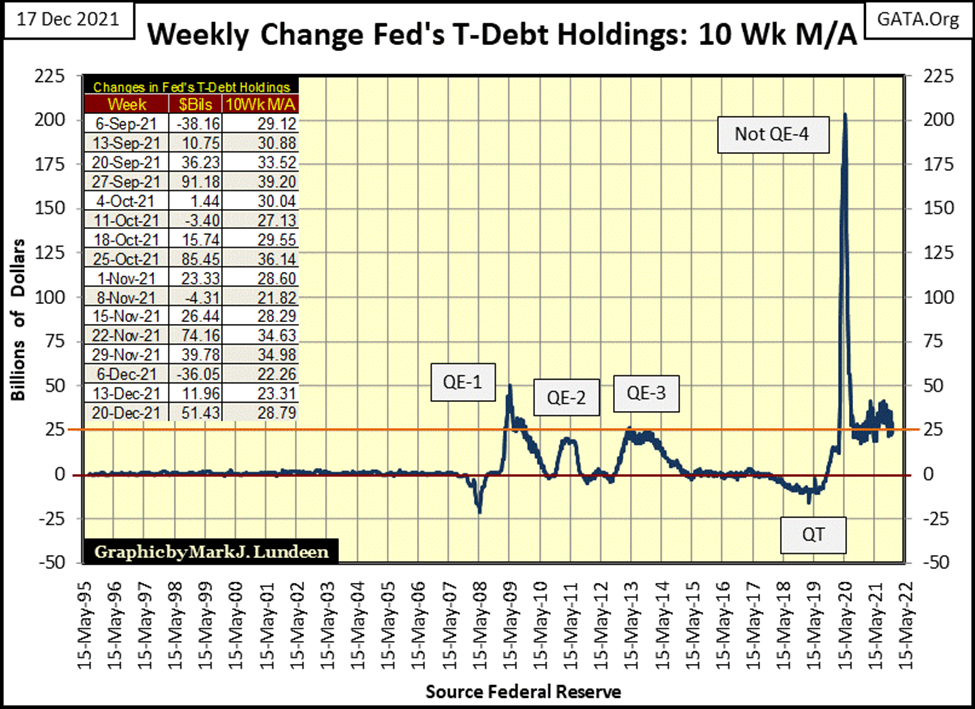
Come this new paradigm in the debt market, there is nothing the FOMC can do to reverse it. Though the idiot savants may attempt to “stabilize” the debt market’s valuations by entering the market, and do something no one else is willing to do; buy overvalued debt at full price, and in sufficient volume to “stabilize” the debt markets. They’ve done this before. See the four QEs plotted in the chart below.
Also, historically the stock market becomes a bad market to be in when the debt market is selling off. So, unless the idiot savants at the FOMC intend to “stabilize market valuations” in both the bond and stock markets, by becoming the buyer of last resort during a bear-market selling panic on Wall Street, market valuations are going to deflate.
Currently, the Federal Reserve’s balance sheet is $8.67 trillion dollars. How many multiples of $8.67 trillion dollars would it take to “stabilize market valuations” in the next market sell-off?
In the chart below we see the inflationary “injections” of three QEs needed to “stabilize” the financial system during the sub-prime mortgage crisis. The Not QE#4 was what Fed Chairman Powell had to “inject” into the financial system to “stabilize” the financial system during the March 2020 flash crash. The FOMC’s Not QE#4 continues to this day.
* What will be required come the next market downturn? *
At what point does the global market develop a revulsion of the dollars the FOMC continually “injects” into the market? One more QE to bailout Wall Street may result in the abandoning of the dollar as a global reserve currency.
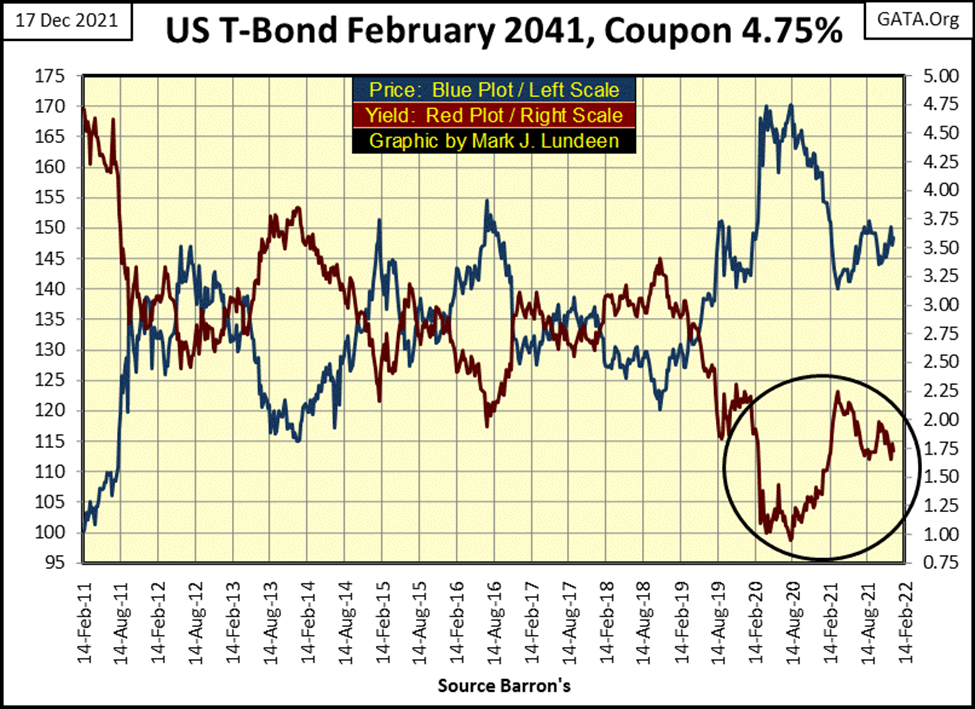
Here’s a chart for a 30Yr T-bond, issued in February 2011, and maturing in February 2041. Bond yields bottomed in August 2020, and have since been rising. I find that interesting as commodity prices, as seen above, began rising in the second half of 2020, and it appears the T-bond market has been sensitive to rising commodity prices, as seen in the circle below.
At some point, annual double-digit rates of inflation are going to be priced into the debt markets, resulting in a big-bear market in bonds that will see bond yields soar deep into double digits. Or the FOMC will yet again “stabilize market valuations”, by purchasing bonds with many trillions of dollars of monetary inflation. They may be successful fixing bond yields and interest rates near today’s level. But the dollar the Federal Reserve has been mismanaging since 1913 will become worthless.
What should investors do? Find some asset that isolates one’s personal wealth from the “monetary policy” of a bunch of idiots? Something like gold and silver as well as precious metal mining companies?
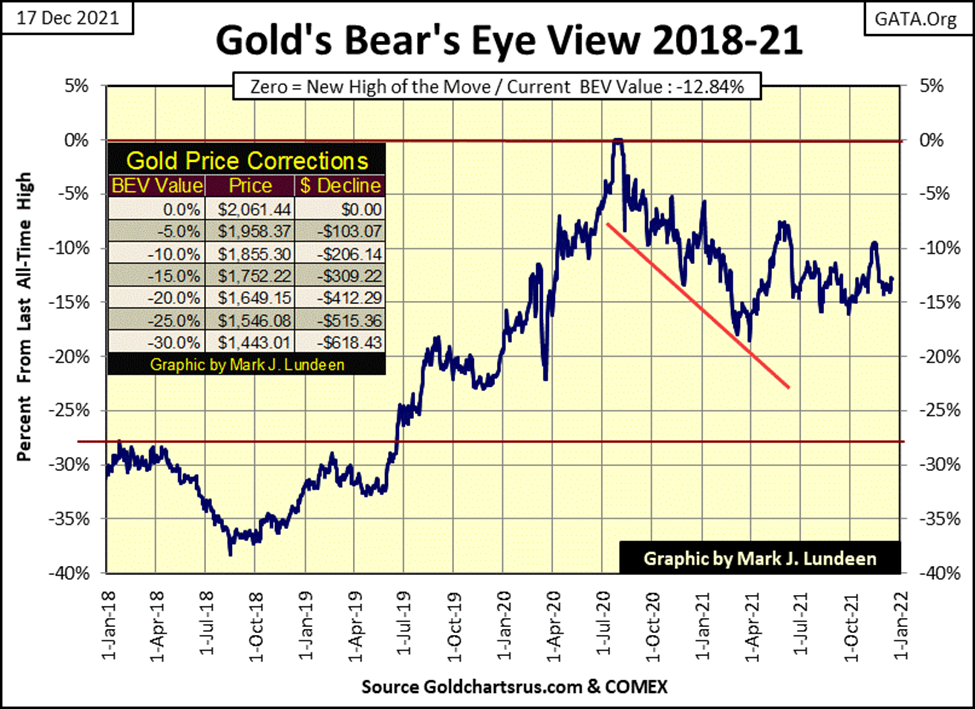
Here’s gold’s BEV chart. So far gold’s BEV -15% line ($1752) has yet to be broken by the COMEX goon squad. But this week’s BEV chart for gold looks much like last week.
But the data used in the chart above are daily closing prices. And for this week, daily closing prices missed the * BIG DEVELOPMENT * in the gold market that was captured by Kitco as it provided gold prices on a 24-hour basis.
Below is a graphic that contains two Kitco gold charts that plot the price of gold for the five days of last week. In the upper chart, gold did little on Monday (Blue Plot). But the COMEX goon squad began working hard beginning on Tuesday’s trading in New York (Orange Plot); gold dropped by $20. The same thing happened on Wednesday with gold dropping $15 shortly after trading stopped in New York. So, in two days gold was taken down by $30, down to $1755;
* Just $3 short of gold’s BEV -15% line of support. *
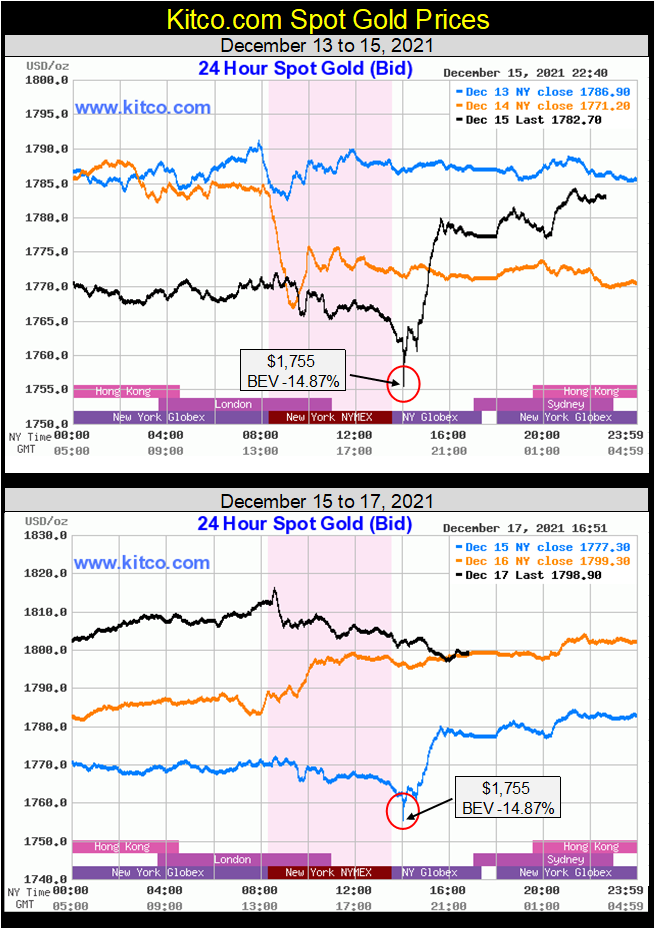
What followed this near violation of the gold’s -15% BEV line on Wednesday was amazing. Gold ended the day (Wednesday / Blue plot above) up $25 by midnight. On Thursday (Orange plot) gold was up another $20 by midnight. And on Friday’s early trading in New York, gold attempted to break above $1820. That’s a three-day, $63 advance in the price of gold. It’s been a very long time since I’ve seen such a turnaround in the gold market.
What does this mean? Hopefully, that the $1755 seen during last Wednesday’s New York trading is a hard bottom to gold’s current sell-off. We’ll discover if that is true should gold now advance above its BEV -10% line ($1855). That’s only $59 from Friday’s close of $1796.
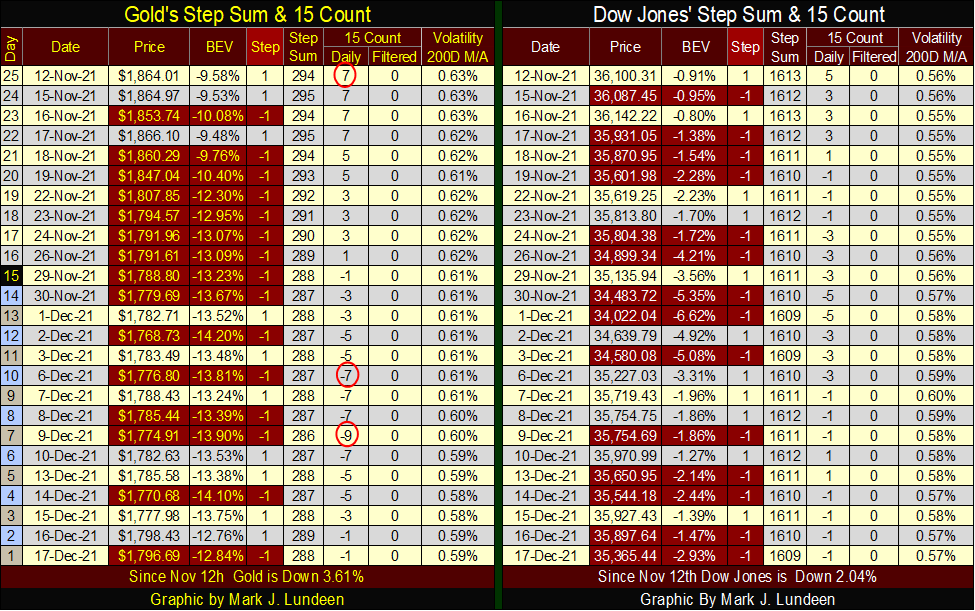
I’m not really surprised at gold’s nice bounce off $1755 on Wednesday during New York after-hours trading. As seen below, last week’s gold’s 15-count hit a very oversold -9. It was time for a bounce in the gold market.
This is my last article for 2021, and as Christmas comes next week, I thought I’d say a few words about the holiday. My first Christmas in the Navy I enjoyed in Singapore. Singapore, being only sixty nautical miles north of the equator, is in the tropics. Where a cold day in December is still something over 90F or 33C, provided a totally different holiday experience than from where I was born and raised in the Upper-Midwest. No matter, the big stores lining Orchard Road all had dioramas of Santa pulled by eight tiny reindeers high over a pretty New England landscape, covered in a blanket of styrofoam snow.
I also spent a couple of Christmases in Korea. The thing that comes to my mind when I recall Christmas in Korea; is Bing Crosby singing White Christmas. Bing may have passed away fifty years ago, but he still has lots of fans south of the DMZ, with posters of his Christmas album everywhere.
Unfortunately, what Christmas is actually about is for the most part ignored. That the creator of the universe chose to live among his people by being born in Bethlehem by a virgin, in the humblest circumstances imaginable. Jesus was born in a barn as there was no other room available for his little family. This was not by accident. He chose this humble birth to provide an example to all on humility. The custom of gift-giving on Christmas comes from the Magi visiting him; three princes from the east who offered precious gifts of gold, frankincense, and myrrh.
Here’s a little video that tells us what Christmas is all about.

Is this true? I believe it is, but I understand the doubt many people have concerning the Christian Gospels, as I once had them too. What made me change my mind? I read the Jewish Old Testament. Jesus’ humble birth, following life and crucifixion, was prophesied many centuries before.
To my mind, the improbability of Jesus’s birth confirms that he is God, as what is important to us; wealth, fame, and power over others, wasn’t important to him. But did Jesus actually live? William Durant, in his volume of Caesar & Christ, made an interesting observation. That if you believe Julius Caesar existed, then you have to believe Jesus did too, as they are mentioned by the same historians of the Roman era.
Anyway, I want to wish a Happy Chanukah to my Jewish readers, and a Very Merry Christmas to my fellow Christians, and to all that Santa brings you something good on Christmas.
—
(Featured image by Billie Grace Ward CC BY 2.0 via Flickr)
DISCLAIMER: This article was written by a third party contributor and does not reflect the opinion of Born2Invest, its management, staff or its associates. Please review our disclaimer for more information.
This article may include forward-looking statements. These forward-looking statements generally are identified by the words “believe,” “project,” “estimate,” “become,” “plan,” “will,” and similar expressions. These forward-looking statements involve known and unknown risks as well as uncertainties, including those discussed in the following cautionary statements and elsewhere in this article and on this site. Although the Company may believe that its expectations are based on reasonable assumptions, the actual results that the Company may achieve may differ materially from any forward-looking statements, which reflect the opinions of the management of the Company only as of the date hereof. Additionally, please make sure to read these important disclosures.


Tilray Acquires HelloMD to Expand Medical Cannabis Digital Platform
Tilray Brands acquired HelloMD, a digital healthcare and medical cannabis platform, pending court approval on June 29, 2026. The deal...


Spanish Crowdfunding Market Reaches Record €761.6M in 2025, Driven by Real Estate and Crowdlending Growth
Spanish crowdfunding market reaches record €761.6M in 2025, driven by strong real estate dominance and rapid crowdlending growth, while donations...


Swedish fintech Lysa is preparing to enter the European ETF market
Swedish fintech Lysa is entering the European ETF market, registering its first ETF and expanding beyond its robo-advisor model. Managing...


Bitcoin Stalls Near $60K as Strategy Moves, ETFs Outflow, and EU MiCA Rules Take Effect
Bitcoin hovers near $60,000 with ETF outflows, while Strategy boosts reserves, sells BTC, and raises dividends to reassure investors. Ethereum...


Morocco’s Growth Holds at 4.6% as Agriculture Offsets Economic Pressures
Morocco’s economy grew 4.6% in Q1 2026, driven by a strong agricultural rebound offsetting declines in industry. Services expanded moderately...
 |
|
 |  |
 |
|
-

 Africa1 week ago
Moroccan Bond Market Shows Mixed Signals as Primary Eases and Secondary Pressures Persist
-
 Crypto1 day ago
Bitcoin Stalls Near $60K as Strategy Moves, ETFs Outflow, and EU MiCA Rules Take Effect
-

 Africa1 week ago
Morocco’s Economic Growth Outlook Strengthens for 2026
-

 Impact Investing2 weeks ago
AI Adoption in Italian Retail Stalls Despite Strong Experimentation