Featured
Market Valuations for Financial Assets Deflate
As August 2022 is about to begin, the stock market has outperformed commodities for the past three decades. The stock market had a good July, and maybe it will also have a good August and September. But I’m still a bear on stocks and bonds, because I believe the bull market in commodities (raising CPI inflation) is going to be a real factor in the economy for the foreseeable future.

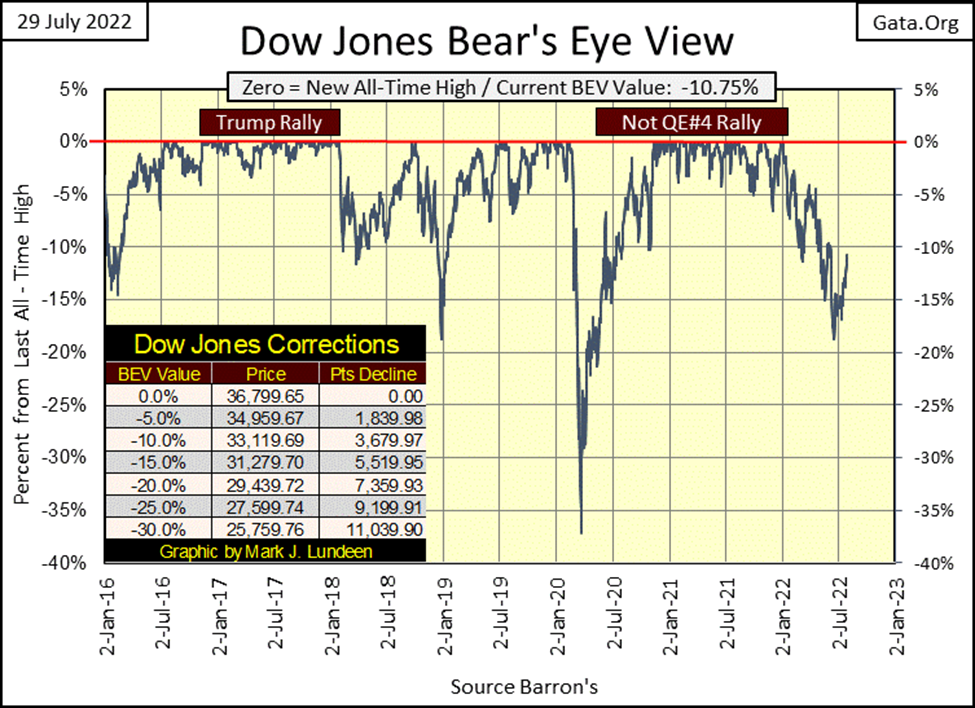
It’s good to be back. I can type again, but still having problems with my right arm and shoulder. Such is life. But who really cares about my problems when they would rather look at the Dow Jones BEV chart below?
When last I commented on this chart, I was wondering whether the Dow Jones would next cross its BEV -15% or BEV -20% line. Now I know; it crossed its BEV -15% chart, and is now thinking about doing the same with its BEV -10% line. This is good market action. Should this continue, it won’t be long before the Dow Jones is once again in “scoring position”, a BEV value of less than -5%, from where making new all-time highs (BEVs of 0.00%) is easily done.
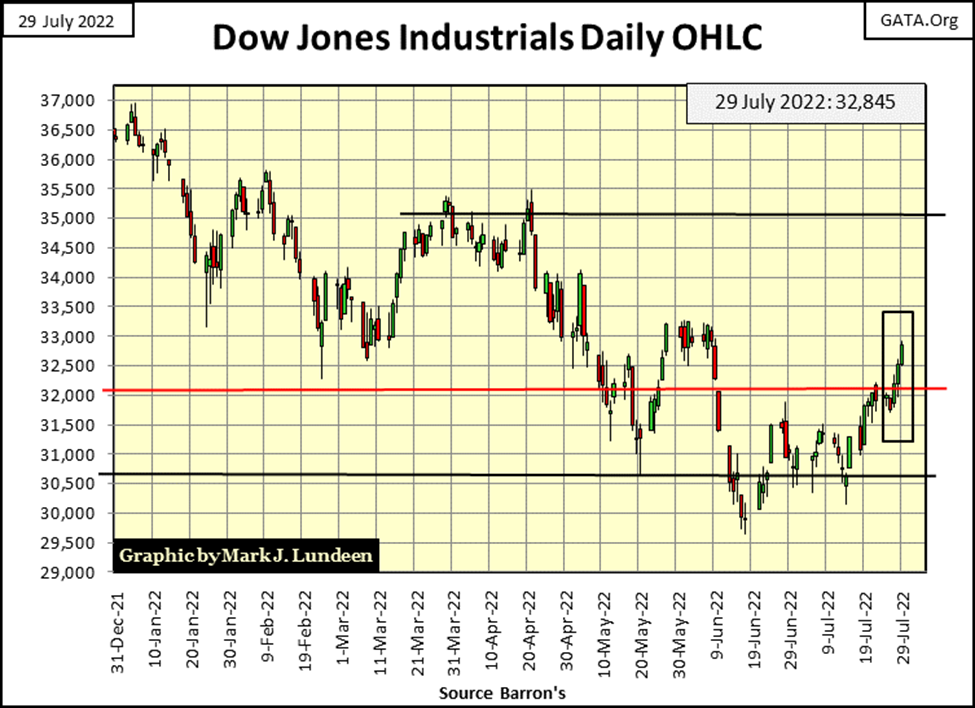
This week’s market action in the Dow Jones daily bar chart below looks really good; meaning the Dow advanced in little steps, not big daily moves. That’s what a bull market looks like, as it is during market declines where we see big daily moves (both up and down) in the market, as seen in the chart below earlier this year.
Now the question is; how is the daily trading going to go for the Dow Jones in the months to come? The Dow Jones has a long way to go before making a new all-time high. Something that happened last on January 4th this year: 36,799. From today’s close, that is 3,954 points to go before the Dow Jones once again makes market history.
Could the Dow Jones soon be trading at new all-time highs? Sure, it could. But I’m not holding my breadth until it does. There are a lot of factors working against that happening. For instance, the EU and NATO got involved in the Biden’s family business in Ukraine, facilitating the Ukrainian-National Socialists in their war against Russia.
Russia is Europe’s source of oil and natural gas. So, understandably Russia cut off Europe’s energy supply in retaliation. That can’t be good for Europe’s economy, including Europe’s banking system. If Europe’s banking system begins defaulting on its obligations, because business becomes impossible, and the banking system’s clients can’t service their debts to their banks, how is that going to impact Wall Street? It can’t be good!
In a world pregnant with counter-party risk, seeing Europe’s economy begin contracting because it lacks the energy to drive its industry, is bad for the entire global stock and bond markets.
In July, the idiot savants at the FOMC drained some $28Bil from their balance sheet, and the latest data from the NYSE on their margin debt (June) shows margin debt contracted by $69 bil. With all this “liquidity” being drained from the market, it’s hard understanding how the stock market is able to advance. Still, it has. What it will do in the months to come may be something completely different. But then this is an election year, a time when strange things happen in the financial markets.
Here are my major market indexes’ BEV values. For the first time in a long time, an index closed in scoring position; the Dow Jones Utilities Average with a BEV of -4.44%. Looking at these indexes from where they were on Monday, and compare that to where they closed on Friday, most of them advanced nicely this week.
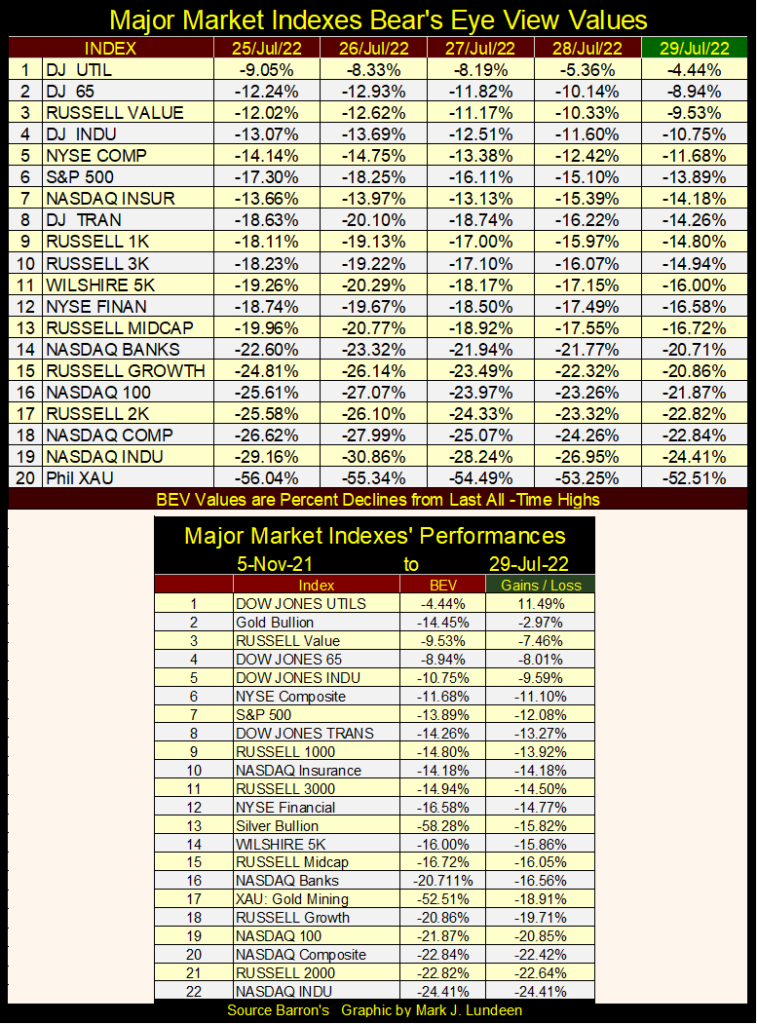
A couple of months ago, gold, silver and the XAU were all in the top four spots in the table above. Gold has remained there, but silver and the XAU have fallen down in this table. Look at the Dow Jones Utilities; up by 11.49% from last November, while just about everything else deflated by 20% to 30% six months later in May. Now at the end of July, these indexes have all rebounded nicely.
The question is; can they keep it up? I doubt they can if consumer price inflation continues, as rising CPI inflation will drive bond yields up and bond prices down. Historically, during a bear market in bonds, being a bull on the stock market becomes a mug’s game.
Here’s a BEV table for the commodities I follow. The data is weekly (not daily as seen in the table above). Also, in the table for market indexes above, the stock market bulls want to see these indexes advance towards a BEV Zero (0.00%), as a BEV Zero is a new all-time high.
BUT, for stock-market bulls, not all BEV Zeros are bullish. Take for example Heating Oil (#1) below. This week heating oil closed this week at a BEV Zero, and that is BAD, as it tells us price inflation in heating oil caused it to close at a new all-time high. For the stock-market bulls, seeing these commodities’ BEV values decline as they did during the Depressing 1930s, BEV’s below -60% would be very bullish for the stock market, if not for the commodities seen below.
That would mean gasoline prices below $2.00 a gallon, and $50 purchasing at the grocery store what today takes $100. Do you think that is likely any time soon? I don’t believe that is likely either.
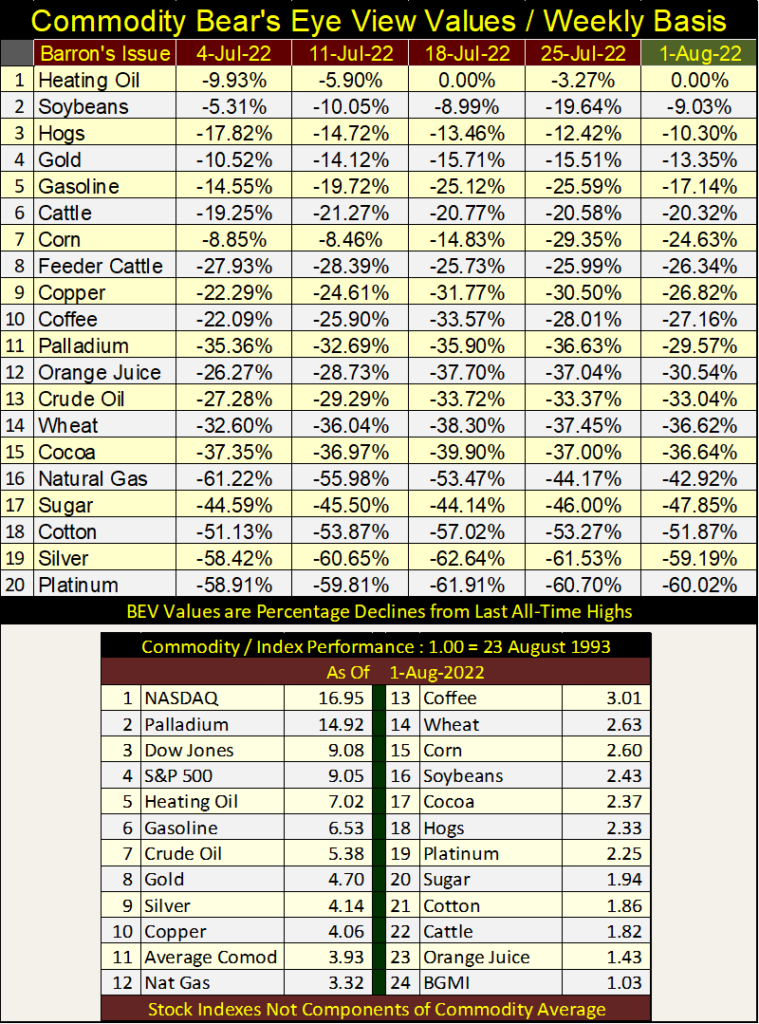
In the table above I’ve posted the factors these markets have advanced since August 1993. As you can see, the only commodity in the top four is palladium, and the Barron’s Gold Mining Index (BGMI) comes in last.
So, as August 2022 is about to begin, the stock market has outperformed commodities for the past three decades. That is true, but what will this table look like ten years from now? Sure, the stock market had a good July, and maybe it will also have a good August and September. But I’m still a bear on stocks and bonds, because I believe the bull market in commodities (raising CPI inflation) is going to be a real factor in the economy for the foreseeable future. Resulting in rising yields for bonds and stock dividends, as market valuations for financial assets deflate.
NYSE margin debt data for June came in. Margin debt fell by $69.5 billion dollars from May, while the FOMC’s QT reduced its balance sheet by only $28bil of the promised $40 billion dollars for July.
I’ve wondered about this before; if one of the problems the idiot savants at the FOMC are having with their QT is the significant month over month reduction in margin debt. It peaked last October, and except for last February, has gone down every month since. Makes no difference, whether draining “liquidity” from the market via reduction in margin debt or via a QT, deflation in credit isn’t good for the stock-market’s bulls.
Looking at margin debt is much like looking at the market from a rearview mirror; it’s a lagging indicator as we’re looking at what happened in the past. None-the-less, looking at margin debt in the chart below, plotted with the Dow Jones going back to 1979, has functioned as if it were a leading indicator; where margin debt peaks before the Dow Jones at the termination of its market advances. That happened during the NASDAQ High Tech bull market, for the sub-prime mortgage bull market, as well as for the March 2020 flash crash.
As of June, NYSE margin debt is down by 27% from its highs of last October. Small wonder the stock market has been struggling since the first of this year, or that the idiot savants at the FOMC have so far refused to drain their balance sheet by the promised $40 billion a month, month after month beginning in May.
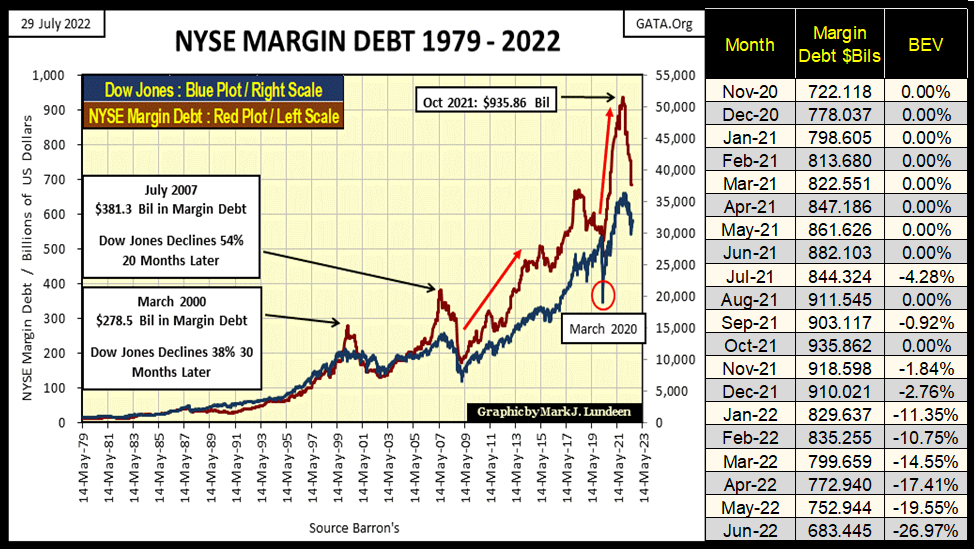
So far, my proxy for the broad-stock market (the Dow Jones), at its maximum decline (June 17th) has deflated by only 18.78% from its last all-time high of last January. That seems a bit meager considering the 27% drop in margin debt. Then, since June 17th the Dow Jones has managed to advance a bit, closing this week with a BEV of -10.75%.
Looking at the chart above, since 1979, the Dow Jones has seen no long-term advance without an associated increase in NYSE margin debt. That plus when margin debt peaks, and begins to decline, the Dow Jones has always entered into a significant bear market decline.
So, what is the takeaway from the NYSE margin debt chart above? Well, I’m going to make the assumption that credit will continue to drain from margin debt for the foreseeable future. Though should we see a month, maybe two where margin debt increases, that is something to be expected. And with this deflation in margin debt, the Dow Jones will continue deflating to new bear market lows.
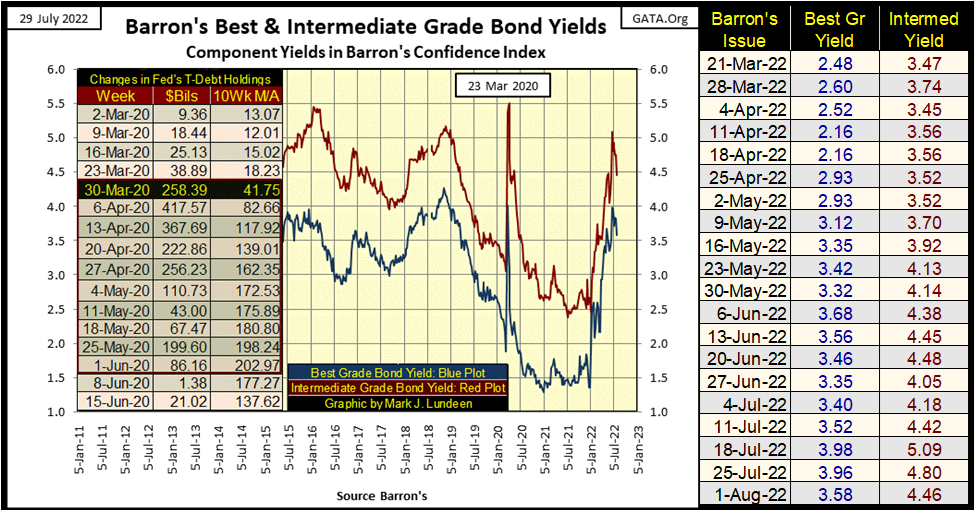
There are good reasons for expecting the current bear market in stocks to continue; one is that the bear market in corporate bonds continues (chart below). In the wake of the sub-prime mortgage bear market, with the implementation of Doctor Bernanke’s QE#1, much debt was taken on by all to “stabilize market valuations.”
So today, corporations have taken on massive amounts of debt they must now carry – service with regular interest and principal payments. Rising bond yields only makes those burdens harder to manage, if these corporations’ debt management strategy included rolling over maturing debt into new bonds with today’s high yields.
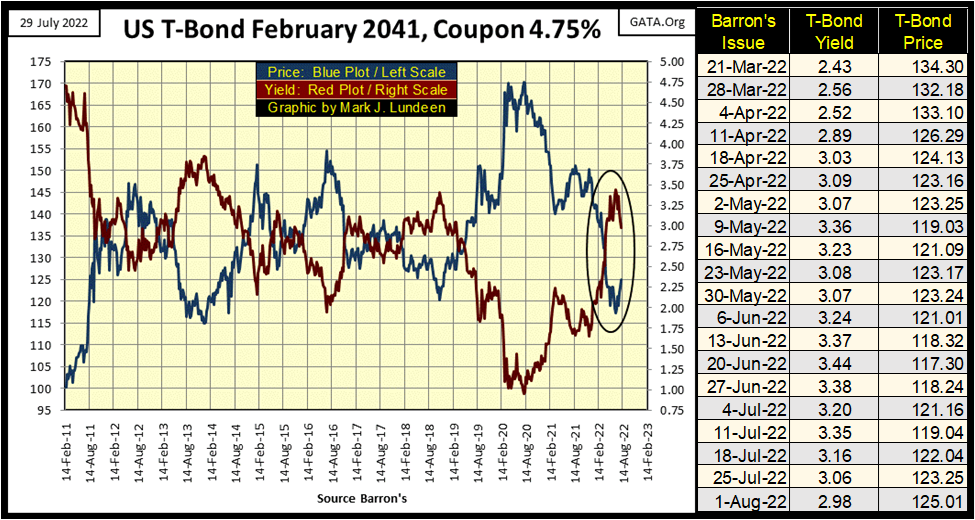
One corporate entity that never pays off past debts, but always rolls over old debts with new bond issuances is the United States Treasury. For the T-bond below, in August 2020, its yield was under 1%. But a few weeks ago, in June, this bond was yielding 3.44%. What happens when the T-bond market begins demanding a yield of 5% or more?
It may seem impossible to most, but even the United States Government can go bankrupt if it can’t pay on its debts. But then, the US Government has the Federal Reserve, which will always buy as many T-bonds as it has to, to keep the Federal Government solvent. But that can only be done by inflating the US dollar’s valuation down to nothing. At what price will a gallon of gas go for then?
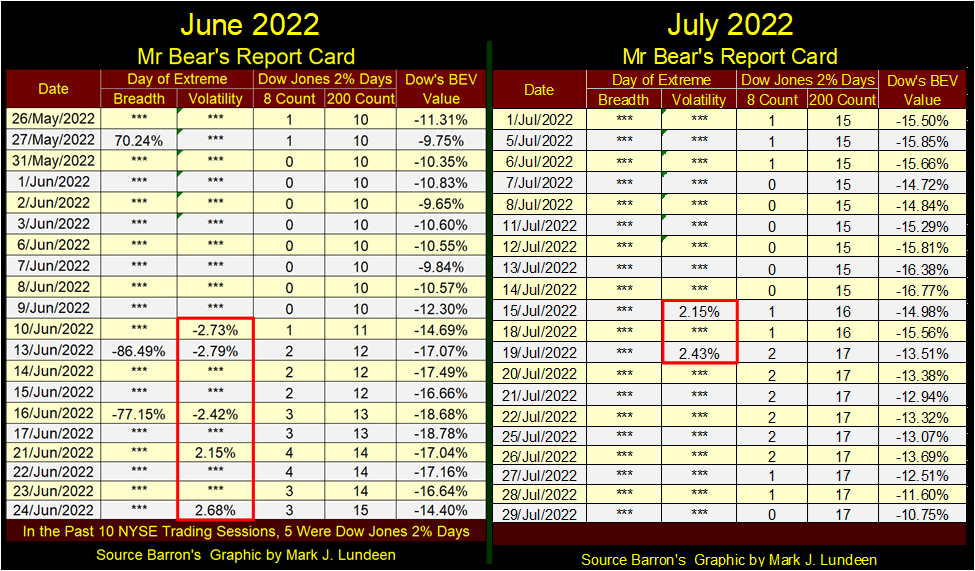
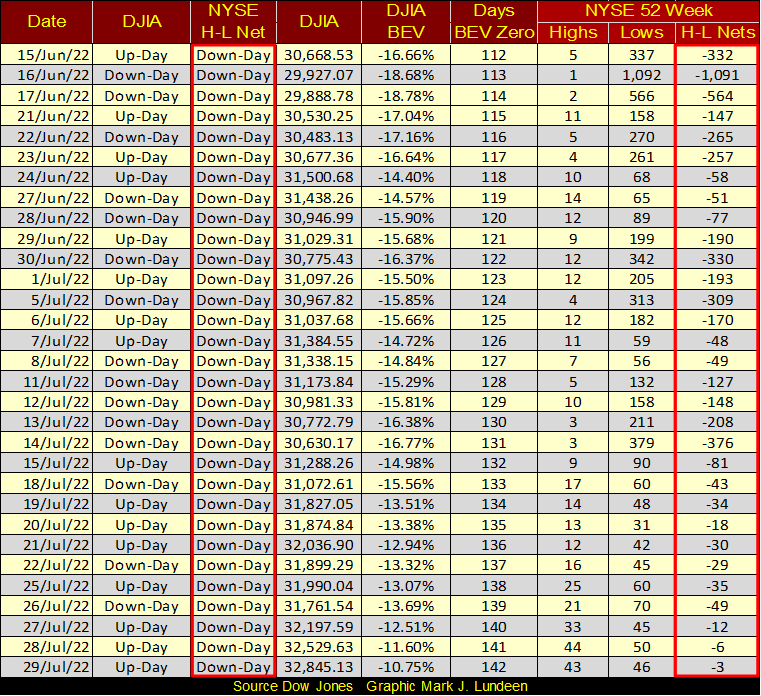
As we move into August 2022, my case for the bear market may now be looking increasingly weak. In June, Mr Bear’s report card below showed many days of extreme market breadth and volatility; market extremes that are almost exclusive to bear market declines. Then in July what do we see below? Just two days of extreme market volatility; Dow Jones 2% days in the red box below.
However, we should also note the case for a bull market is also weak, as seen in the 52Wk High-Low nets for the NYSE below. There hasn’t been a day at the NYSE with a positive 52Wk H-L Net since June 8th; a day with more 52Wk Highs than 52Wk Lows. And during bull markets, that is exactly what the NYSE sees; daily more 52Wk Highs than Lows.
But what do we see below? More 52Wk Lows than Highs, which is what the NYSE sees during bear markets. Yes, since July 15th the volume of 52Wk Lows has lessened, but 52Wk Lows remain more abundant than 52Wk Highs at the NYSE.
If the bulls have flipped the stock market from being a bear, to being in a bull market, where are all the 52Wk Highs at the NYSE?
We’re in the dog-days of summer for the stock market, a time when nothing exciting happens is typically the market’s headline at the end of each day’s trading. Come this autumn, I expect things will change. Being a bear, I expect seeing market valuations once again coming under pressure.
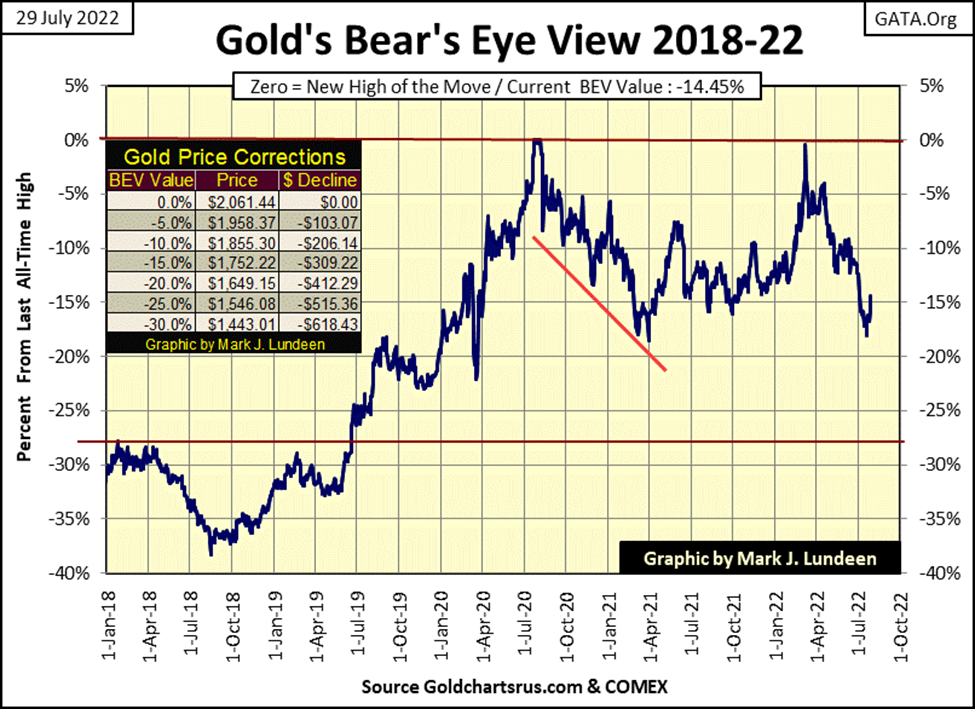
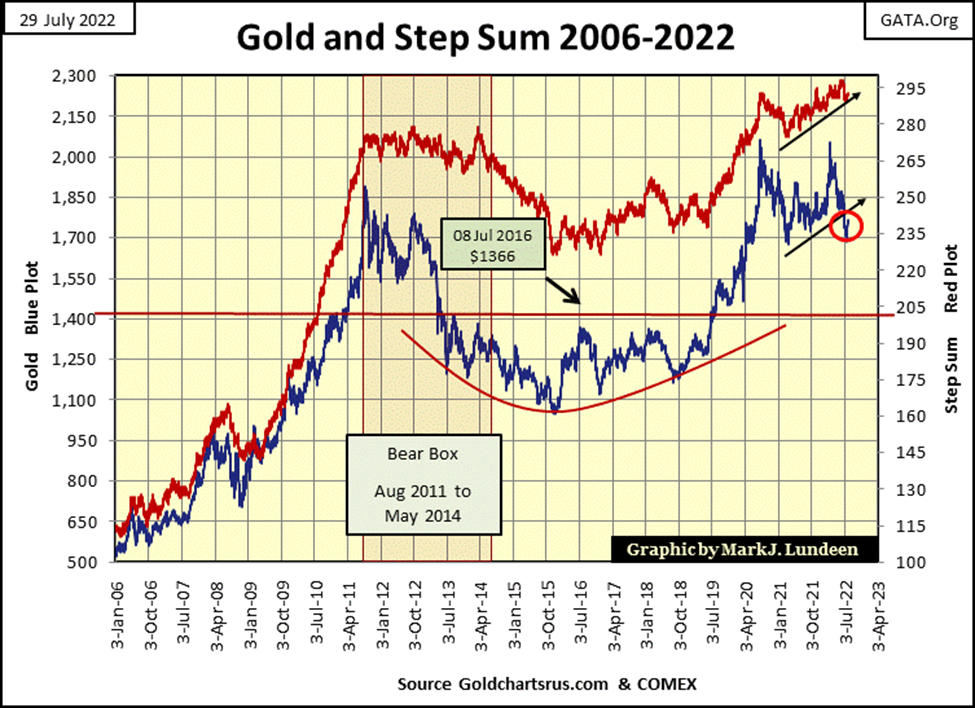
Let’s move on to gold’s BEV chart. When I last covered this chart, I was wondering whether gold would break below its BEV -20% line, or break above its BEV -15% line. It’s nice seeing gold has decided to break above its BEV -15% Line on Thursday and Friday of this week. But what about next week? Can gold keep above this important technical level? I wish it will. But experience has taught me I’m not the guy who should dare answer such questions.
But I will say that gold almost made a new all-time high last March, a BEV of -0.45% on March 8th. Since then, the COMEX goon squad drove the price of gold down to a BEV of -17.19% on July 15th.
Like me, my readers will have to wait to see if the COMEX goons are now in need of a rest, after what must have been a hard four months of selling phantom gold, by the ton, into the future markets. If that is the case, gold should see a nice advance from here. If not, we may see gold break below its BEV -20% line.
Want a word of advice? Here it is: don’t sweat the small stuff. In our world of ever-growing levels of debt and currency debasement by the global central banking cartel, gold, silver and the mining companies that produce them are the place to be.
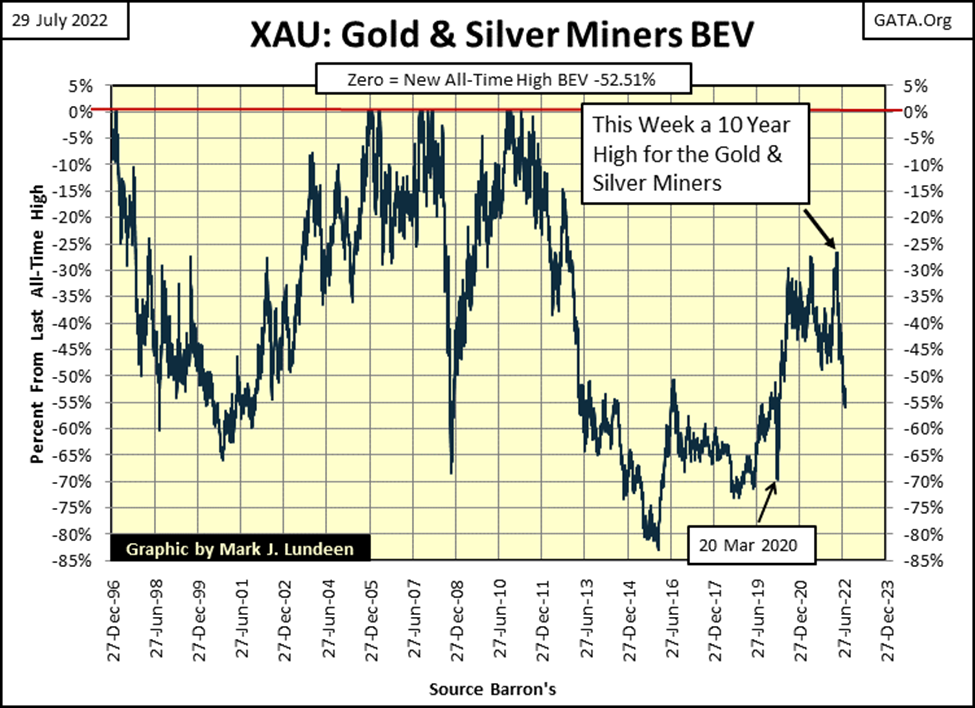
Like everyone else, I wish the XAU below was making new all-time highs. But it’s not. What it is doing right now is letting anyone who is interested, to buy mining shares at prices 50% below their last all-time highs. If the way to make money in the market is to buy low, and later sell high, then now is the time to be buying the gold and silver miners.
So, when can we sell these shares higher? As if I know! Like me, you’ll have to wait. Patience is a real virtue in this market. A virtue that will one day richly reward you.
The chart below is my BIG PICTURE for the markets of August 2022. The last, and only time the Dow Jones (Red Plot) exceeded the growth in CinC (Green Plot: paper dollars-in-circulation) was a century ago during the Roaring 1920’s bull market (see insert). In 1966, the Dow Jones almost caught up with CinC inflation, but failed. Since 1966, try as best they could, the bulls running wild and free on Wall Street have failed to drive the Dow Jones up above the rate of inflation of CinC. And on each failed attempt, the gap between the Dow Jones and CinC inflation only grew wider.
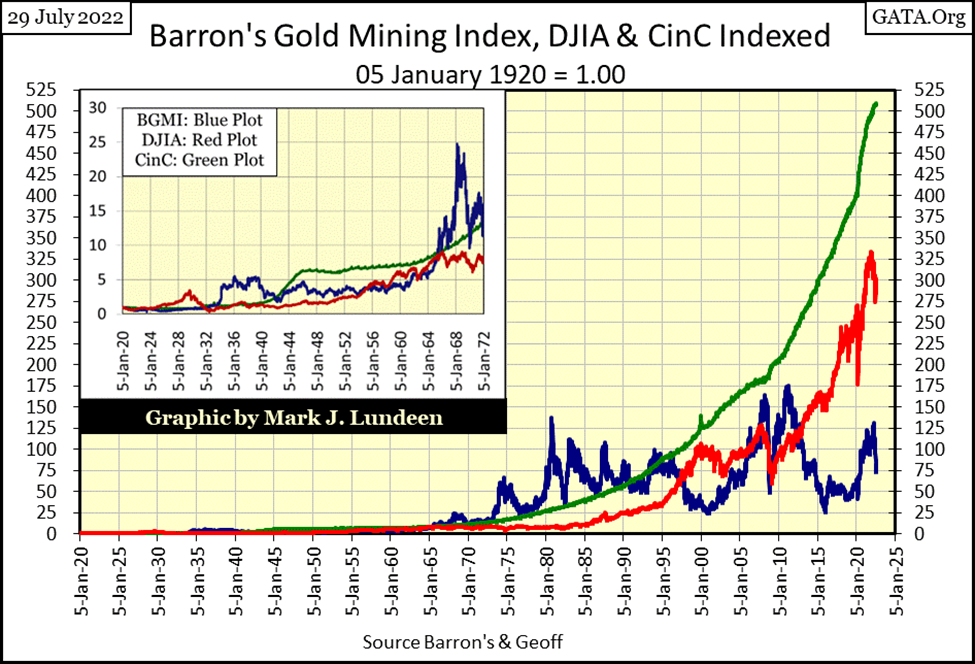
Now look at the BGMI (Blue Plot). The Dow Jones saw a bull market during the roaring 1920s. But the BGMI saw an even larger bull market during the depressing 1930s! (See insert). In 1966, the BGMI exceeded the rate of CinC inflation, and stayed ahead of CinC inflation until 1990.
Twice, in 2008 and again in 2011, the BGMI made an attempt to break above the rate of CinC inflation, but was beaten back by the “policy makers” for their fear of what would happen should shares in gold and silver mining become the #1 performing stock group.
As I read this chart above, the gold mining shares (BGMI, XAU, HUI) are coiled like a spring, waiting to be let loose to make another attempt to break above the rate of CinC inflation. The BGMI closed the week at 764.82. For it to once again catch up with CinC inflation in the chart above, the BGMI would have to increase to 4730. Is that possible? In time, I’m sure it is. And most likely when everything else is going to hell in a hand basket, as during the depressing 1930s.
In gold’s step sum chart below, since last March gold has been in a bear box, with its step sum actually rising as its price plot has declined. Typically, this is a set-up for a big price decline for gold, but not always.
I’m not going to sweat the small stuff, like this bear box for gold in a world where idiots manage “monetary policy”, and a bumbling buffoon resides in the White House. And the US Congress? The entrenched politicians who control it see the Federal Government as their personal possession, and to hell with everyone, and everything else.
There are problems all over the world. Banks in China were seeing runs, until the police broke up the depositors’ protest. I’d post the link, but YouTube (Google) pulled the video down. Why would Google do something like that? Because like so much else in the United States, the Chinese Communist Party bought them?
I also hear that Europe’s banks are also having problems. One day we all may wake up, and the world around us will have changed beyond recognition. That being the case, I like precious metals assets more than stocks or bonds.
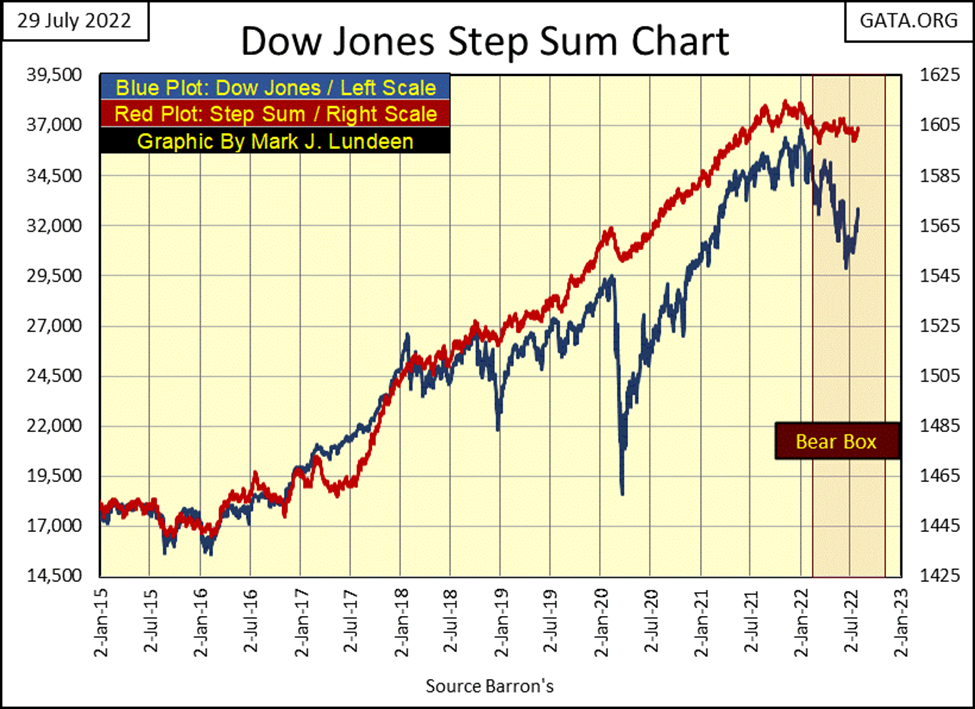
Like gold, the Dow Jones below has been in a bear box since the early part of 2022. But this is one bear box I don’t want to ignore. Not yet anyway, as autumn has a way of creating big problems for the stock market.
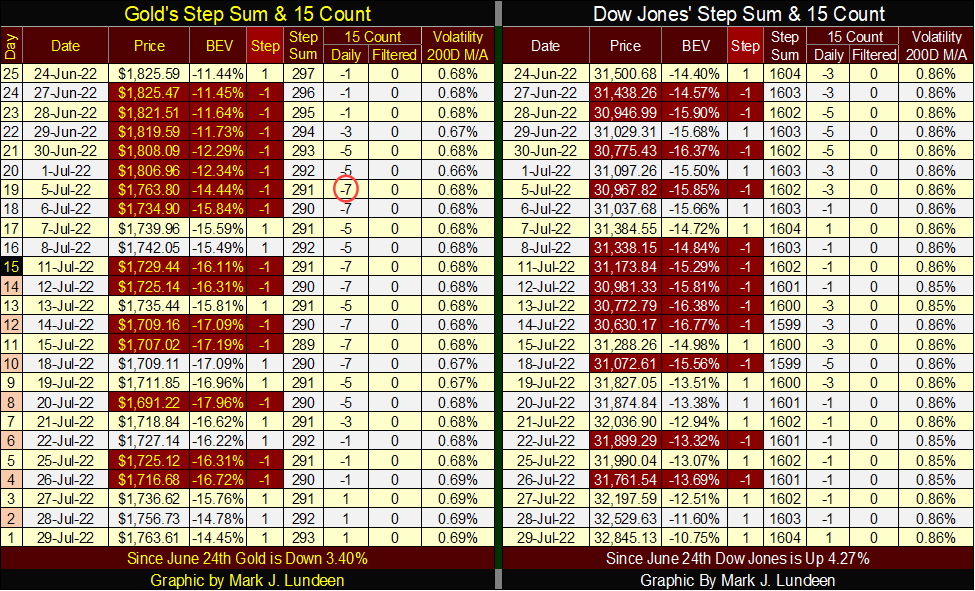
In gold’s step sum table below, gold saw a 15-count of -7 on July 5th, which is an oversold market, and markets don’t like being oversold. But speaking for myself, I wish gold’s 15-count had fallen to a -9 or even a -11, and became really oversold.
As it is, on July 20th gold broke below $1700, and has bounced nicely since then. I have my fingers crossed that this rising trend in gold continues. Gold’s daily volatility’s 200D M/A is no help. Unlike the stock market, bull markets in gold are volatile markets. But then so are bear markets in gold. Basically, when gold is doing something significant, either up or down, volatility rises.
It’s good seeing this decline in gold being done with low volatility, as it implies the bears don’t have the force with them. Meaning, the next time gold’s daily volatility’s 200D M/A moves above 1.0%, it will be in the context of a bull market in gold.
__
(Featured image by AbsolutVision via Pixabay)
DISCLAIMER: This article was written by a third party contributor and does not reflect the opinion of Born2Invest, its management, staff or its associates. Please review our disclaimer for more information.
This article may include forward-looking statements. These forward-looking statements generally are identified by the words “believe,” “project,” “estimate,” “become,” “plan,” “will,” and similar expressions. These forward-looking statements involve known and unknown risks as well as uncertainties, including those discussed in the following cautionary statements and elsewhere in this article and on this site. Although the Company may believe that its expectations are based on reasonable assumptions, the actual results that the Company may achieve may differ materially from any forward-looking statements, which reflect the opinions of the management of the Company only as of the date hereof. Additionally, please make sure to read these important disclosure


Blockchain Evolves Toward AI, Finance and Quantum Security
Blockchain is evolving beyond crypto into finance, AI applications, and digital markets, while security and regulation remain challenges. Quantum threats...


The Italian Crowdinvesting Market Faces Sharp Decline in 2026
Italian crowdinvesting market continued to decline in 2026, with fundraising falling 36.8% year-on-year to €164.19 million. Platforms and active campaigns...


Sartorius Stedim Biotech Maintains Growth Momentum in H1 2026
Sartorius Stedim Biotech reported solid H1 2026 results, with revenue reaching €1.527 billion and EBITDA rising to €479 million. Growth...


Bank of Africa Launches BOA MDM Network to Boost Diaspora Investment in Morocco
Bank of Africa launched the BOA MDM Network to channel diaspora remittances into productive investment, aiming to raise their share...


Switzerland’s Medical Cannabis Reform Advances Access, But Barriers Remain
Switzerland’s 2022 medical cannabis reform improved patient access by removing federal approval requirements, but challenges remain. MEDCAN highlights barriers including...
 |
|
 |  |
 |
|
-

 Impact Investing1 week ago
Vexuvo Secures €39M UniCredit Financing to Drive Agrivoltaic and Storage Expansion in Italy
-

 Markets5 days ago
Oil Surge, Weak Stocks, and a Potential Turn for Gold
-
 Markets2 weeks ago
Quiet Markets Await a Catalyst as Jobs and Oil Support Sentiment
-
 Crypto2 days ago
Bitcoin ETFs Lead as German Stock Exchange Debuts Mining ETF