Featured
Market volatility continues to increase
Since January, the market volatility is swinging between highs and lows. Is this volatility looking attractive for a bearish market?
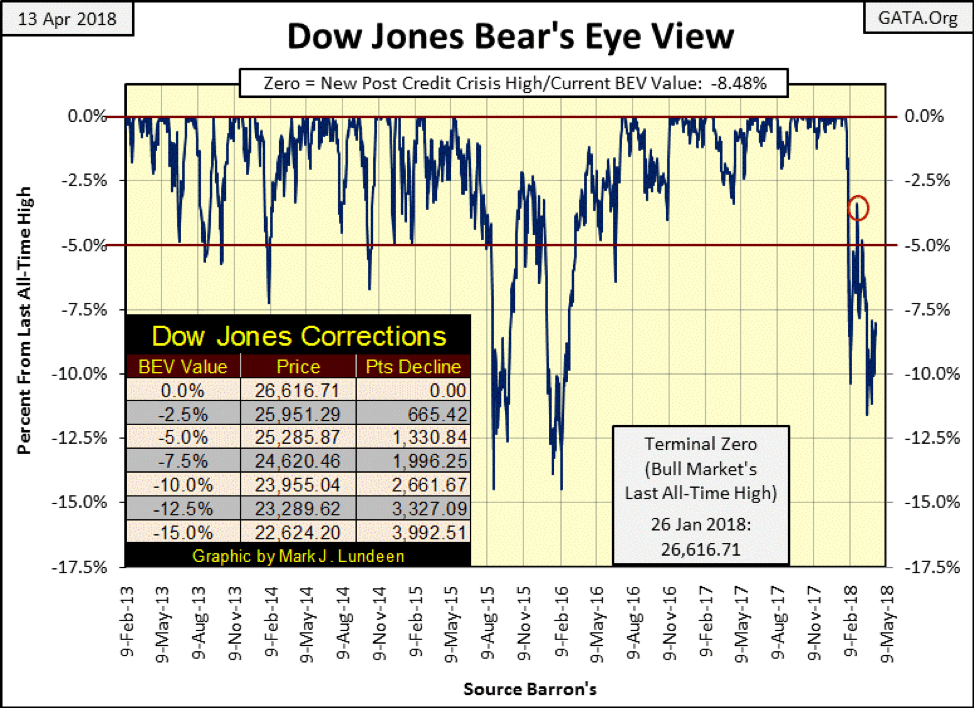
I didn’t miss anything by skipping last week’s posting. The Dow Jones saw its latest correction bottom on March 23 declining to -11.58%in the BEV chart below. Since then, the Dow Jones has oscillated from just below -10% and up to the -8% BEV levels as bulls and bears alike wait to see what is coming their way.
So what’s next for the Dow Jones? Well, my thinking is it saw its last all-time high on January 26, and in the three months that followed, its BEV plot has developed a pattern of lower highs and lower lows.
That’s not a bullish chart pattern we see below and won’t be until it breaks above the -3.41% seen on February 26 (Red CBlueircle). A 5% move from today’s closing would be all it takes to cheer the bulls by reversing this bearish chart pattern, but will the Dow Jones do that? If the bull market still lives, it will do that and more. However, if the Dow Jones’ next move is to break below that -11.58% seen on March 23, I’m going to stop even considering the Bull’s case in this market.
© Mark Lundeen
What’s bothering me isn’t the possibility of seeing the Dow Jones correct down to even the -20% BEV level. That happens in bull markets. But the current advance began in March 2009, advancing 20,000 points as of January 2018. Nine years is a long time for the stock market to advance without seeing a significant correction. The largest correction so far was a 16% decline in 2011, so we’re due for a major retrenchment in market valuations.
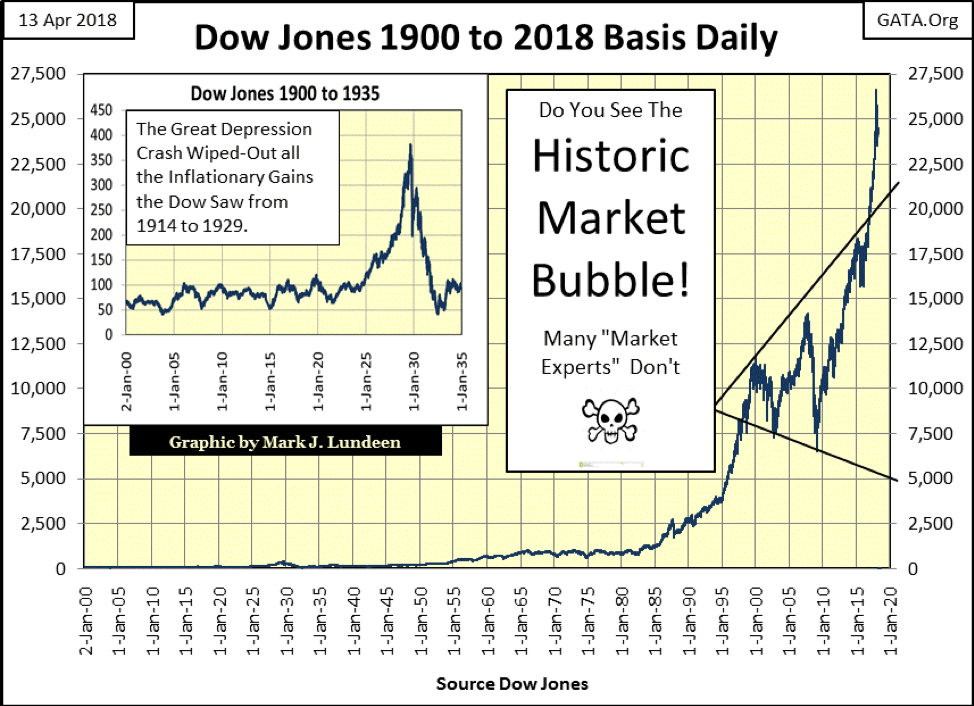
The thing that nags me the most is seen in the chart below. The Dow Jones (my proxy for the broad stock market) is grossly overvalued and has been for years, if not decades. Just looking at the chart below, selling today and keeping away until the Dow Jones breaks below its 5,000 level isn’t unreasonable, however long, how many years that may take.
© Mark Lundeen
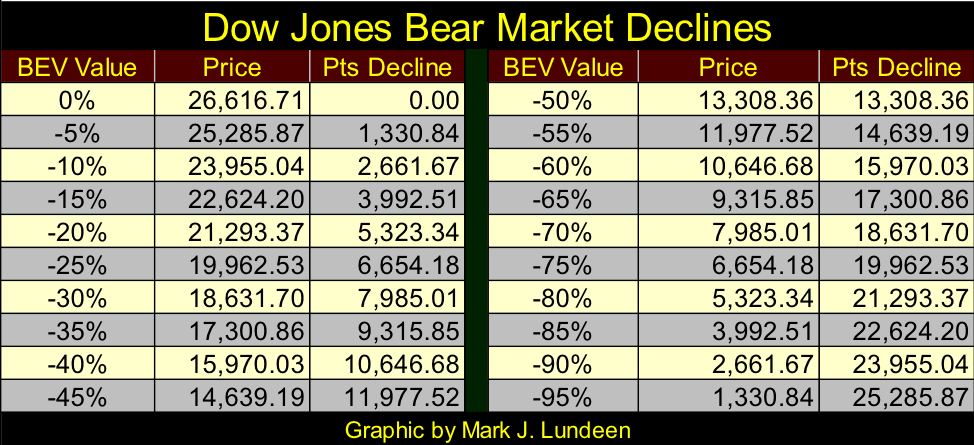
As seen in the table below, a Dow Jones decline to the 5,000 level would be a decline of over 80%—a great depression event. Before the coming bear market exhausts itself, I’m concerned its ultimate bottom may even surpass that of the depressing 1930s: an 89.19% decline in the Dow Jones. We’ll call that the -90% row or deeper in the table below.
© Mark Lundeen
But that doesn’t mean the stock market is drawing near its point of panic that ultimately develops in every bear market. However, it could. In 1929, the Dow Jones peaked on Sept. 3, and then the dreaded 2% days (days of extreme volatility) began piling up. By trading day 40 after the top, the Dow Jones broke below its BEV -15% line. Eight days later, “Black Tuesday” happened. As the Dow Jones came within a hair of breaking below its BEV -40% line, former millionaires were jumping out of windows overlooking Wall Street; all this happened only 48 trading days after the Dow Jones’ bull market top of September 1929.
The second deepest bear market was our sub-prime bear market. From a bull market peak on October 9, 2007, the Dow Jones didn’t break below its -15% level until trading day 71 (Jan. 22, 2008) but recovered after by recouping half of its losses. It wasn’t until July 2008 that the Dow Jones broke below its -20% BEV level, nine months and 184 trading days after the top. But the bulls didn’t begin to stampede in a panic until October 2008. A full year after the Dow Jones saw its last all-time high, it finally broke below its BEV -40% line.
Currently, we’re at trading day 53 after the Dow Jones last all-time high, closing the week only -8.48% below its last all-time high. I’m thinking we’re in a bear market, but it may be a while before we begin seeing the bulls begin to sweat.
Here is something to take note of: “market experts” are beginning to notice the market’s increasing volatility. I saw this last week on Drudge, nothing has changed since then:
“I have never seen a market this volatile to this extent in my career. Now that’s only 66 years, so I shouldn’t make too much about it, but you’re right: I’ve seen two 50% declines, I’ve seen a 25% decline in one day and I’ve never seen anything like this before.”
– Jack Bogle, Vanguard Group founder and retired CEO
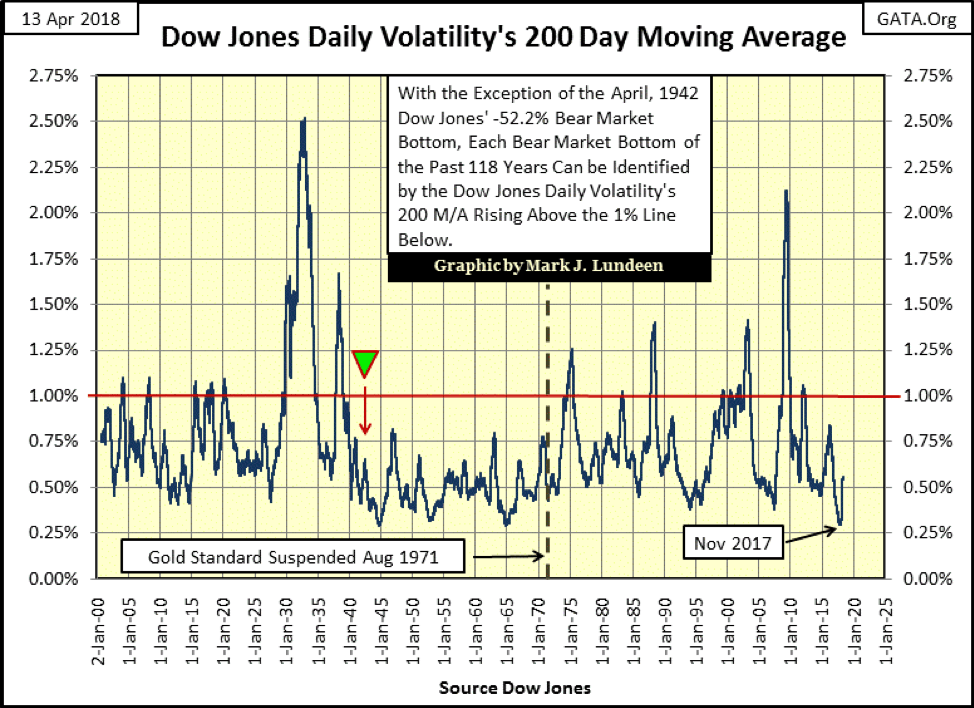
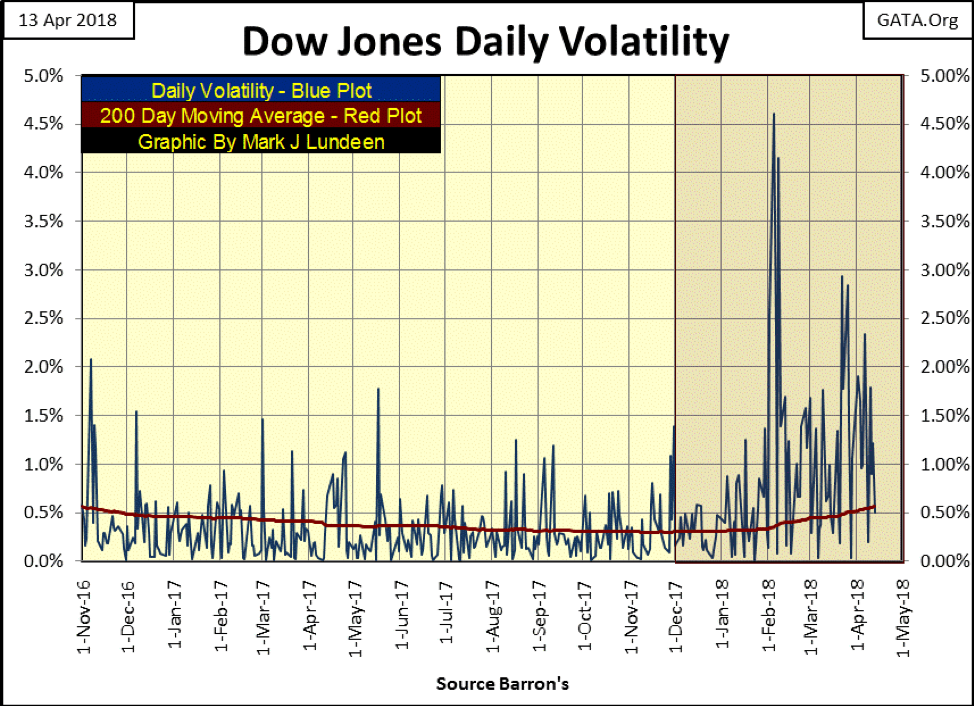
This is ridiculous, and I hope Jack Bogle knows it as this is so easy to prove otherwise. Looking at the daily Dow Jones volatility going back to 1900 below, using a 200-day M/A of the percentage moves from one day’s closing price to the next, we’ve barely broken above the 0.50% line, closing the week at 0.56%.
This is peanuts compared to the daily volatility seen just a decade ago during the sub-prime mortgage debacle, where this 200-day M/A broke above the 2% line! Do you remember what that felt like? Ten years ago, we saw several daily moves (up or down) by greater than 4% week after week. And then there was the Great Depression where this 200-day M/A broke above the 2.50% line.
I can’t say with certainty where the current bout of volatility will peak. Will volatility for the Dow Jones rise above the 1.0% or even make history breaking above the 2.75% line? I don’t know. But I can say that Jack Bogle, in his 66-year career, HAS seen more volatility than what we have so far seen since the beginning of 2018.
That said, the rising volatility seen below since late January is a harbinger of woe for the bulls.
© Mark Lundeen
This confusion about today’s “massive volatility” comes not from large daily percentage moves but from a market that has had its valuations inflated far above the point of prudence. The entire 89% decline for the Great Depression bear market was only 340 points in the Dow Jones from its 1929 top (381.17). A 340-point drop from today’s closing price is only a 1.4% move. You can thank the Federal Reserve and its inflationary “monetary policy” for this momentous change in valuations in the stock market.
You can also see it in the chart of the Dow Jones. From 1966 to 1981, the Dow Jones attempted five times to break above, and stay above 1,000, but failed. Then, on Dec. 17, 1982, it broke above 1,000 (1,011.50), never again to decline to a three-digit daily closing price as the flows of monetary inflation flooded the stock market.
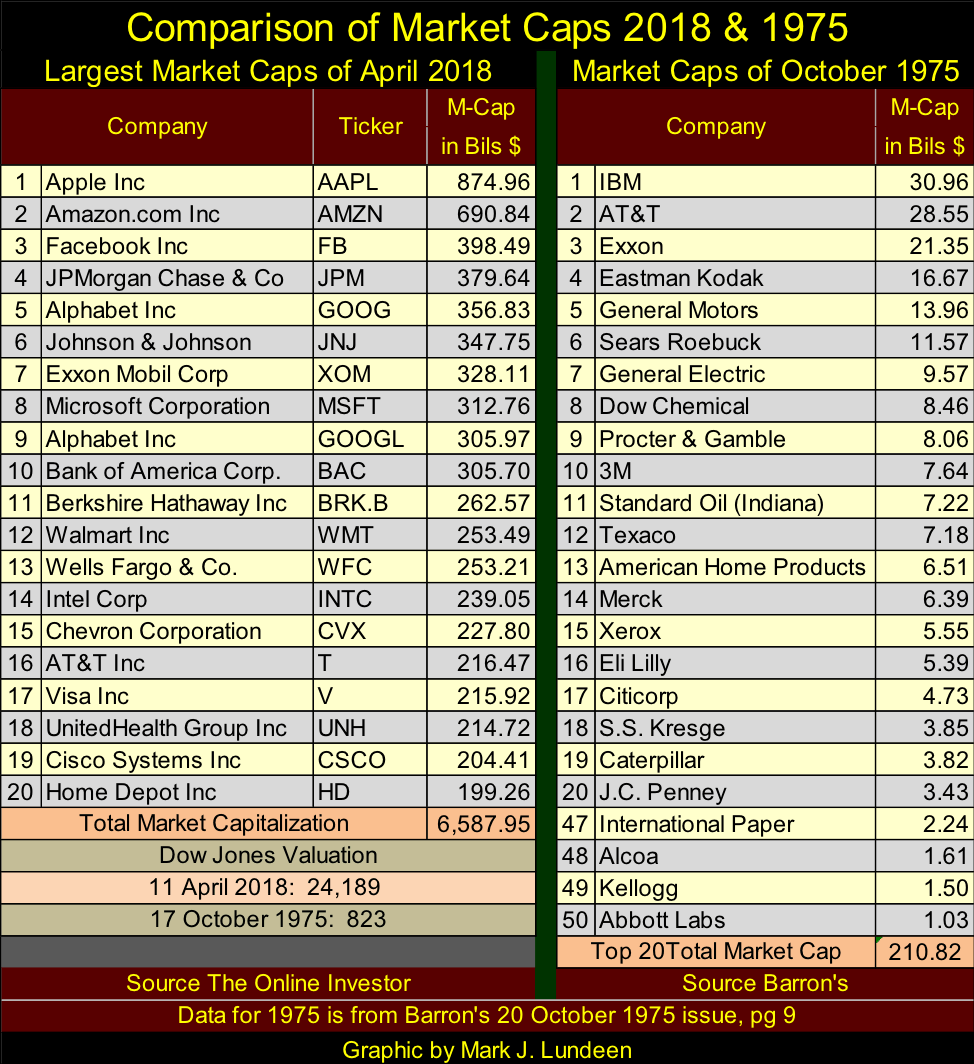
The table below lists the top 20 market capitalizations for 2018 and 1975. The list for 1975 (published in Barron’s) included the top 50 stocks, so I included the bottom four of the list to point out how most of the 1,800 companies then traded on the NYSE didn’t even have a capitalization of $1.0 billion.
How many billionaires are walking around in 2018? About 1,500 was the last figure I last heard. In 1975, I doubt there was even one unless you included political figures such as the house of Saud and the Shah of Iran.
Some of the listings for 2018 weren’t even founded in October 1975, and some of the listings from 1975 are no longer with us or exist in greatly reduced circumstances. But Exxon is in both lists. In 2018 (number seven), it has a market cap of 328.11 billion; in 1975, Exxon was number three on the list with a market cap of $21.35 billion. The differences in market capitalization from 43 years ago isn’t from how many barrels of oil Exxon delivered to the market but how many inflationary dollars are circulating in the stock market in 2018 as there were for 1975.
© Mark Lundeen
Most people believe a rising stock market is an indication of “economic growth.” But actually all that’s happened is since 1975, “monetary policy” has inflated the market capitalization of Exxon by a factor of 15.4. As the S&P 500 is an index of the market capitalization of the 500 largest companies trading in the stock market, we can measure the inflation the Federal Reserve has “injected” into the broad stock market. On April 11, 2018, the S&P closed at 2,642.19, but 43 years ago, on Oct. 17, 1975, it closed at 88.86. So the valuation for the S&P 500 was inflated by a factor of 29.73, as compared to Exxon’s 15.4 since October 1975.
This is all well and good, as long as the monetary inflation “injected” in the financial system continues circulating in the stock market. The problem with this is that when Mr. Bear comes on the scene and begins stress testing everyone’s balance sheet, from J.P. Morgan’s to yours and mine, most of these dollars are going to flee the deflating stock market. These refugee dollars must go elsewhere if they are to survive. In such an environment, I’m anticipating gold, silver, and the mining shares, currently ignored investments, will benefit greatly.
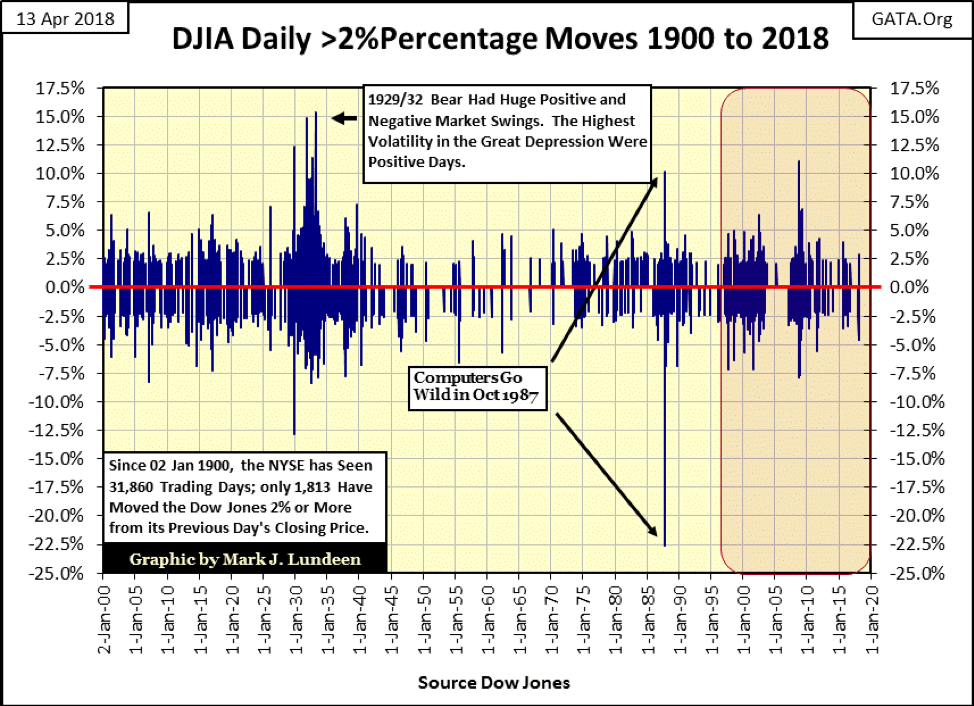
Below are the daily percentage moves (up and down) of greater than 1.9999%, aka 2% daily moves (2% days – days of extreme market volatility) in the Dow Jones going back to 1900. Since January 1900, there have been 32,023 NYSE trading sessions, of which the Dow Jones has moved 2% or more in only 1,820 of them (5.68%). But Dow Jones 2% days typically group together during market declines, especially during bear markets. As you can see, in the three years since January 2015 (chart below), the stock market hasn’t been plagued with Dow Jones 2% days.
Note also how during the depressing 1930s and again during the 2007-09 mortgage crisis, the largest days of volatility were actually up days. This is something you won’t hear on CNBC, where on the big up days in a massive bear market, their “market experts” typically attempt to lure the little guys to jump back into Mr. Bear’s meat grinder one more time. That’s a big mistake as large daily percentage advances in the Dow Jones of over 4% have been and always will be bear market events.
© Mark Lundeen
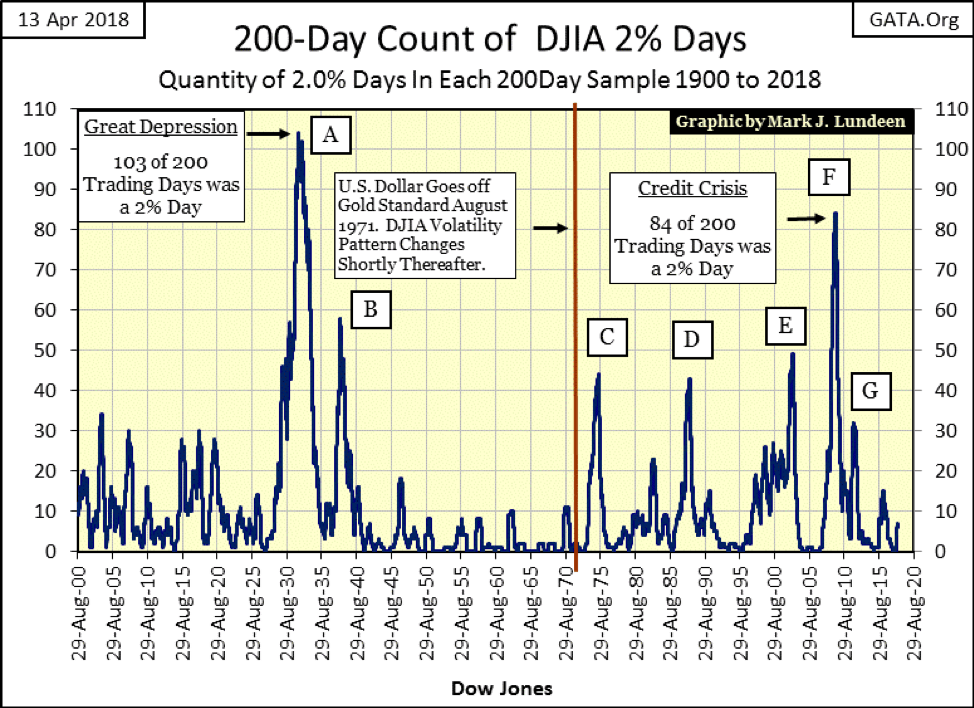
I like this chart above, as it shows the actually daily percentage moves of the 1820 NYSE trading sessions where the Dow Jones saw a “2% day” since January 1900. But the chart below, where I display them in a running 200-day sample (a 200 count), provides a superior understanding of how large daily moves from a previous day’s closing price affects the broad stock market.
Since January 1900, seeing the Dow Jones 200 count rising above 20 identifies a Dow Jones market decline of about or actually greater than 40%. Peaks D & G are exceptions to this rule, and then we had a Dow Jones decline of 52% in April 1942 that occurred on almost no increase in daily volatility. But these are exceptions to a rule that for 118 years has kept investors out of bear markets.
The Dow Jones’ 200 count began 2018 at zero. In the past four months, it has increased to seven. Should the Dow Jones 200 count continue to rise, it will prove not to be a bullish development in the stock market.
© Mark Lundeen
The next chart is an excellent graphic to illustrate my point that increases in market volatility aren’t a positive for the bulls. I’ve plotted the Dow Jones daily percentage moves on a close from one day to the next (Blue Plot) with its 200-day moving average (Red Plot) from November 2016 to today. This covers the market advance that began after Trump’s victory in November 2016 to this week’s close.
Note how from November 2016 to December 2017, during this amazing advance, daily volatility frequently fell below its red 200-day moving average. It was during this period where daily moves (up and down from a previous day’s closing price) were typically less than 0.50%, that the Dow Jones saw itself rise to 99 new all-time highs.
The Dow’s last all-time high was on Jan. 26, just at the cusp of the rising volatility seen below and hasn’t seen any new BEV Zeros since. I expect there won’t be any additional new all-time highs unless the “policy makers” do something to restrain this volatility.
© Mark Lundeen
Below are the frequency distributions for daily volatility seen in the chart above. I used Dec. 1 as my cut off as that was when the Red 200 day M/A turned up, although volatility really didn’t get wild until after Jan. 26. No matter, since the Dow Jones’ daily volatility 200-day M/A turned up in December, the stock market has changed for the worse.
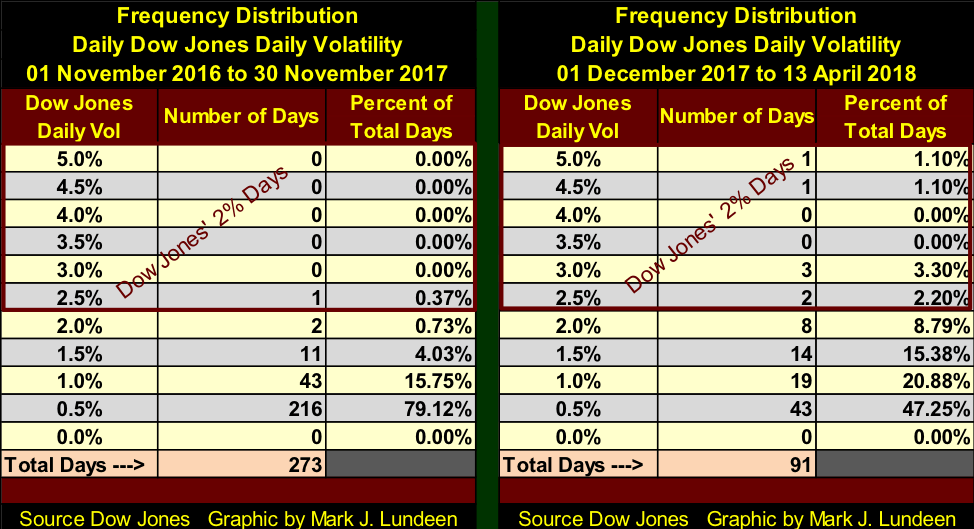
© Mark Lundeen
Moving on to the DJTMG’s top 20, it closed the week at a 51, but not all 51s in the top 20 are created equal. Look at the distribution for the 51s seen in November and early December, the groups cluster in the BEV Zero and -0.001 columns: new all-time highs or within 4.99% of being one. This week also saw a 51 in the top 20; however, the distribution of groups are clustered in the -5% & -10% columns, with no new BEV Zeros (new all-time highs) since Barron’s March 12 issue. The internals of this market are not strong and most likely will deteriorate in the weeks and months to come.
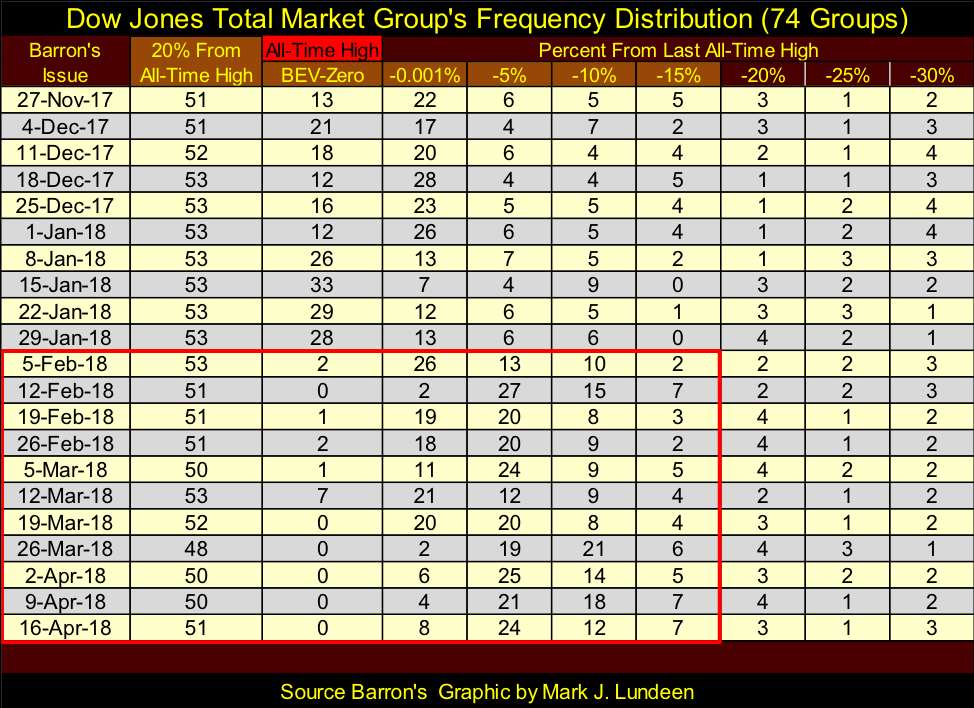
© Mark Lundeen
Maybe the stock market will once again take off to new all-time highs. But nothing I’ve seen in my charts and tables suggest it will any time soon. Actually, I believe the path of least resistance for the Dow Jones and the broad stock market currently is down and will be for the foreseeable future.
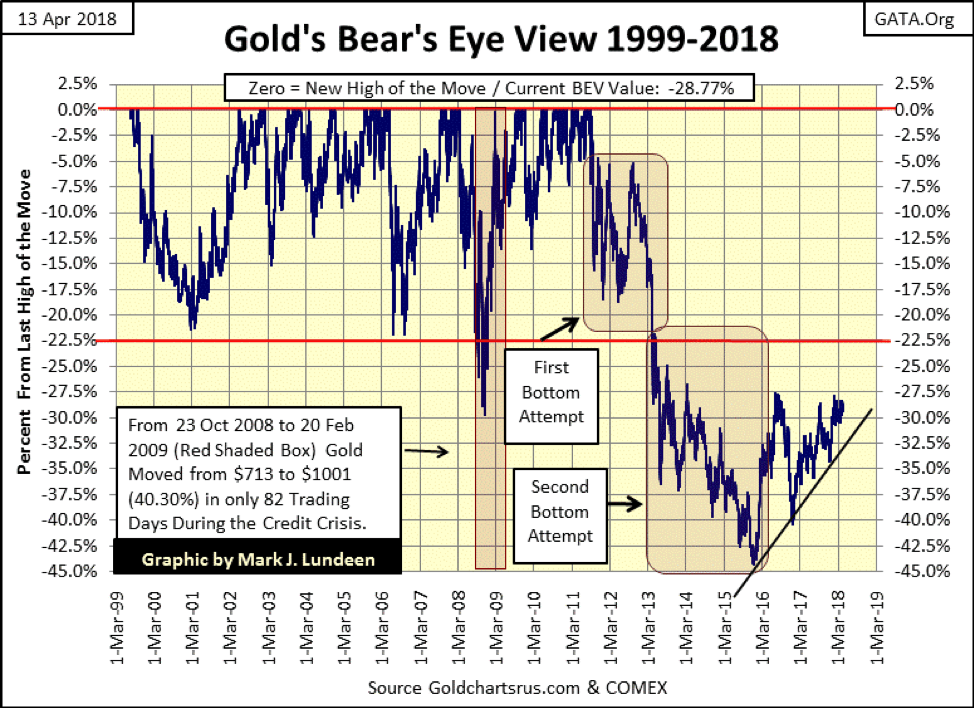
Let’s take a look at gold’s BEV plot below. Nothing changed from two weeks ago, except that we are now two weeks closer to its breakout. Seeing gold only -29% from its BEV Zero of August 2011 is very encouraging. In a hot market, gold could once again be making BEV Zeros (new all-time highs) in a few months.
But as I’ve frequently said, until the stock and bond markets become distressed markets, I’m keeping my optimism for gold, silver, and the mining shares on a short leash. What the old monetary metals and their miners really need is rising bond yields and interest rates to flush out the dollars currently circulating in the stock and bond markets.
© Mark Lundeen
Here is gold’s step sum chart. This chart also is encouraging to the gold bulls.
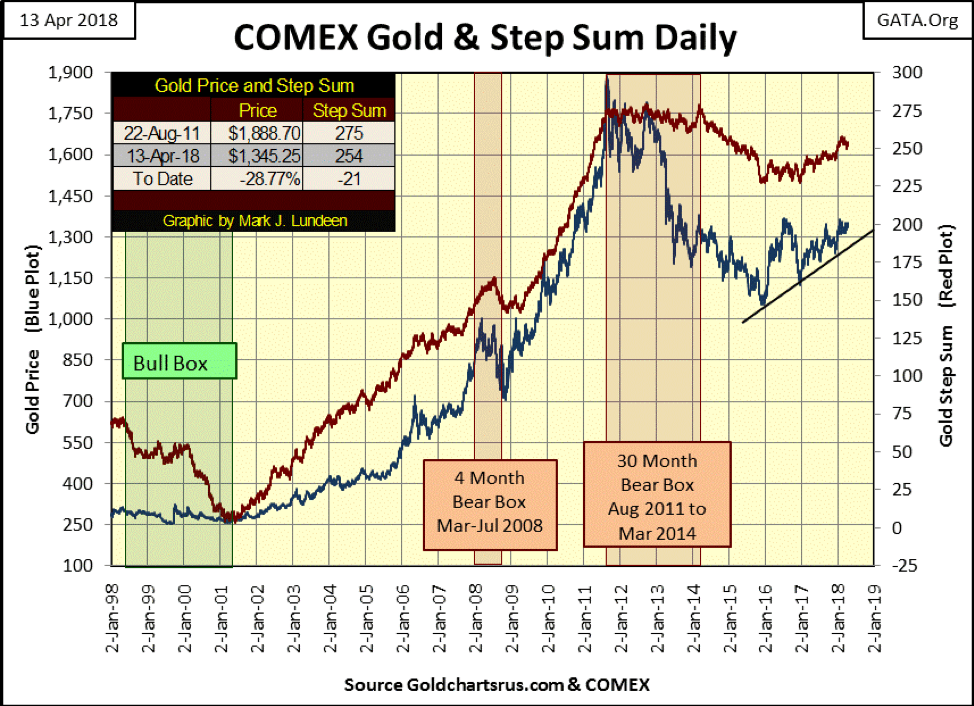
© Mark Lundeen
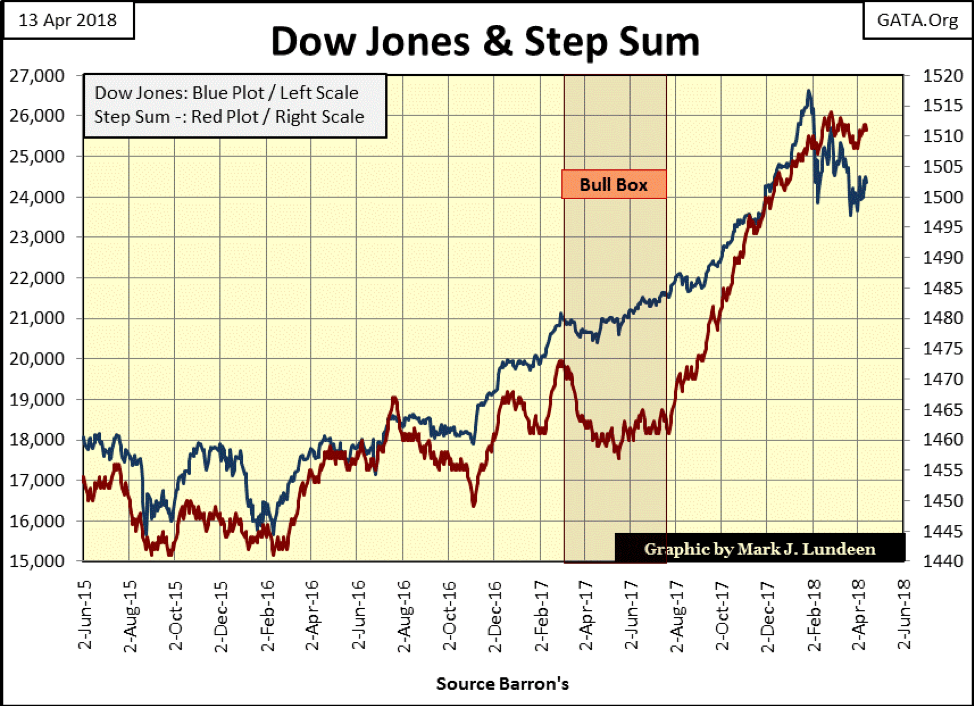
And finally, the Dow Jones step sum chart.
© Mark Lundeen
Exactly like a coin, every market has two sides: the bullish and the bearish sides. Studying the Dow and its step sum above, I wonder what the bulls see in the stock market that would tempt them to risk their capital in it. For the bulls, this is one crummy chart. Since January, the Dow Jones has seen a repeating cycle of lower highs and lower lows, and its step sum (market sentiment) isn’t bullish either.
But on the other side of the market, for the bears, it’s a very attractive chart. It almost motivates me to go out and purchase a few out-of-money puts on the Dow Jones. But I’m not going to do that as my counterparty almost certainly will be a big bank who will default should the financial markets really become distressed by declining market values.
The problem is that there is too much debt carried by governments, corporations, and private citizens. Too many people have been making commitments that can only be honored if the economy and markets remain within certain parameters that I believe will prove to be wildly over-optimistic. Mr. Bear is going to test many financial assumptions taken on governments, corporations and individuals in the past 10 years and, in doing so, cause counterparty failure to run wild in the financial markets.
Spending my money on silver at current prices seems the better course right now. First, there are no counterparty risks when investing in the old monetary metals. That’s something people don’t think about today but a consideration that one day they will appreciate. Secondly, I believe the upside potential to silver is comparable and possibly superior to what an out-of-the-money put has, plus silver doesn’t have a strike price or expiration date.
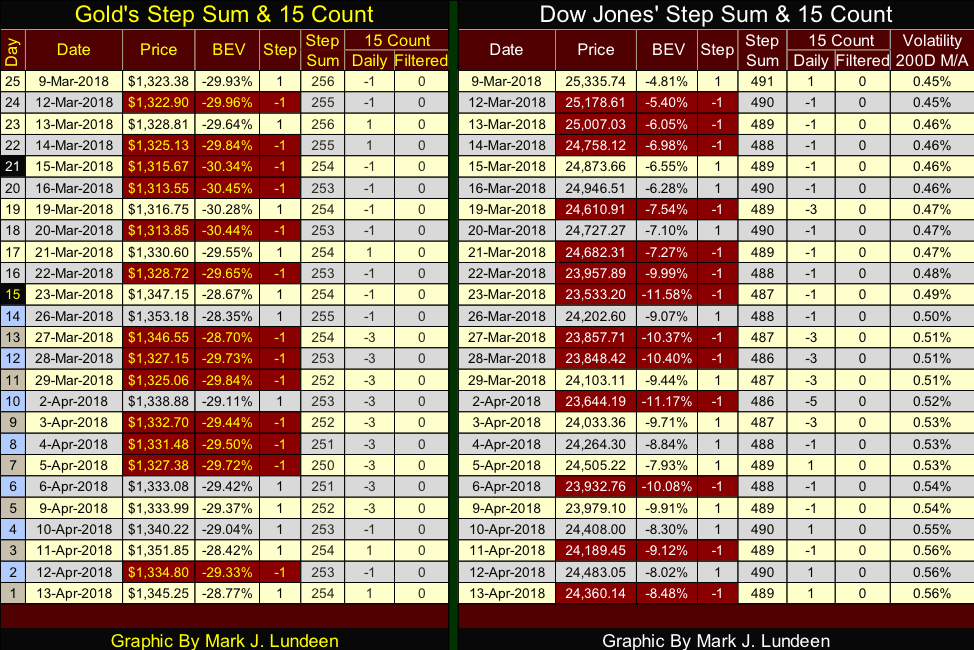
Here are gold’s and the Dow Jones’ step sum tables. With both gold and the Dow Jones 15 counts closing the week at +1, they are seeing as many daily advances as declines for the past three trading weeks. But when the price data in the tables is studied, it becomes evident that gold is the stronger market. Seeing the Dow Jones’ volatility’s 200-day moving average increase to 0.56% this week is a big clue why the stock market is having problems.
© Mark Lundeen
It’s no fun being a bear on the financial markets, especially when the one sector I’m bullish on (precious metals) refuses to do anything to gratify their devotees, like me. But I’m calling things as I see them. Also, unlike most sources of financial information, I show my work in the charts and tables I use.
So I pray in Jesus’s name that 2018 will ultimately prove to be profitable to my followers, and myself, while somehow mitigating the pending disaster to others that is looming somewhere over the horizon.
—
DISCLAIMER: This article expresses my own ideas and opinions. Any information I have shared are from sources that I believe to be reliable and accurate. I did not receive any financial compensation in writing this post. I encourage any reader to do their own diligent research first before making any investment decisions.
(Featured image via DepositPhotos)


Bitcoin Stalls Near $60K as Strategy Moves, ETFs Outflow, and EU MiCA Rules Take Effect
Bitcoin hovers near $60,000 with ETF outflows, while Strategy boosts reserves, sells BTC, and raises dividends to reassure investors. Ethereum...


Cannabis Dominates Global Drug Use: Trends, Risks, and Shifting Markets
Cannabis remains the world’s most widely used illicit drug, with 256 million users in 2024, surpassing all others combined. Growth...


Italy Approves First Hydrogen-Powered Train for National Rail Network
ANSFISA has approved Italy’s first hydrogen-powered train, the Alstom HMU214, for use on the Brescia–Iseo–Edolo line. Capable of 140 km/h,...


Cotton Market Weakness Persists Despite Brief Rebound
Cotton prices fell to new lows last week before a modest rebound. USDA data shows crop conditions remain worse than...


Eli Lilly Hits $1 Trillion Valuation Amid Strong Bullish Momentum
Eli Lilly stock hit a record high, surpassing $1 trillion market value after strong product demand. Shares surged over 7%,...
 |
|
 |  |
 |
|
-

 Impact Investing2 weeks ago
SBTi Net-Zero Standard 2.0 Enhances Corporate Climate Action
-

 Crypto5 days ago
Bitcoin and Ethereum Slide as Market Pressure Builds Amid Strategy Concerns and Layer 2 Disruptions
-

 Business2 weeks ago
Fed Policy Shift Raises Concerns Over Debt and Inflation Risks
-
 Crypto17 hours ago
Bitcoin Stalls Near $60K as Strategy Moves, ETFs Outflow, and EU MiCA Rules Take Effect
You must be logged in to post a comment Login