Featured
Markets on the downside as the US-China trade war hits another snag
Trump tweeted. The markets roiled. For the third time in a year and half trade wars (China/US) came to the forefront. And predictably the markets once again reacted to the downside.

They are at it again. Or, maybe more to the point, Trump is at it again. Or has China overplayed its hand? Everything seemed to be humming along smoothly. Or was it? Markets were rising nicely on the expectation that China and the U.S. would work out a trade deal. Did the markets get ahead of themselves?
That the negotiations have hit a bump is probably not surprising. If one recalls, the NAFTA negotiations also hit bumps. Trump has a history of threats. He has even, at times, threatened Canada, Mexico, the EU, Japan, and South Korea. It is just Trump’s negotiation style, that’s all. He doesn’t even have to be there to set things off. It all got started over the weekend when Trump tweeted that he would lift tariffs Friday (May 10) on a bundle of Chinese goods to 25% from the current 10%. He also threatened to tax all Chinese exports to the U.S. He was clearly trying to ratchet up the pressure on China to force a deal this week.
Friday came and the U.S. did announce its intention to bump tariffs on $200 billion of Chinese goods from 10% to 25%. The sell-off did not have the intensity seen earlier in the week following Trump’s initial tweets. The markets on Friday, May 10 did make small new lows for the current move then reversed. The Chinese threatened retaliation (American farmers are a favorite target) but negotiators for both sides remained at the table, keeping hopes alive that a deal will be made somewhere down the road.
China doesn’t respond well to threats. Recall that Trump also threatened on a hard deadline of March 1. Nothing happened. But the markets didn’t like the threats. The S&P 500 fell 4%, over 100 points. The Dow Jones Industrials (DJI) was down almost 1,200 points. The U.S. thinks the Chinese cheat and break promises. They want to nail down an agreement with ironclad requirements for China to implement.
China has a long memory from the period when foreign dictates during the 19th century imposed “unequal treaties” on them at a time when China was weak. Under the Treaty of Shimonoseki signed in 1895 between China and Japan, China gave up Taiwan and other territories. They also granted Japan most favored nation status, putting Japan on par with the U.S., Britain, France, and Russia. The Great Powers were in the process of trying to divide up China just had they done to Africa and elsewhere.
By 1899 China was in full revolt with the Boxer Rebellion 1899–1901 against the imperial and colonial powers. The rebellion failed and led to the end of the Qing dynasty by 1912. What followed were years of civil war, war, rebellions, and civil war again. The Great Powers gave up on their thoughts of dividing up China. The Chinese cannot return with a deal that would be seen at home as “giving in.”
Trump thinks China will blink. After all, they sell more to the U.S. then the U.S. does to China. They also believe the Chinese economy is more vulnerable than that of the U.S. There is little evidence that is true. The Chinese don’t want a prolonged trade war. But they won’t be bullied either and probably have contingencies in the event of failure. There are many ways that China can hurt the U.S. Tariffs already in place are hurting manufacturers dependent on inputs from China. Farmers targeted by Chinese retaliatory tariffs are suffering, with some going bankrupt even as the Trump administration provides subsidies to cushion the blow. If the tariffs are increased again, they will hit American consumers more directly and visibly.
Global trade is already under pressure, according to the World Trade Organization (WTO). World trade slowed in 2018 thanks to global trade tensions and economic uncertainty. The WTO expects trade volume growth to slow to 2.6% in 2019 down from 3% in 2018. The WTO believes it is imperative to resolve trade tensions or the consequences could be quite negative for the U.S. and the global economy. The WTO has gone on to say that “If we forget the fundamental importance of the rules-based trading system we would risk weakening it, which would be a historic mistake with repercussions for jobs, growth, and stability around the world.”
Trump’s contention that “trade wars are good, and easy to win” flies against a long history that suggests that they are destructive with no winners. History also suggests that a full-blown trade war leads to a full-blown shooting war. It might be worth recalling that the U.S. was born in a trade war. While it was over “taxation without representation” it was really about unfair trade between Britain and their American colonies. It sparked the American revolution in 1775. The infamous Smoot-Hawley Act of June 1930 helped trigger the Great Depression and contributed to global trade and economic tensions that led to WW2.
It is worth noting that, militarily, China and the U.S. are already in conflict given tensions in the South China Sea, the Straits of Taiwan, and, China’s military build-up. While it is not a shooting war the U.S. views China as their major adversary as China challenges U.S. global supremacy in economics, technology, and military. China’s “Belt and Road” is viewed as trying to reduce the U.S.’s influence globally and according to Pentagon documents it needs to be challenged. According to the U.S., the only acceptable status for China is as a lesser power. The trade war is merely one aspect of bringing China “down.” Unfortunately, there are many who believe it could lead to a real global shooting war centered between the U.S. and China/Russia.
There are no winners in trade wars. Probably the greatest trade war failure was the Smoot-Hawley Act of 1930. It led to nations striking out at each other with tit-for-tat tariffs. The tariffs ultimately slowed global trade and fueled the Great Depression. Enraged countries turned increasingly to Nationalistic rhetoric with each blaming the other for their troubles. They also attacked others in their countries, particularly Jews. Sound familiar? The trade war eventually turned into a real war—WW2. Following the war, the World Trade Organization (WTO) was formed to regulate international trade in the hope that nothing like the trade wars of the 1930s would ever happen again. The WTO has been under constant attack, particularly from the U.S., contributing to its potential growing irrelevancy.
History may not repeat itself exactly as it did in the past, but it does rhyme.
Markets and trends
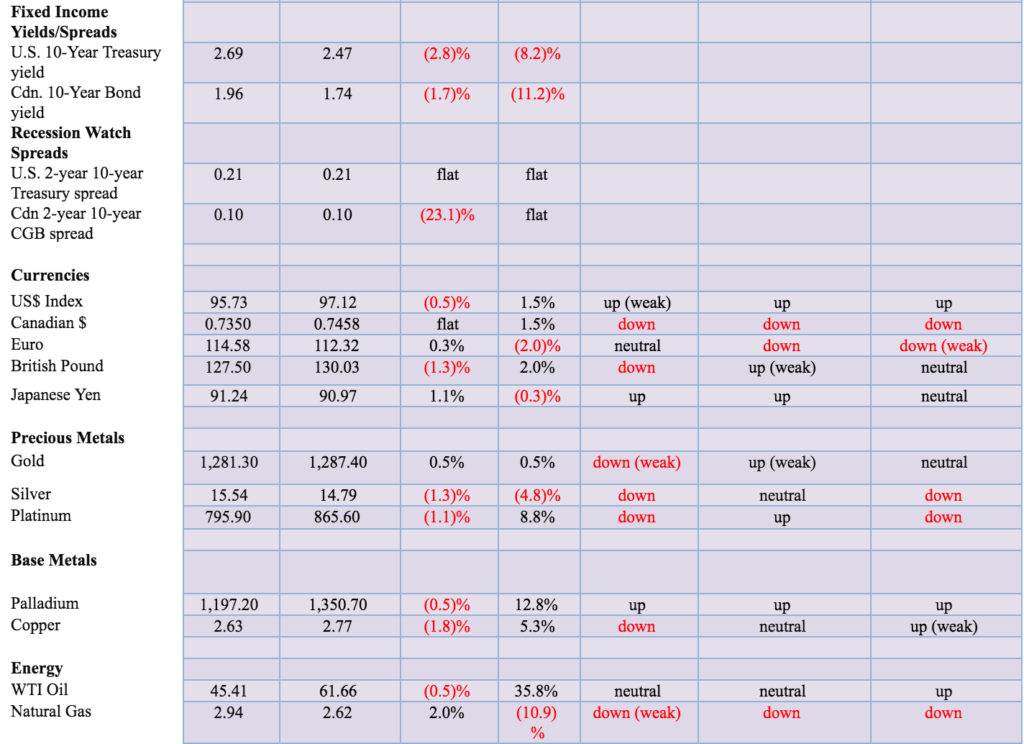
New highs/lows refer to new 52-week highs/lows. ©David Chapman
©David Chapman
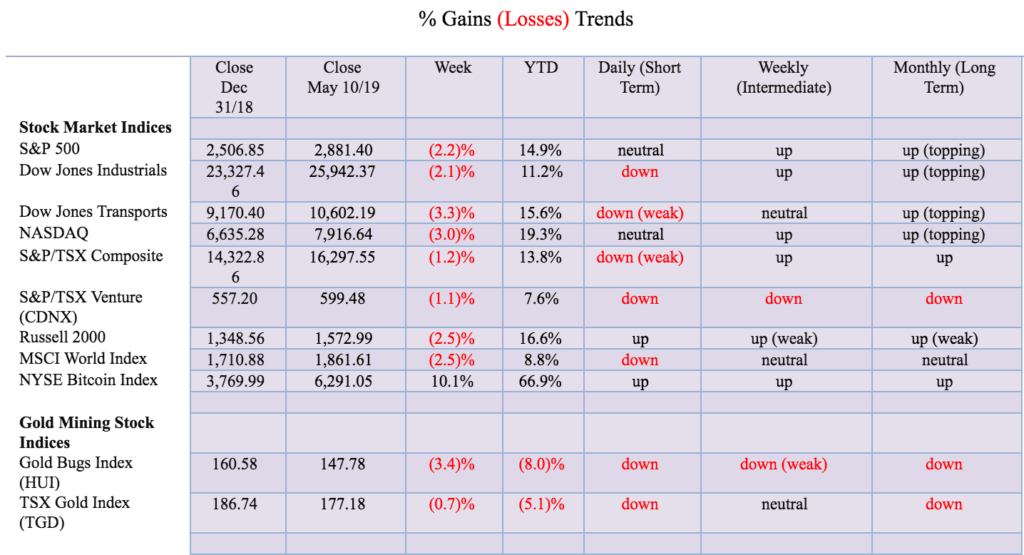
Thanks to President Trump and his tweets about additional tariffs on China, the market had its biggest swoon since the rally began in late December 2018. At one point on Friday, the S&P 500 was down 4.4% from the recent top but by the end of the day, it was only down 2.5%. On the week the markets dropped over 2% with the S&P 500 down 2.2%, the Dow Jones Industrials (DJI) off 2.1%, the Dow Jones Transportations (DJT) down 3.3%, while the NASDAQ fell 3.0%. The small-cap Russell 2000 dropped 2.5%. Other international markets fell as well. The London FTSE 100 dropped 1.5%, the Paris CAC 40 was off 3.8%, while the German DAX dropped 2.8%. In Asian markets China’s Shanghai Index (SSEC) was hurt by the negative tariff talk, falling 4.5% and Japan’s Tokyo Nikkei Dow (TKN) dropped 3.9%. The World MSCI Index fell 2.5%.
Friday’s action was strange. Or maybe not. Trump did announce the tariffs will take effect and predictably the markets fell, putting in new lows for the week. Then around 11 am Treasury Secretary Steve Mnuchin came out with soothing words that China and the U.S. were still talking and the talks were constructive. Then there was possibly the long arm of the PPT or the Plunge Protection Team entering the market and, lo, by the end of the day the loss of 360 points for the DJI turned into a gain of 114. It was certainly reminiscent of some of the action seen in late December at the bottom. Grant you, on its way down from October to December there was a period of back and forth consolidation in October and November before the markets made their final plunge.
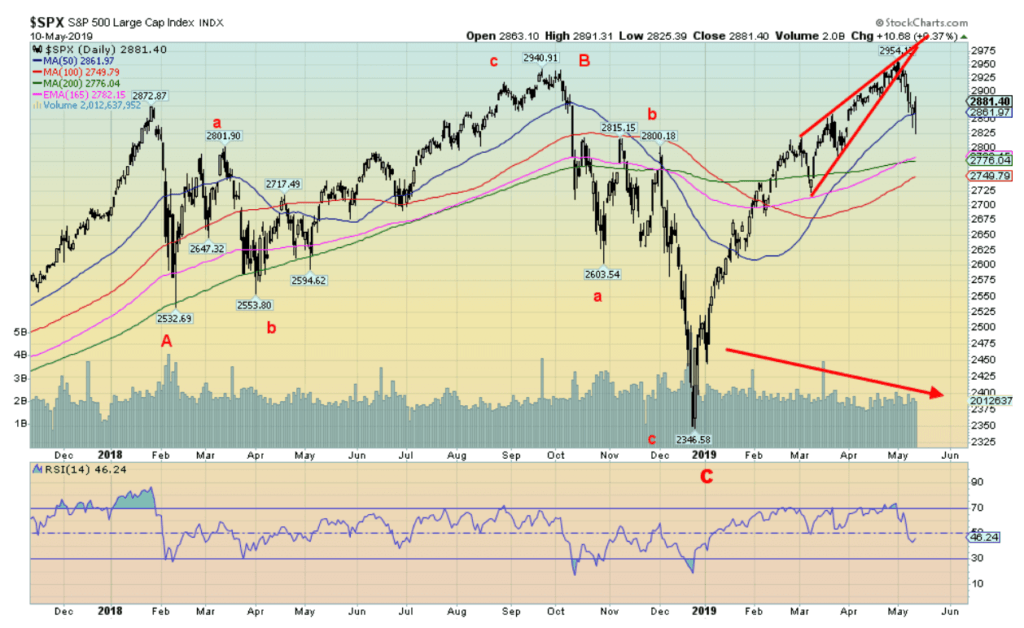
However, this is the first good correction since the rally got underway in December. So, it is unlikely we have seen the end of this rally just yet. What is tricky to discern is where we are in the wave count. What is unknown is whether this correction has more to come or whether Friday’s sudden reversal was it. Given May’s propensity for weak markets, it is possible that we rebound then plunge again before we find a foothold to rally from. Certainly, some of the indicators we follow, as noted below, remain positive and suggest higher prices. As well the markets got bearish in a hurry and that is usually not a good sign for the bears. Nonetheless, as my colleague Mike Ballanger suggested, markets that soar or swoon from tweets from politicians is not healthy markets. Follow-through to the upside will be important this coming week. We did test down to the 100-day MA for the DJI and the 50-day MA for the S&P 500, rebounding off those levels. Nonetheless, new lows below Friday’s low should send the S&P 500 to its next level near 2,775 or even 2,750. That level also fits with what appears to have been an ascending wedge triangle that formed on the S&P 500 from the lows in March 2019.
The S&P 500 doesn’t become dangerous until it drops under 2,700. We have seen this type of action from Trump in the past so it is possible the Chinese see these things for what they are. Nonetheless, if the Chinese do retaliate it will be to hit Trump’s heartland.
A note on sentiment. Sentiment did hit near extremes at the highs and the bullish sentiment has certainly backed off although it is nowhere near what one would call very bearish. But this is the third time in the past year and a half that the tariff bogeyman has been raised and each time after the markets were soothed with ongoing talks. The same pattern occurred during the NAFTA negotiations with Canada and Mexico so Trump’s tactics are not exactly unknown. Even if we return to the downside early this coming week, we expect we should find a low somewhere later in the month before another attempt at all-time highs. The caveat is if the markets break down under 2,700 then all bets are off.
Uber (UBER-NYSE) came to market this past week with the most anticipated IPO since Facebook (FB-NYSE). It fell flat on its face. The IPO came out at $45. By week’s end, Uber was down over 7% closing at $41.57. The day of the hot technology IPO it seems may be over as Uber became the worst performing IPO in U.S. stock market history. A sign of the times for the market as well?
©David Chapman
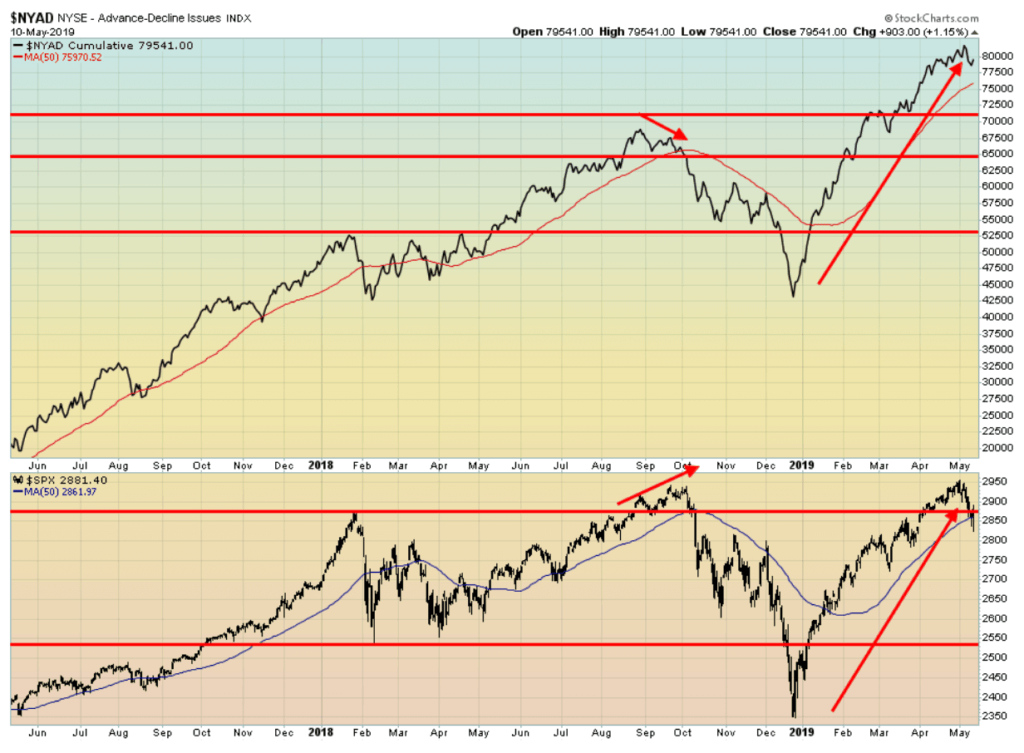
The NYSE advance-decline line is off its top, but the recent decline of the market did not drag it down very much. Any rebound now in the market is liable to take the NYSE advance-decline to new all-time highs and with it, the market should still go higher. The advance-decline line has been suggesting for some time now that the S&P 500 should make new all-time highs. It did, but barely. A divergence? Possibly, but usually, divergences are when the market makes new all-time highs but the advance-decline line does not. That’s what happened in 2018 at the top in September. That is not the case today. Odds favor a recovery and another move to all-time highs for the S&P 500.
©David Chapman
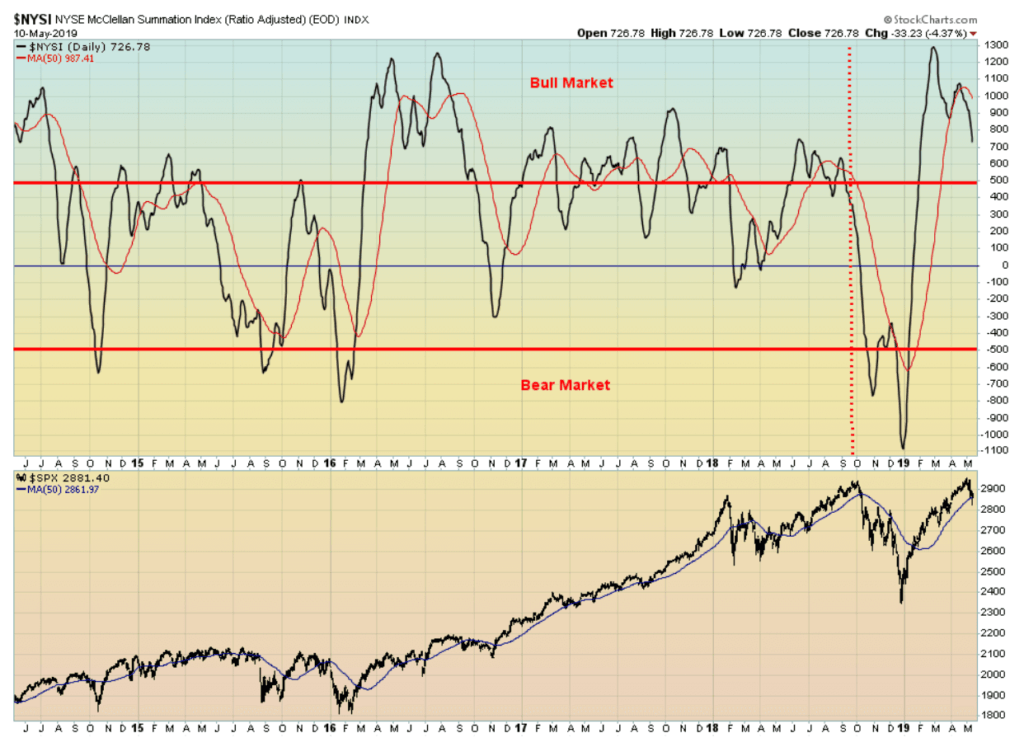
Where’s the bear? The McClellan Summation Index (ratio-adjusted), also known as the RASI, is, we believe, an excellent indicator for bull and bear markets. It is noteworthy that the RASI remains positive despite the recent drop in the market. When the market topped last September the RASI had already fallen below 500. On Friday it closed at 726. Our preference is to see readings below 500 at a major top. It is less sensitive at bottoms as the RASI and the market tend to bottom together as it did in December 2018. But currently, the RASI suggests there is sufficient liquidity in this market and odds favor another rise to the upside.
©David Chapman
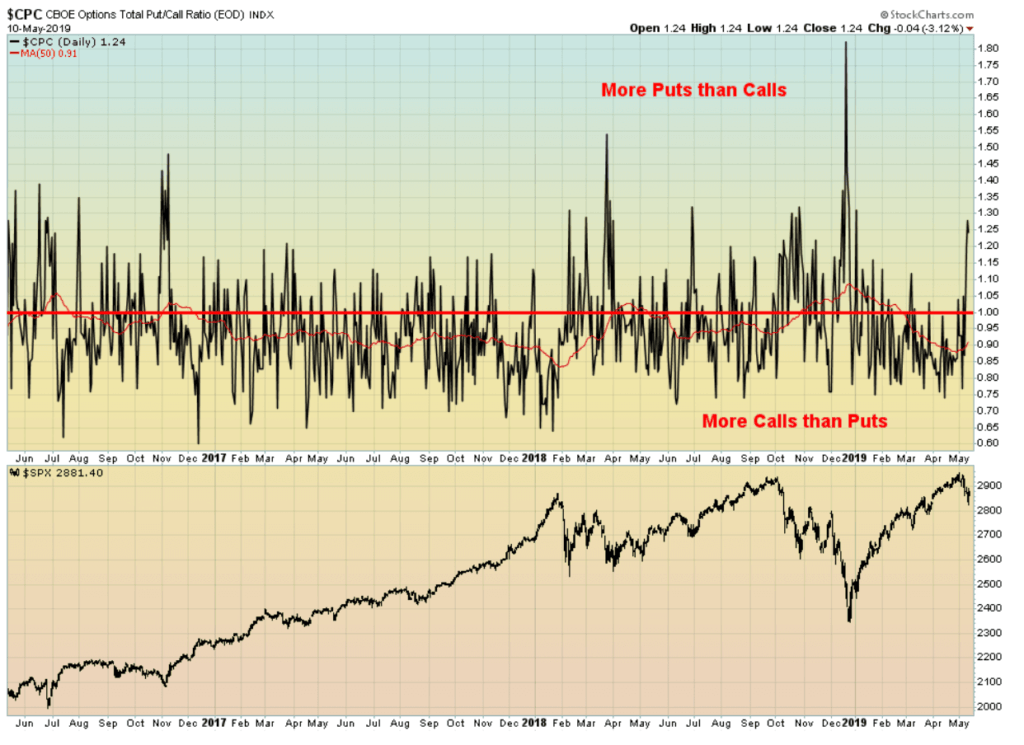
Here is another indicator of bearishness in the market. The CBOE put/call ratio this week was at 1.24. What that means is that the ratio favored puts over calls. Perfect balance would result in a put/call ratio of 1. So, anything over 1 suggests there are more puts outstanding than there are calls and the market is more bearish. Conversely, anything under 1 suggests the market is more bullish because there are more calls outstanding than puts. The put/call ratio acts as a contrarian indicator. When the put/call ratio becomes too high (too bearish) it suggests that the market is too bearish and a turn may be coming. It is the opposite when the market becomes too bullish with calls exceeding puts. At current levels, the put/call ratio is below previous highs, but it is at a level that has seen turns in the past, suggesting the market was becoming too bearish.
©David Chapman
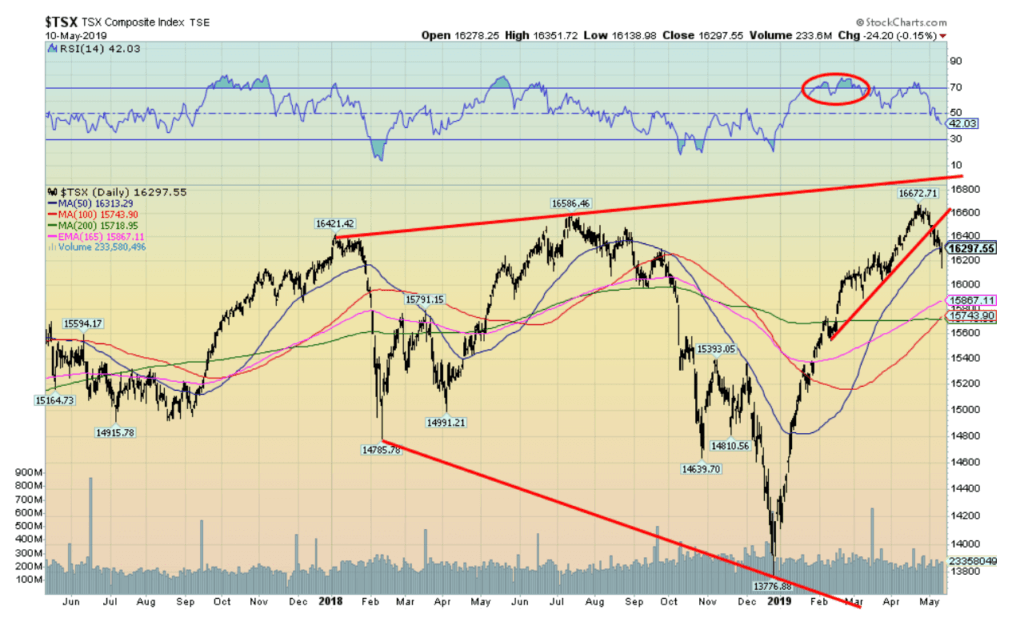
The TSX Composite suffered along with the U.S. markets this past week; however, its loss was only 1.2% vs. the 2% plus that most U.S. indices dropped. The TSX is down roughly 2.2% from its recent all-time high. Like many of the U.S. indices, the TSX found support in the 50-day MA range despite dipping under that level on Friday. The TSX rallied back 158 points from the lows on Friday to close the day off only 0.15%. We can’t tell yet whether this downdraft is over but a re-test of the recent highs now would not be a surprise. Another break under 16,200 could see the TSX Composite fall to the 15,700/16,000 range. This is the first good correction since the lows in December. It was overdue. As with the U.S. indices, it is not likely a final top as there is still no sign of a top. Usually, the first break doesn’t result in the markets going straight back down again. Volume has remained sub-par. There could be an attempt at forming some sort of broadening top but that remains to be seen. Usually, these form a five-point pattern. The top was seen back in December 2017 with the A wave down. The A wave bottomed near 14,700 in February. The B wave topped in July 2018 at a slightly higher level near 16,500. The C wave low was the December 2018 low near 13,700. We are now working on the D wave that could still reach 17,000. The E wave down would follow.
Canada employment change
©David Chapman
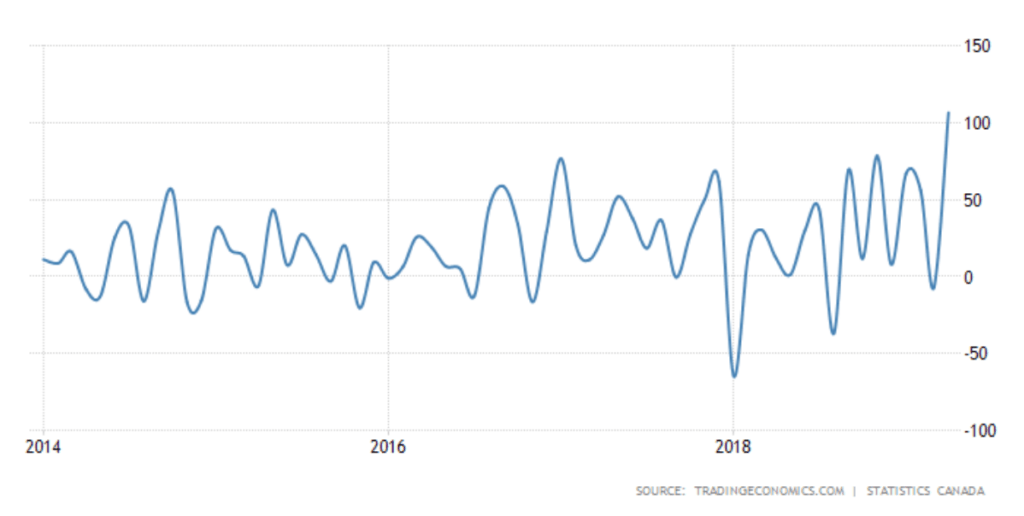
It was a “wow” moment for the Canadian jobs market in April. The Canadian economy added a record 106,500 jobs in April after shedding 7,200 in March. Both full-time and part-time hiring leaped with full-time jobs up 73,000 and part-time jobs up 33,500. Ontario and Quebec were the major beneficiaries with Ontario up 47,000 and Quebec up 38,000. Alberta gained 21,000 and little PEI was up 800. Most of the other provinces saw little change. Retail, construction, information technology, culture and recreation, agriculture, and public administration saw gains. Both private and public sectors saw job gains with private sector gains outpacing public sector gains almost 4:1. The unemployment rate fell as well, down to 5.7% from 5.8%. And that was despite a gain in the labor force participation rate rising to 65.9% from 65.7%. A rise in the LFPR tends to increase the unemployment rate, but instead, the unemployment rate fell despite more people employed or seeking employment. There is little sign, however, that the additional jump in jobs and lower unemployment rate are pushing up wages which, for the most part, remain rather stagnant. But the number was gangbusters and a surprise and ought to get some politicians crowing. The Canadian dollar benefitted from the strong jobs number and rallied back.
©David Chapman
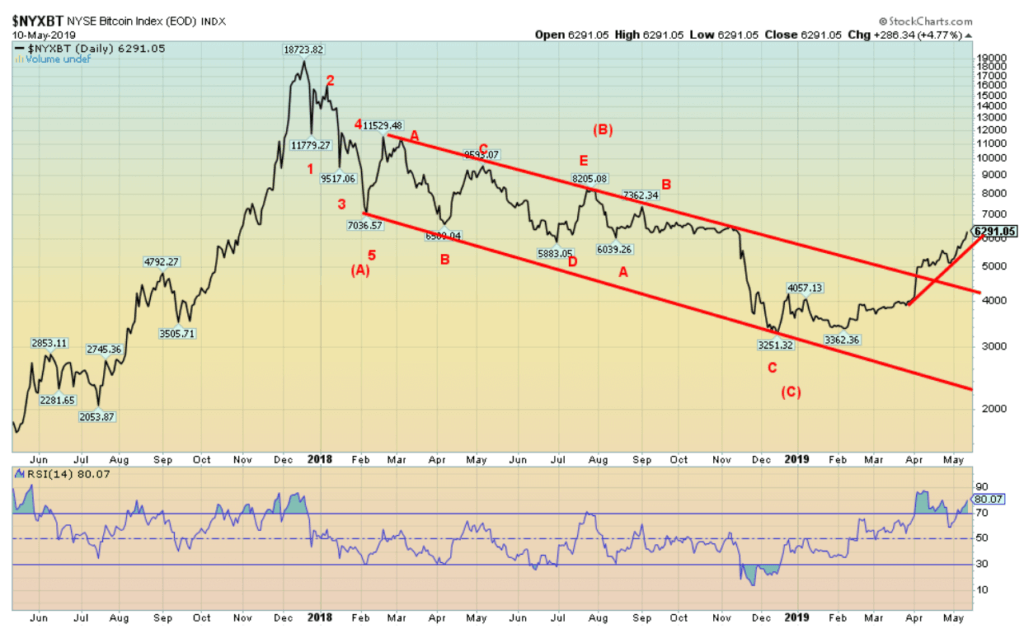
Hot, hot, hot. How else to describe Bitcoin and the cryptocurrencies of late. Bitcoin leaped another 10.1% this past week to over $6,000 and is now up almost 67% in 2019. With further gains this weekend, Bitcoin is approaching $7,000. Yet there still appears to be little explanation as to what is driving this. This past week it was reported that hackers stole some 7,000 Bitcoins with a value of $40.7 million (at the time). Could it be that less supply helped push the price of Bitcoin higher? Nonetheless, it is no surprise that we are now seeing all sorts of forecasts that the new crypto bull is here and we are off to $20,000 once again. The market cap of all the cryptos has returned over $200 billion (current $210 billion) with Bitcoin alone at $122.6 billion constituting 58% of the market. We now have 14 cryptos with a market cap of over $1 billion up from 12 a week ago. And finally, there are 2,169 cryptos listed at Coin Market Cap. Still seems like an incredible number of cryptos and they can’t all survive. The uptrend breaks at $6,000 and that could send Bitcoin back down towards $5,000. The RSI is almost constantly over 70 which suggests that Bitcoin is overbought. But in a strong bull, these states can stay that way longer than shorts can stay solvent. Given the recent hack, one has to wonder why anyone would get involved in this market. Clearly, all of the issues have not yet been resolved, let alone regulatory issues.
©David Chapman
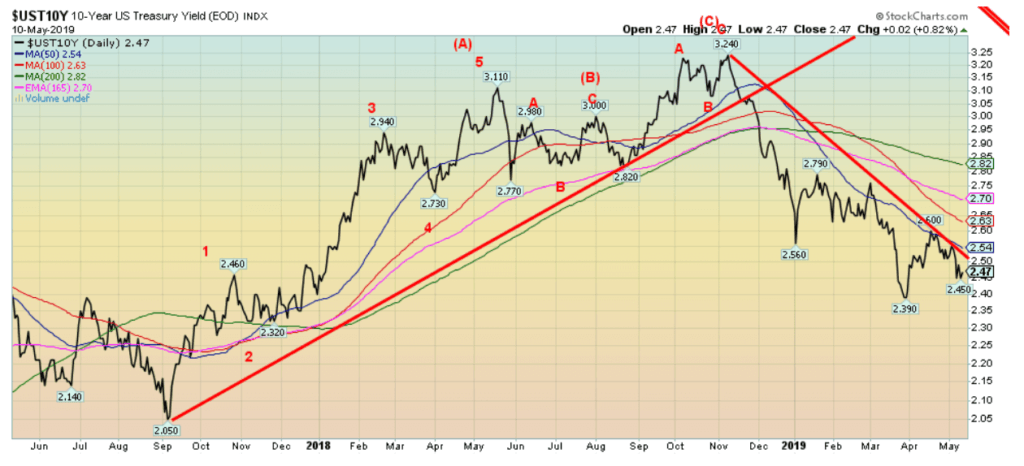
Bond yields are ambling about right now, giving us little sense of direction. It was noteworthy that the 50-day MA stopped the recent rise in yields at a high of 2.60%. Since then, the 10-year U.S. Treasury note has been consolidating below the 50-day MA, currently at 2.47% down from 2.54% the previous week. There is little clue emanating from the commercial COT either as it was last at 53%, up marginally from the previous week. At best we could describe it as mildly bullish. Back in October at the highs of 3.24% the commercial COT was over 60% and considered quite bullish. The result is we could see a mild back up in yields are another small rally in yields but no strong move one way or the other. New lows below 2.39% would suggest a decline to around 2.20% whereas a breakout above 2.55% and especially above 2.60% could suggest a rise to 2.70%.
Recession watch spread
©David Chapman
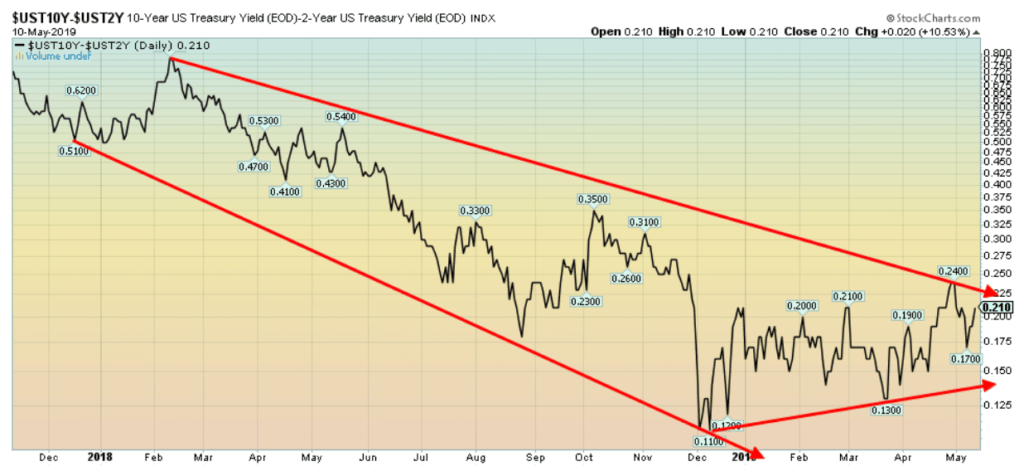
The recession watch spread of the 10-year U.S. Treasury note less the 2-year U.S. Treasury note was unchanged this past week at 21 bp. There is no suggestion of an impending recession from this spread. As we have noted in the past, not only does the spread have to turn negative but it usually remains that way for up to six months before any recession actually shows up. Any suggestion that the U.S. is on the verge of recession is, at this time anyway, just hype.
©David Chapman
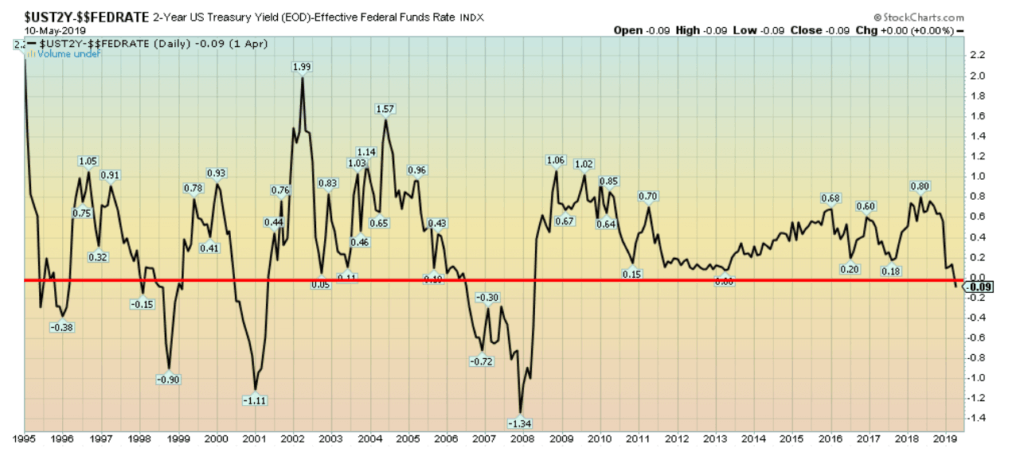
Some got excited about the 2-year U.S. Treasury note less the Fed Funds (FF) rate turning negative this past week. The cry once again was that the U.S. is on the verge of a recession. Nothing could be further from the truth. Yes, the 2-year FF spread did turn negative but that doesn’t mean a recession is starting anytime soon. We focus more on the 10-year—2-year spread as a harbinger of a recession. Note that the 2-year FF spread fell to negative 90 bp back in 1998 yet there was no recession. It also went negative in 1996 and, once again, there was no recession. So, while we monitor these things, we want to see far more evidence before we jump to any conclusions about the potential for a recession.
©David Chapman
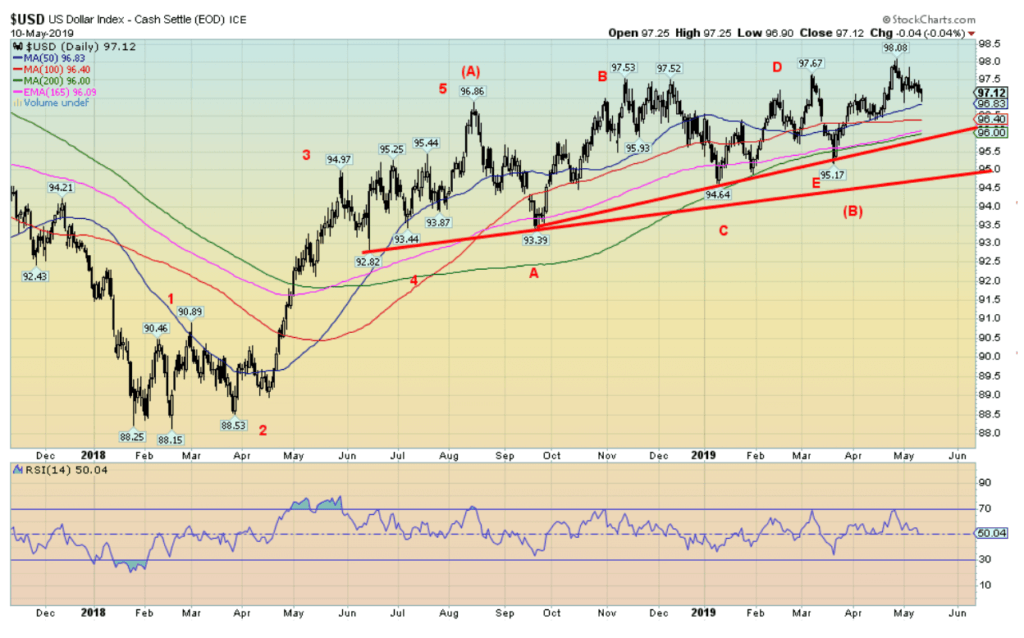
The US$ Index continues to suggest that higher prices lie ahead. This past week, because of the trade gyrations with China, the US$ Index fell 0.5%. The euro rose 0.3%; however, the luster came off the pound as it fell 1.3%. The Japanese yen rose 1.1% while the Canadian dollar was flat on the week having rallied back to unchanged following the gangbusters job numbers released on Friday. We see the current pullback in the US$ Index as merely a correction within the context of the rise. The large ABCDE-type pattern that formed over the past year and a half appears as an ascending triangle with potential targets up to 101.70. Further potential exists up to 102.40. Minimum objectives could be up to 100.30. The high so far is 98.08. There is good support down to 96.80, but below that level a decline to 96.40 is possible. We would view a decline under 96.40 as negative as it could suggest that the bullish pattern is negated. The US$ Index breaks down under 96 and especially under 95.
©David Chapman
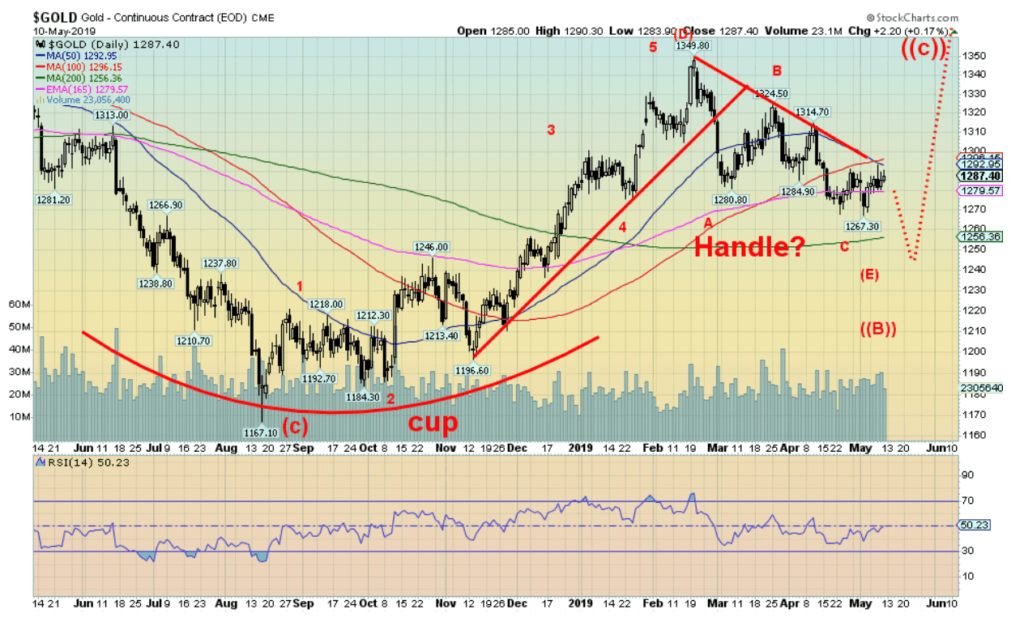
As trade worries dominated the markets this past week, gold benefited, rising about $6 or 0.5% on the week. It was, however, a pretty muted rise all things considered. Silver, as we note, fell 1.3% while platinum fell 1.1%. Palladium was off 0.5%. All in all, with the exception of gold it was not a good week for the precious metals. Gold continues to work on what we believe is an E wave of a larger ABCDE-type pattern that got underway with the top in July 2016 at $1,377. Since then, gold has been on a roller coaster ride but has failed at all attempts to take out that level. The major low was seen in December 2015 at $1,045. Following the high in July 2016 gold found a low in December 2016 at $1,124 (A wave), followed by another run to the upside, topping in May 2018 at $1,369 (B wave). What followed was another decline to a low in July 2018 at $1,167 (C wave) and another run to the upside topping in January 2019 at $1,350 (D wave). The current wave down (E wave) should complete the pattern. Our projected low is $1,235 to $1,250. Only a major breakdown under $1,200 would change our current thoughts. Once this wave is completed gold should embark on a strong rally that should carry it past $1,400. The cup and handle pattern that appears to be forming breaks out above $1,350 and projects up to at least $1,550. A potentially larger multi-year pattern that has been forming over the past seven years also breaks out over $1,350 and has potential up to about $1,750. Either way we look at it, we believe that gold is approaching the end of its down cycle that has been in place since the top was seen in September 2011 at over $1,900. Seasonals don’t really turn positive until July, but we have in the past seen significant lows in May or June. Given our thoughts that the US$ Index has further to rise, that ought to be a negative for gold going forward.
©David Chapman
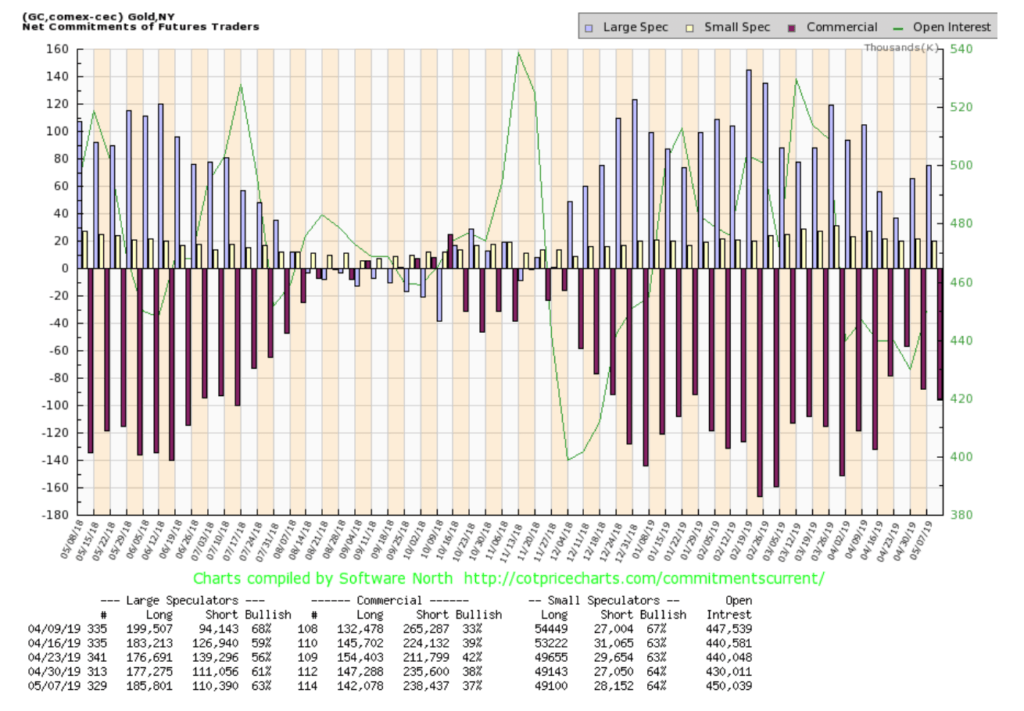
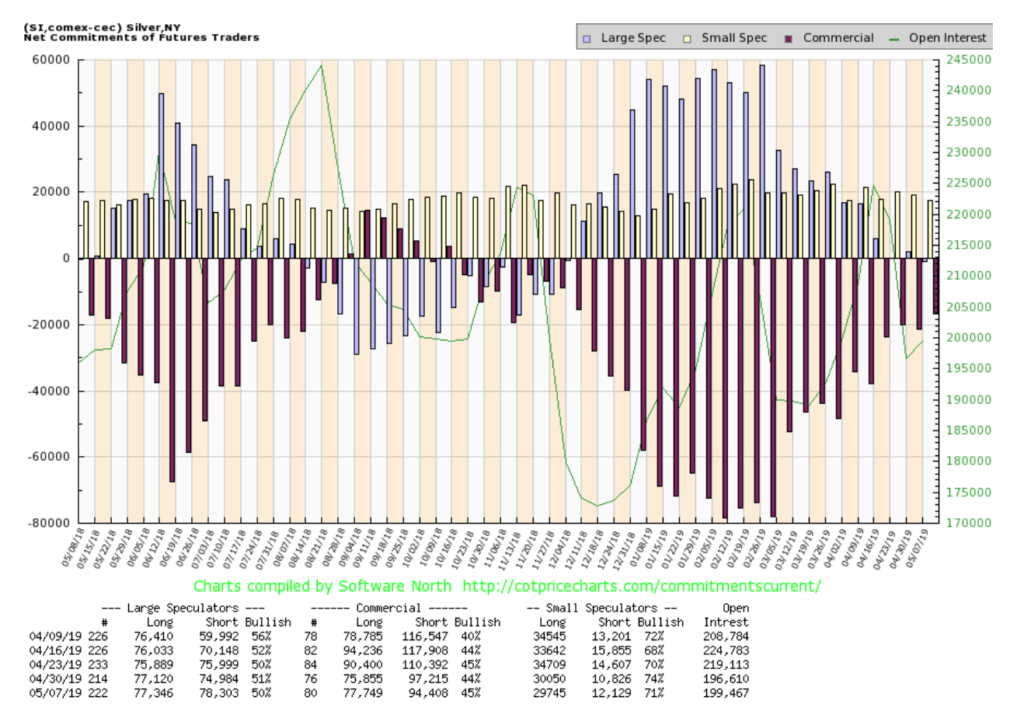
The commercial COT for gold slipped this past week to 37% from 38% the previous week. Long open interest fell by just over 5,000 contracts while short open interest rose about 3,000 contracts. The large speculators COT (hedge funds, managed futures, etc.) rose to 63% from 61%. Long open interest rose roughly 2,500 contracts while short open interest fell under 1,000 contracts. What the COT seems to be telling us is that gold is not yet ready to rally in any sustainable manner. Our preference is to see the commercial COT up towards 50%. This might be achievable if gold does fall to our preferred targets down near $1,235 to $1,250.
©David Chapman
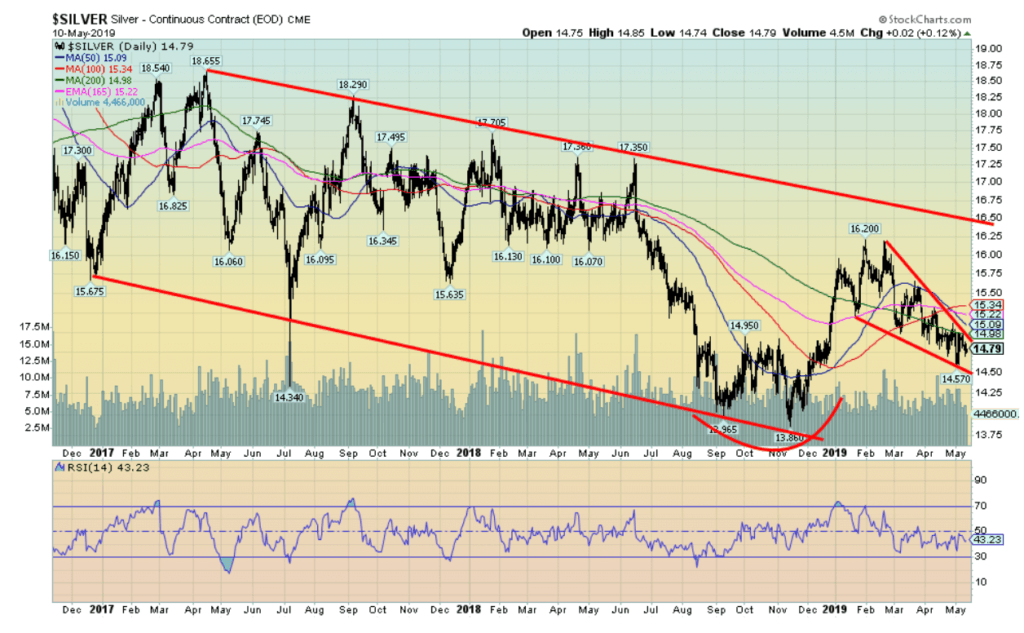
Silver fell 1.3% this past week as prices slipped by 19 cents. This is interesting in that silver was down on the week while gold rose on the week. Our preference has always been that silver lead. Silver’s weakness confirms to us that gold and silver are not yet ready to rally. Silver is not quite exhibiting the cup and handle pattern that gold and the gold stocks are. However, one could argue that there is one there as well. What is clear is that silver appears to be falling in a descending wedge triangle. The breakout point is currently around $15 and suggests at a minimum that silver would rise once again to the recent high of $16.20. It is possible that on any future plunge in gold that gold sees new lows but silver does not. The recent low was at $14.57. In theory, silver breaks down under $14.50 but the current pattern does not suggest that will happen. The awkward looking cup and handle pattern does project up to around $19.70 once new highs are seen above $16.20. Key resistance is up around $16.50 so that level must fall as well.
©David Chapman
The silver commercial COT rose to 45% this past week from 44% the previous week. Long open interest improved by roughly 2,000 contracts while short open interest fell almost 3,000 contracts. The silver commercial COT continues to improve and is bullish. However, it has not reached what we might consider peak bullishness at 50% or higher. The large speculators COT fell to 50% from 51% as they added about 4,000 contracts to short open interest.
©David Chapman
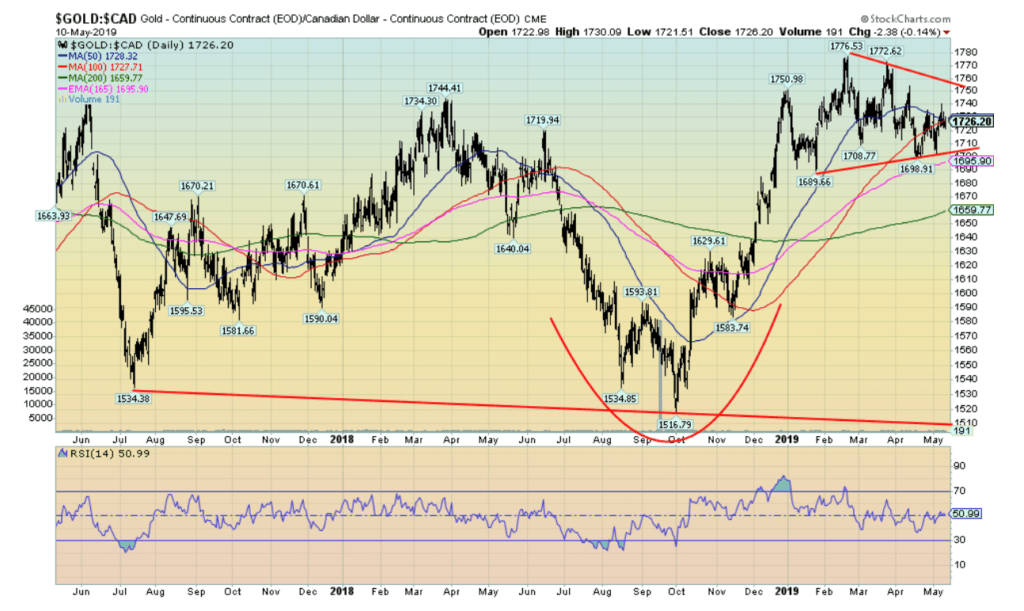
A reminder that since the major low in gold in December 2015 gold in other currencies has tended to outperform gold in U.S. dollars. That is primarily because the U.S. dollar has been strong over the past several years. Since the major low in U.S. dollars gold is up about 23%. But in Canadian dollars gold is up almost 39% from its low that was seen in 2013, over two years before the low in U.S. dollars. Like gold in U.S. dollars, gold in Canadian dollars appears to be forming a large cup and handle pattern. It continues to work on the handle. There might be another low here near $1,700 but that should be it. The handle is forming a symmetrical triangle that breaks out above $1,750 and potentially projects up to at least $1,835 to $1,850. The larger cup and handle pattern breaks out over $1,800 and potentially projects up to over $2,000. No matter how we look at this chart we see considerable upside potential.
©David Chapman
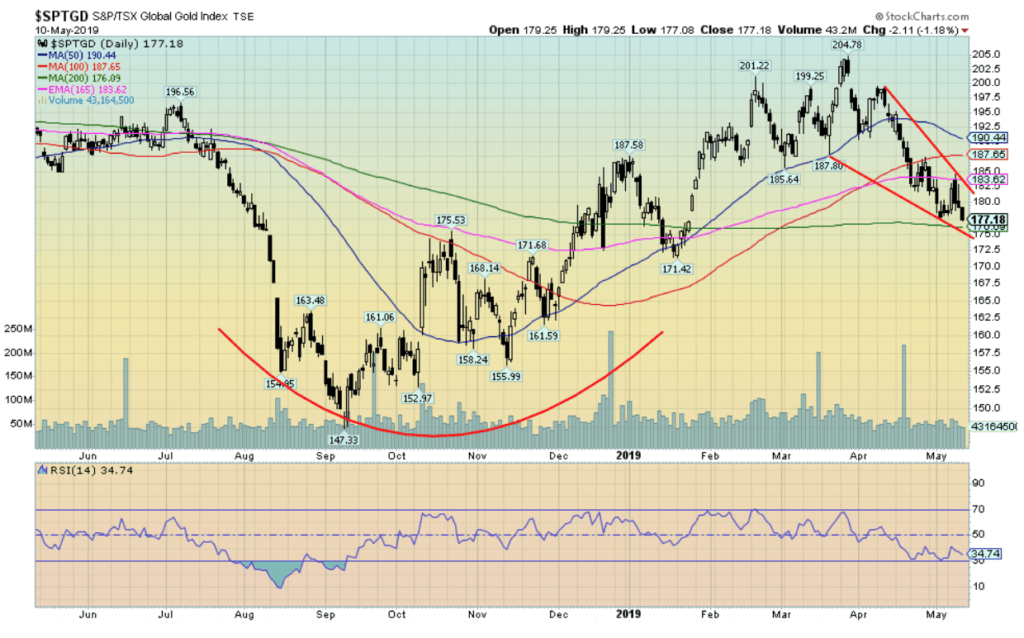
Once again it was a poor week for the gold stocks. The TSX Gold Index (TGD) fell 0.7% and the Gold Bugs Index (HUI) was hit even harder falling 3.4%. That could be construed as a divergence between the two major gold stock indices; however, both did see new lows for the current decline. The good news is, so far at least, the TGD continues to hold the 200-day MA (currently at 176). However, even a slight break under the line is not the end of the world as a test of the 200-day MA usually sees a test under the line. The TGD has now achieved the targets that were anticipated once it broke under 195. There would not be a concern that the gold stocks were in deeper trouble until the TGD broke under 171. A number of gold stocks did see new 52- week lows this past week even as at the same time quite a number of them are holding up quite well. There is considerable resistance up to 190, but above 198 new highs above 205 are probable. We can’t rule out further lows, but if the descending wedge triangle is correct then the TGD should find support at these levels. We are not sure what sparked the gold stocks lower this past week given that gold was up on the week. In all probability, they were pushed lower in sympathy with the broader stock market.
©David Chapman
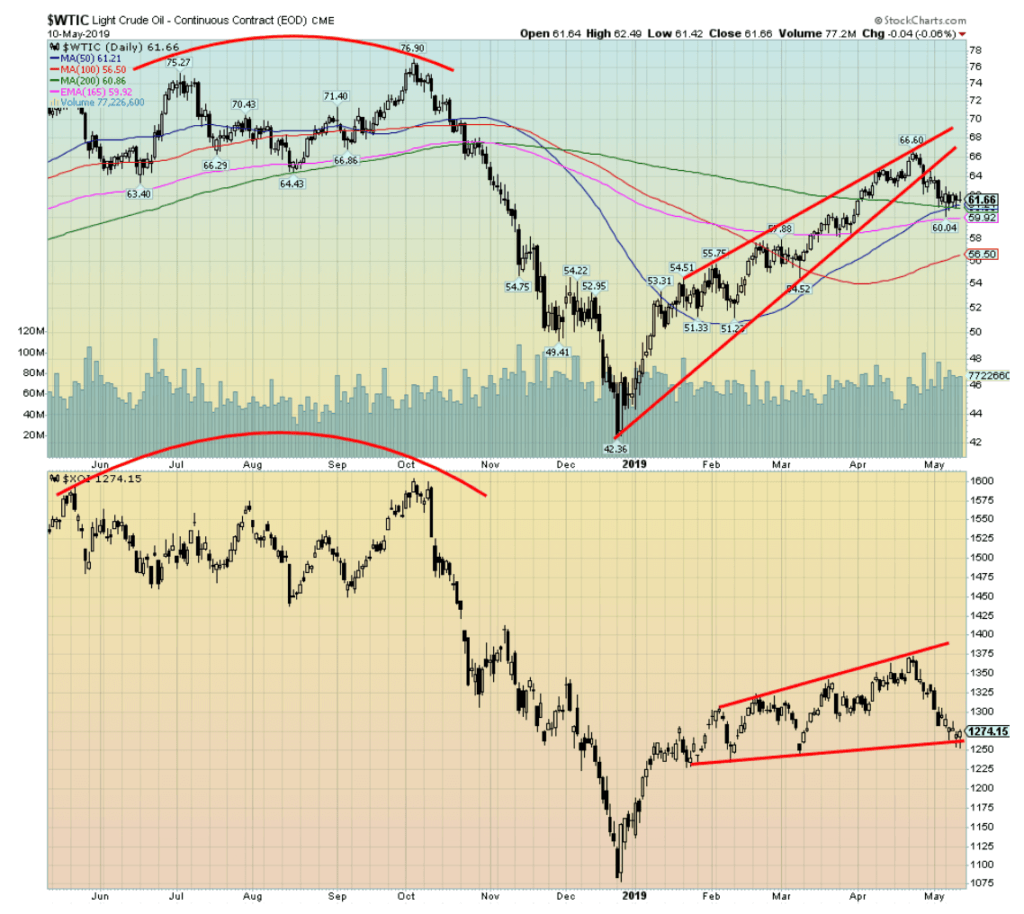
It was a pretty dull week for WTI oil as the price barely moved, falling a small 0.5%. Seems that geopolitical tensions in the Persian Gulf and Venezuela are not carrying much cachet as the market basically yawned this past week. Prices seem to be holding just above $60 so any drop below that level would suggest a decline to at least $56. On the other hand, a move back above $64 would suggest the potential to move back towards $70. WTI oil appears to have fallen out of a rising or an ascending wedge triangle. If that is correct, then WTI oil could fall all the way back towards the December 2018 low near $42. That wouldn’t please either Saudi Arabia or Russia, both of whom want (need?) higher oil prices. The shale oil industry along with Canada’s oil sands also need higher oil prices, largely because of the high expenses associated with these activities. So, we find it difficult to believe that both Saudi Arabia and Russia would openly encourage lower oil prices. Clearly, if tensions ease particularly in the mid-East, that should encourage oil prices lower. Venezuela is less of a factor because they had been in reduced production for some time. But Iran sanctions have the potential to squeeze supplies, thus putting upward pressure on oil prices. The energy stocks were down this past week along with the stock market. The U.S. Oil & Gas Index (XOI) fell 1.7% while Canada’s TSX Energy Index (TEN) was down 0.4%. As the chart above of the XOI would appear to suggest, either the XOI is going to rally here or it is going to break down. A firm breakdown under 1,250 for the XOI would suggest a decline to 1,100. Both WTI oil and the XOI appear bearish. Seasonals may also play a factor as the positive season for oil and the energy stocks tend to be December to July. But it can end early. The summer driving season is approaching and that tends to boost both oil and the stocks. But it may be a bounce-back rather than a run to new highs.
Chart of the week
©David Chapman
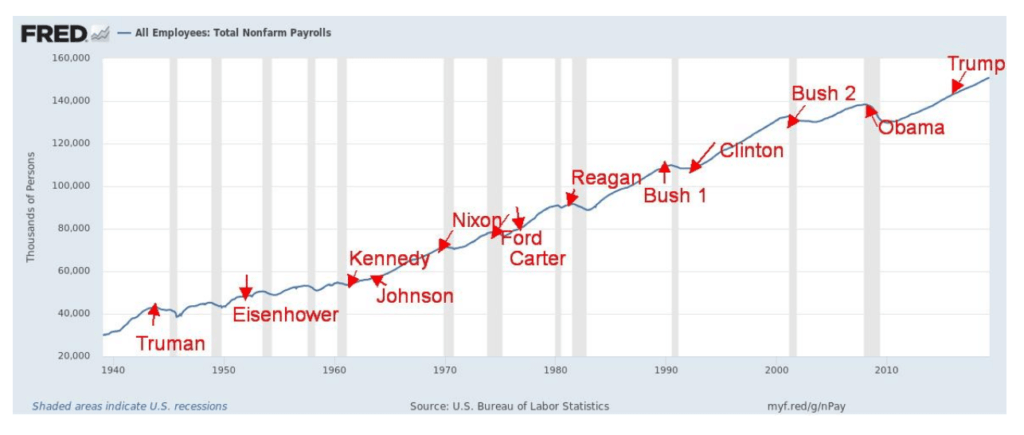
Trump said that “I will be the greatest job president that God ever created.” Well, he might want to reconsider that statement. But he probably won’t. Since the start of Trump’s presidency, some 5,652,000 jobs have been added. Sounds great, no? While, overall, nonfarm payroll employees have increased by 3.9% since the start of Trump’s presidency the monthly rate of increase is sub-par at 0.139%. He can crow that’s better than Barack Obama whose monthly rate of increase was only 0.082%, but then Obama had to deal with the after-effects of the Great Recession, a recession that is actually attributed to George W. Bush’s (Bush 2) presidency and not to Obama.
One could argue that the greatest job-creating president was Bill Clinton who saw 23,223,000 new jobs created during his presidency. That was a 21.2% increase and a monthly increase of 0.221%. If the monthly increase is considered the major measurement of job creation, then the winner was Lyndon Johnson at a rate of 0.337%. During his presidency, 11,965,000 jobs were created.
Those were the job creation winners. The losers? It was almost no contest as only 2,135,000 new jobs were created during the presidency of George W. Bush (Bush 2). His increase was also the smallest at 1.7% and his average monthly increase was also the smallest at 0.017%. Alas, poor George.
There were some interesting results that came out of looking at job creation by presidents. Based on the statistics provided by our table, one would tend to want Democrat presidents over Republican presidents. Under Democrat presidents, 11,233,000 jobs were created on average vs. only 6,033,000 for Republican presidents. That translated into a gain of 14.7% for Democrat presidents vs. only 7.2% for Republican presidents. Average monthly gains were better as well, with Democrat presidents producing an average monthly gain of 0.211% vs. only 0.110% for Republican presidents. Trump is only marginally above the average.
Finally, recessions seem to be associated with Republican presidents. Since 1945, under Republican presidents, there have been 9 recessions averaging 11.7 months. Under Democrat presidents, there have only been 3 recessions averaging 8.3 months. Democrat Presidents Kennedy, Johnson, Clinton, and Obama saw no recessions during their presidency, although Obama came in at the tail end of the Great Recession 2007–2009 and had to deal with its aftermath. President Ford and, so far, President Trump are the only Republicans that saw no recessions. But Trump’s claim to being the greatest job-creating president ever is merely a boast with no substance.
—
DISCLAIMER: David Chapman is not a registered advisory service and is not an exempt market dealer (EMD). We do not and cannot give individualized market advice. The information in this article is intended only for informational and educational purposes. It should not be considered a solicitation of an offer or sale of any security. The reader assumes all risk when trading in securities and David Chapman advises consulting a licensed professional financial advisor before proceeding with any trade or idea presented in this article. We share our ideas and opinions for informational and educational purposes only and expect the reader to perform due diligence before considering a position in any security. That includes consulting with your own licensed professional financial advisor.


Bitcoin Stalls Near $60K as Strategy Moves, ETFs Outflow, and EU MiCA Rules Take Effect
Bitcoin hovers near $60,000 with ETF outflows, while Strategy boosts reserves, sells BTC, and raises dividends to reassure investors. Ethereum...


Cannabis Dominates Global Drug Use: Trends, Risks, and Shifting Markets
Cannabis remains the world’s most widely used illicit drug, with 256 million users in 2024, surpassing all others combined. Growth...


Italy Approves First Hydrogen-Powered Train for National Rail Network
ANSFISA has approved Italy’s first hydrogen-powered train, the Alstom HMU214, for use on the Brescia–Iseo–Edolo line. Capable of 140 km/h,...


Cotton Market Weakness Persists Despite Brief Rebound
Cotton prices fell to new lows last week before a modest rebound. USDA data shows crop conditions remain worse than...


Eli Lilly Hits $1 Trillion Valuation Amid Strong Bullish Momentum
Eli Lilly stock hit a record high, surpassing $1 trillion market value after strong product demand. Shares surged over 7%,...
 |
|
 |  |
 |
|
-

 Impact Investing2 weeks ago
AI Adoption in Italian Retail Stalls Despite Strong Experimentation
-
 Cannabis19 hours ago
Cannabis Dominates Global Drug Use: Trends, Risks, and Shifting Markets
-

 Impact Investing7 days ago
EU Weighs More Free Emission Permits in ETS Review to Boost Industry Competitiveness
-

 Impact Investing2 weeks ago
SBTi Net-Zero Standard 2.0 Enhances Corporate Climate Action