Featured
Markets Were Mixed This Past Week with Some Up and Some Down
A big week coming up with the FOMC May 2-3 and the expected 25 bp hike with a pause. Friday brings us the April job numbers and they are expected to be somewhat weaker. We cover considerable ground this week with focuses on the potential demise of First Republic Bank, the mixed signals of the Purchasing Managers Index (PMI), consumer confidence, earnings, inflation, and recession.
Nothing like a dramatic drop in price to catch one’s attention. Yes, First Republic Bank of San Francisco (FRC/NYSE) has suffered a dramatic 97.5% decline since that top on February 2nd, 2023. That’s a market cap hit of roughly $25.5 billion. Surprisingly, they still have a market cap of some $0.6 billion. It has been a two-stage drop. First, when the collapse of SVB Bank and Signature Bank was revealed and, second, when it was thought that FRC is next. All this came about when it was revealed that FRC had lost some $100 billion in deposits as nervous depositors pulled their funds out. Right now, it appears that FRC could be headed for zero and bankruptcy. Then the Fed has another problem on its hands.
First Republic Bank of San Francisco
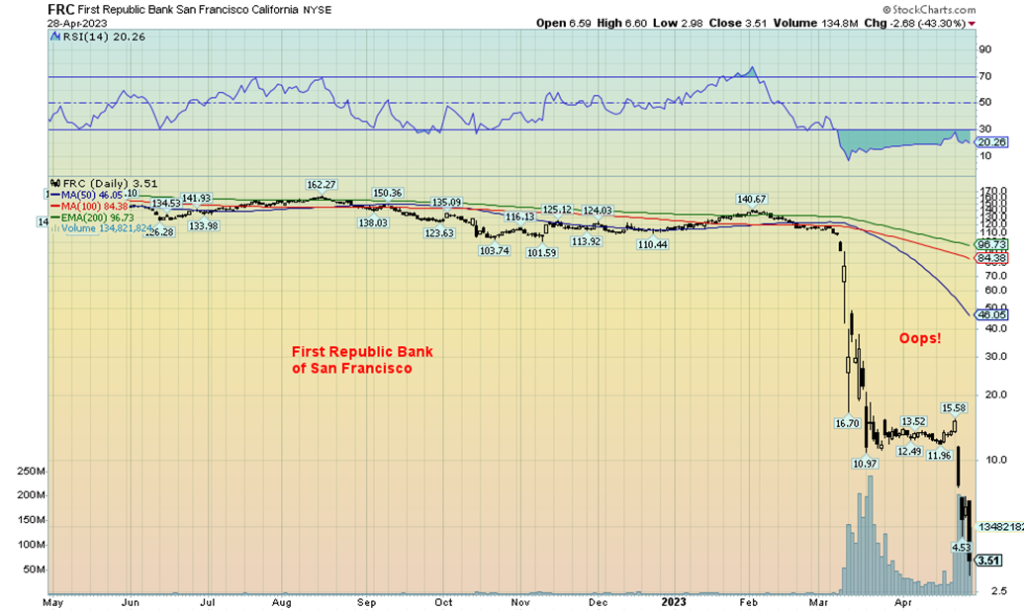
Bank regulators and the Fed are trying to find a buyer for FRC to take the problem off their hands. All this is to try and prevent any major meltdown in the banking sector. So far, the reception has been lukewarm. Hence, further declines for FRC. Will FRC join SVB and Signature Bank in bankruptcy? The Fed and regulators are trying to prevent contagion. Are there potentially more banks in trouble out there? Will FRC be taken over in what amounts to a shotgun wedding ala Credit Suisse? None of this would be surprising.
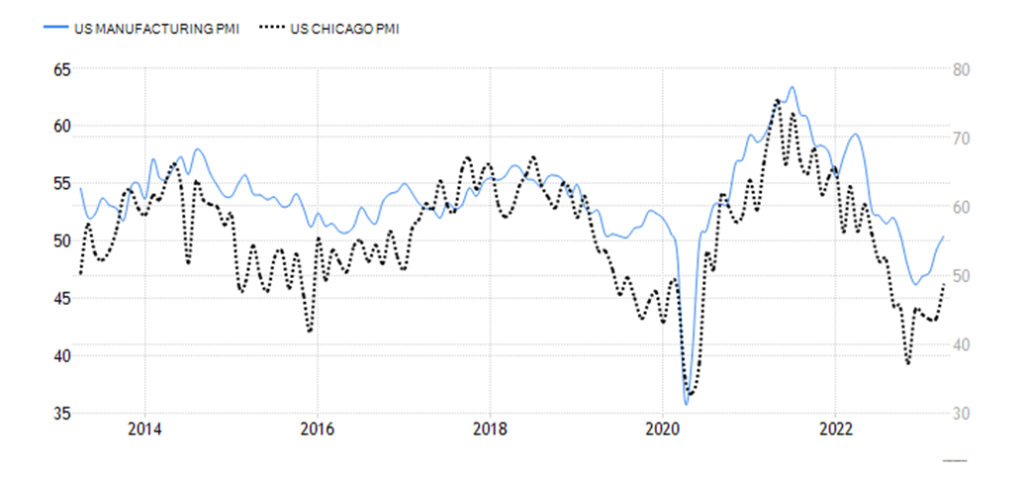
The market continues to give off mixed signals. Take the latest purchasing managers’ indices (PMI). The S&P Global Manufacturing PMI registered a reading of 50.4 for April 2023. That was up from 49.2 in March. A reading below 50 indicates recessionary conditions while above 50 represents expansion. The Chicago PMI for March was 48.6 a big improvement from the previous 43.8 but still in recessionary conditions. The market had expected only 43.5. Mixed signals.
US Manufacturing PMI and Chicago PMI 2013–2023
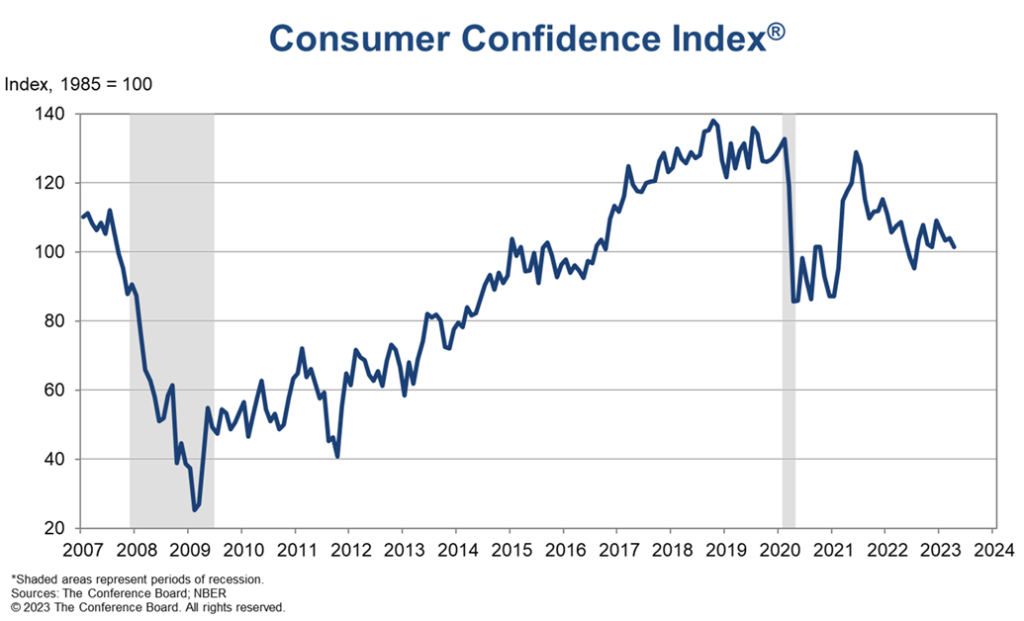
Consumer confidence is still lagging as the latest Conference Board Consumer Confidence fell to 101.3 in April from 104 in March. We remain well above the depths seen during the 2007–2009 Great Recession and just above the lows of the 2020 pandemic recession. Still, that is translating into falling house sales and dwindling retail sales. Yet we have no official recession. Layoffs have been announced by a number of companies. But will it push unemployment to rise?
Conference Board Consumer Confidence Index 2007–2023
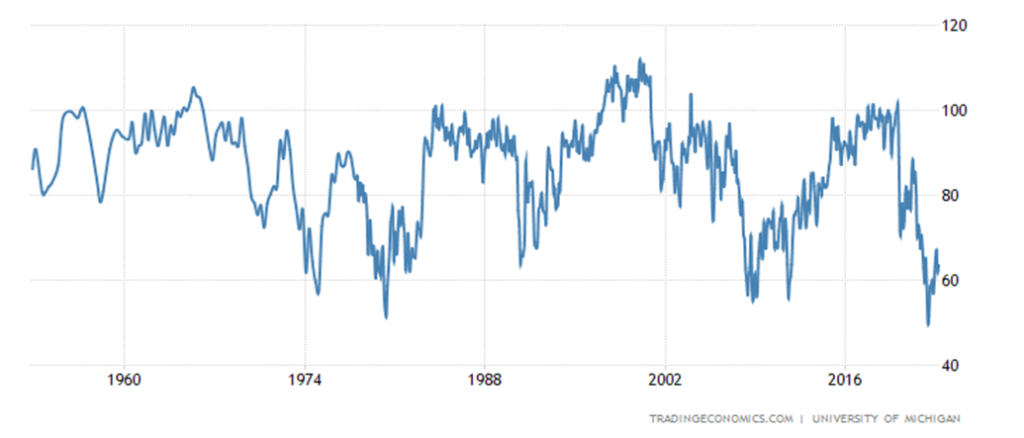
Then out came the final March 2023 Michigan Consumer Sentiment survey and it remains at multi-year lows. The reading was 63.5, which was better than February’s 62 but came in as expected. The Michigan Consumer Expectations was 60.5—that was better than the 59.2 in February but below the expected 61.8. Consumer sentiment remains down around where it was during the 1980–1982 recession and the 2007–2009 Great Recession. And we haven’t even had an official recession yet.
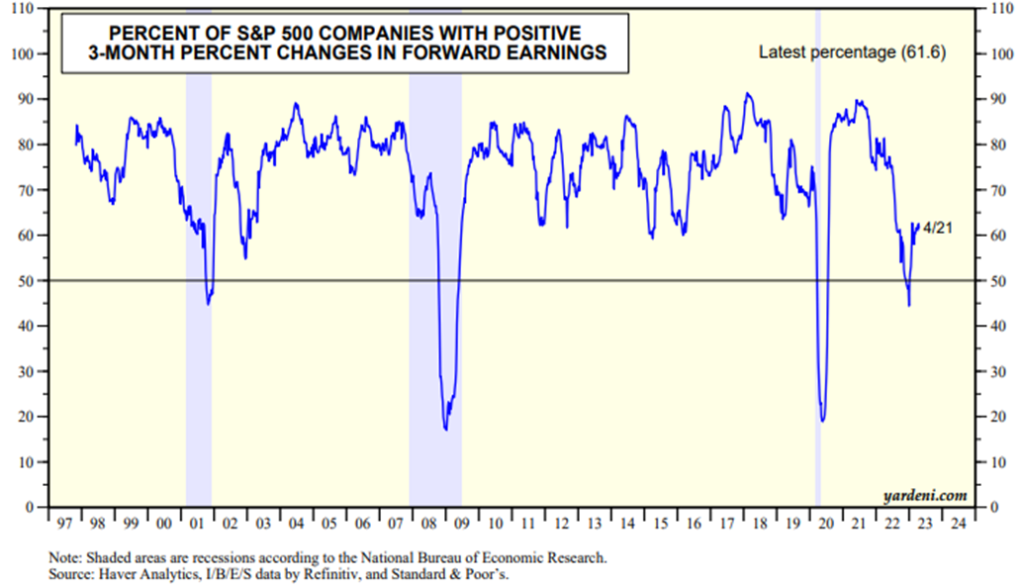
We would have expected earnings to start to falter, but so far earnings are coming in as good as, and in some cases, better than expected. After all, following 2022’s drop of 19.4% for the S&P 500 it is up 8.6% in 2023. A turnaround? Dr. Ed Yardeni publishes a chart showing there is optimism that companies will continue to report good results. Unless a black swan hits the market, the market tends to be earnings-focused. Yardeni’s chart below shows the percentage of S&P 500 companies with positive three-month changes in analysts’ consensus of forward earnings. Yardeni states it tends to fluctuate around 80% during expansion but falls to 50% or lower during recessions. It dipped under 50% late last year but has since recovered. If anything, the earnings indicator is upbeat. But will it last? Many are expecting it not to.
The University of Michigan Consumer Sentiment 1957–2023
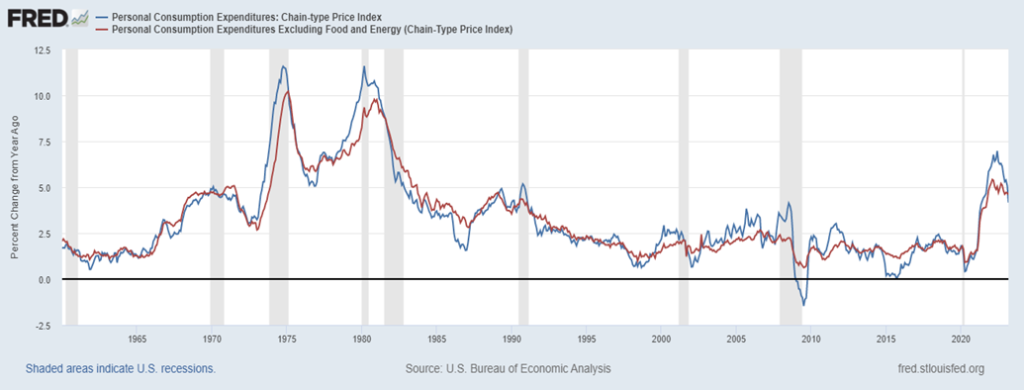
Inflation remains a bugaboo. Personal Consumption Expenditures (PCE) came in at 4.2% year over year (y-o-y), which was actually slightly less than expected. But PCE core prices (ex food and energy) were higher at 4.6% on expectations and the monthly rise was 0.3% again as expected. The Fed puts more stead in the PCE prices over CPI. PCE prices remain at the highest levels seen since the inflationary 1970s. It’s coming down, but it’s sticky.
Personal Consumption Expenditures (PCE)
Core PCE Less Food and Energy
1960–2023
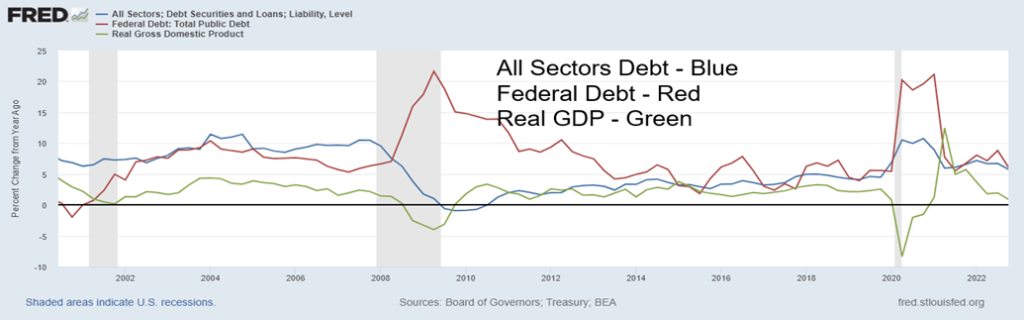
One thing that is not a surprise for us is that debt has been growing faster than GDP, especially since 2000. Maybe that shouldn’t be a surprise. Growth since then has been accomplished on a sea of debt. While all sectors’ debt has grown by $70.0 trillion since 2000, GDP is up by only $16.8 trillion. What that implies is that it has taken some $4.20 of new debt to purchase $1 of GDP. In the previous 20-year period, 1980–2000, it took only $3.06 of new debt to purchase $1 of GDP. The message is simple—it takes increasing amounts of debt to generate additional GDP. The next 20 years could be worse. But is it sustainable? As banking woes mount, commercial real estate stumbles, and many consumers are underwater on their mortgages, a debt reckoning is still coming. The question is not whether will it come, but how steep will it be. Compared to debt growth GDP growth is anemic.
A recession is still in the works. Of that, we have little doubt. The hugely inverted yield curve continues to signal recession. The closely watched 2-year–10-year spread is at negative 57 bp while the 3-month–10-year spread is a record-busting negative 165 bp. Both are as low and lower than they were before the 1982 recession, a recession considered as steep. But, as we have often noted, a recession doesn’t usually get underway until the yield curve begins to normalize. And the stock market doesn’t normally bottom until either into the recession or close to the end of the recession as it did during the 2007–2009 Great Recession. It is extremely rare for the stock market to bottom before the recession even begins. Yet we continually hear calls that the stock market is about to enter a great new bull phase.
Annual Percentage Change
All Sectors Debt, Federal Debt, Real GDP
2000–2022
The question is, what kind of recession will it be? Of 15 recessions since the Great Depression, inflation and sharply rising energy prices have played a key role in at least seven of them. We have inflation but not necessarily sharply rising energy prices. Some argue that energy prices are too high, but a check of current oil prices on an inflation-adjusted basis shows that they are currently well-off record highs seen in 2008 and in 1980. Even during the run-up following Russia’s invasion of Ukraine, oil prices never reached those heights. Still, sharply rising energy prices often play a role in recessions as they did during the recessions of 1973–1975, 1980, 1981–1982, 1990–1991, and 2007–2009.
We have high inflation and, besides the above-mentioned recessions, inflation was at the center of recessions in 1953–1954, 1960–1961, and 1969–1970. We found this chart, courtesy of Mauldin Economics (www.maudlineconomics.com), that we found interesting given its chronicle of recessions since the Great Depression of 1929–1933. As noted, that recession (depression, actually) lasted 43 months, still the longest on record going back nearly 100 years. The shortest on record was the pandemic recession of 2020 which was saved by an enormous amount of debt, free money, and ultra-record-low interest rates. Officially, it lasted two months, but the effects lingered on. With inflation levels persisting, we could have a stagflationary recession as we did during the late 1970s and early 1980s. Or inflation, after initially coming down, could rise up again as it did during the 1970s.
The chart shows that the average recession lasted some 17 months but the range was two months to 43 months. We actually question the number as we added the duration of each recession listed and only came up with an average of 12.5 months. Taking away the longest and shortest recession, they lasted 10.8 months. Maybe they weighted them and it wasn’t just a simple average as we calculated. A recession hasn’t even officially started. Yet for many it feels like it is already underway. May 5 brings us the April jobs report. There have been layoffs announced recently. We’ll see if they are showing up in the numbers.
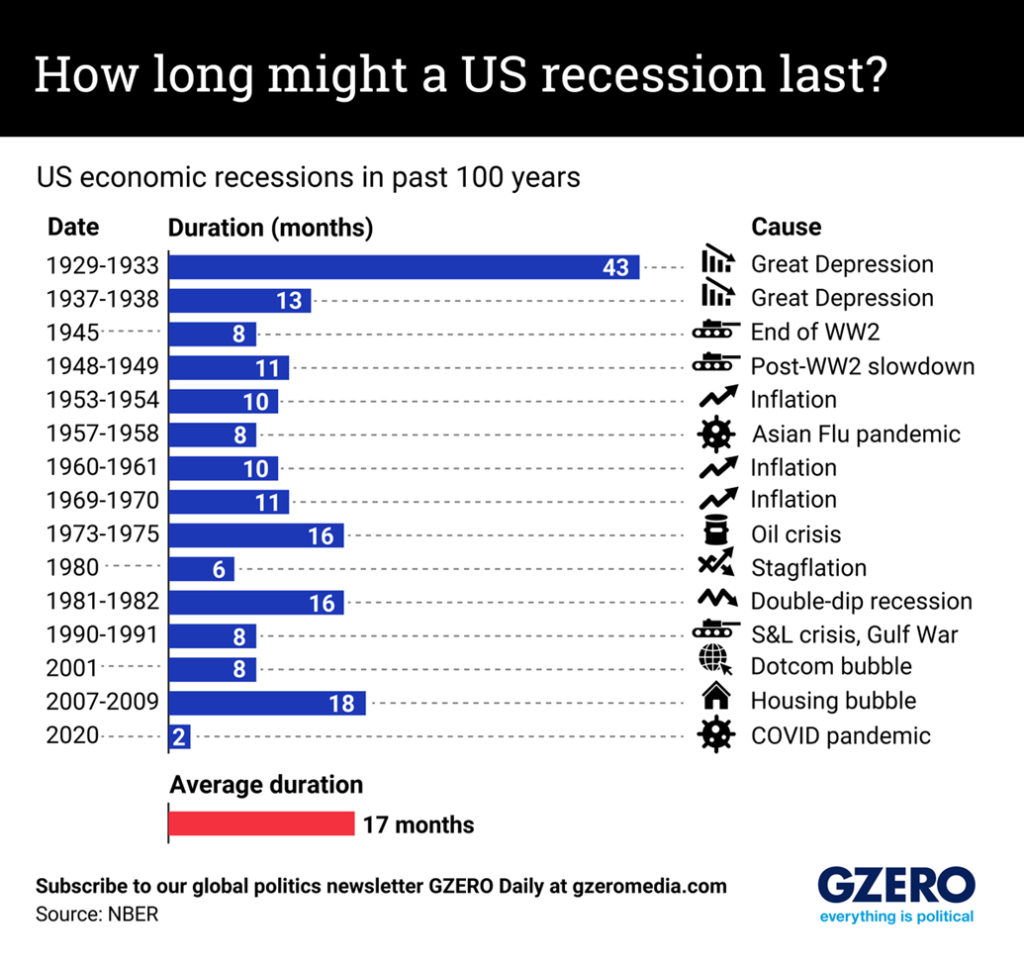
Chart of the Week
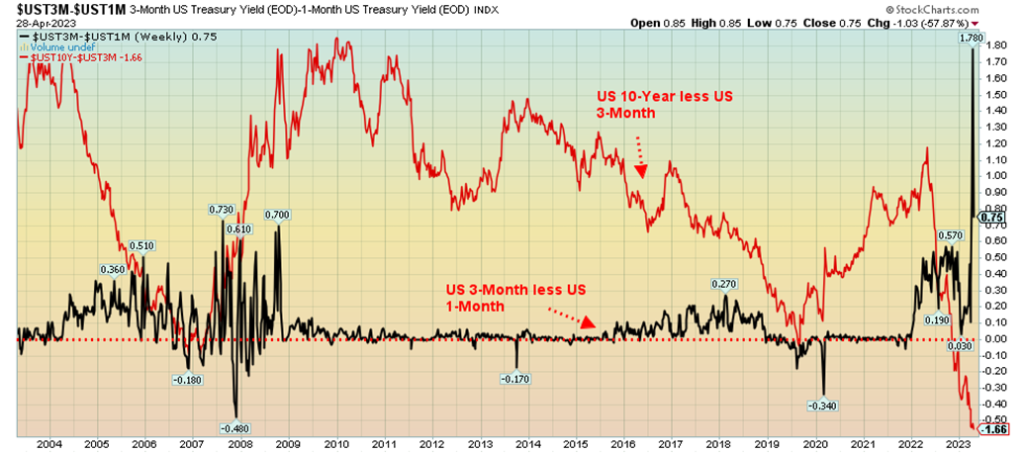
If we were viewing the chart above as the U.S. 3-month treasury bill less the U.S. 1-month treasury bill as a heartbeat, then we were having severe heart palpitations in 2006–2009 and now we are having an outright heart attack. We spent roughly 25 years as a dealer/manager in international money markets and never in our experience did we see the 3-month less the 1-month spread leap to such proportions. Even the 10-year U.S. treasury note less the U.S. 3-month treasury bill has gone loco at negative spreads we’ve never seen before.
So, what is causing all the commotion and dislocation in treasury markets? The U.S. 10-year less than the U.S. 3-month is because of recessionary fears. But the U.S. 3-month less than the U.S. 1-month, normally a staid, boring spread, is having a heart attack over the ongoing debt ceiling negotiations. When it hit 178 bp it was at a level never seen before. Regardless of this, it collapsed to 75 bp the next day, but even that level is unheard-of. During the 2008 financial crisis, things got a little hairy, but the high was only 73 bp. It is a sign that things are not right.
U.S. Treasuries are considered the most risk-free security in the U.S., and possibly even in the world. The reality is, right now there are a lot of nervous people having doubts about whether the U.S. will pass a new debt ceiling limit. While we all love to think that, at the end of the day, they would do the right thing and prevent a default, the toxic atmosphere in Washington is such that a deal is not imminent. Or maybe they kick the can down the road like they managed to do after debt ceiling battles in 2013 and 2018. They announced a suspension rather than an increase. But this time the outcome is quite uncertain.
Yes, the U.S. treasury is using what one would call extraordinary measures to try and keep things on an even keel. However, every time they turn around, they have to come up with a new trick to keep things good. It’s becoming increasingly difficult, especially given tax revenues are weaker than expected.
It seems, however, that buying 1-month treasury bills will somehow protect them in the event of a default. Well, no, it won’t. But the perception is there that it is safer—hence, the leap in spread to 178 bp.
The U.S. has a debt ceiling because, during World War I, they established a limit or ceiling on how much debt could be issued to cover the cost of the war. After that, debt ceiling increases were passed almost unnoticed until 1980. Then the debt ceiling wars started. The result was government shutdowns, albeit temporary shutdowns in 1980–1981, 1984, 1986, 1990, 1995–1996, 2013, 2018, and possibly (probably?) now 2023. The debt ceiling crisis took place as well in 2011, but there was no shutdown. The battles are increasingly partisan with neither side wishing to compromise.
Quite simply, the Republicans want massive spending cuts while the Democrats want the status quo. But conservative estimates are that the proposed massive spending cuts would have a huge negative impact on the U.S. economy, with rising unemployment and a slowing (recessionary?) U.S. economy. The warnings of the negative impact of not coming to a deal are that the effects would be felt globally throughout all markets. It would weaken the U.S.’s international standing and probably result in a downgrade of U.S. debt, which, of course, reverberates back on all U.S. debt, including corporate debt. All would become more expensive.
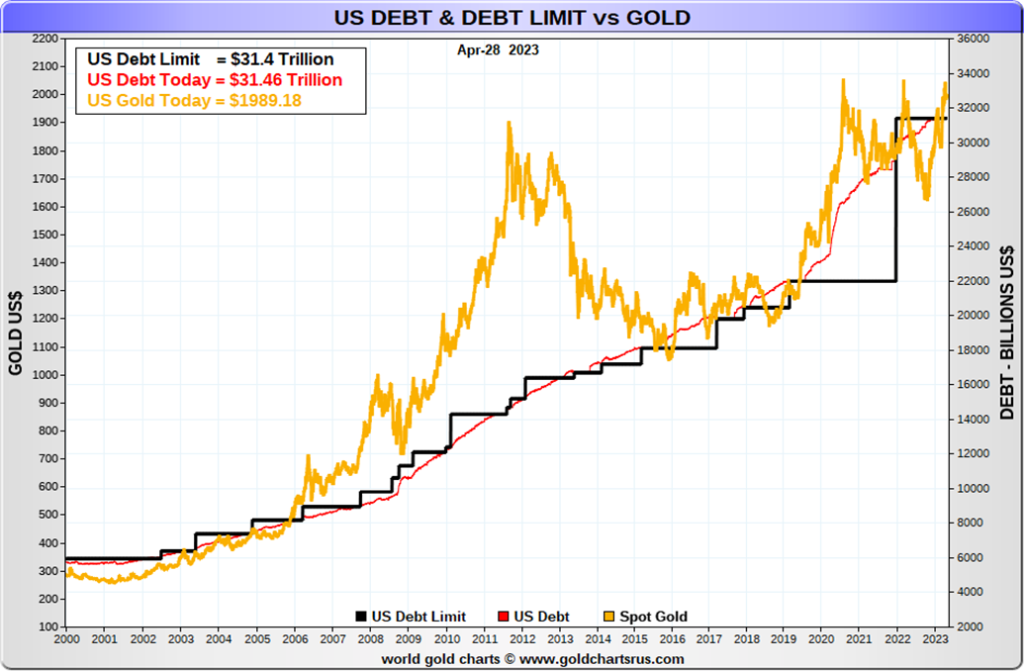
The U.S. debt limit is currently $31.4 trillion. But a check of US Debt Clock (www.usdebtclock.org) says it is already at $31.7 trillion. Must be a lot of tricks going on. U.S. Treasury Secretary Janet Yellen has warned that failure to raise the debt limit would be an economic catastrophe. Simply put, things would shut down. Government employees would not get paid, nor would Social Security recipients, Medicare recipients, contractors, and a host of others. Many others would be impacted and things would be shut down from parks to government buildings and more.
All this aside, there are a number of Republican congressmen refusing to budge on their demands, thus making passage extremely difficult. The estimate is that by early June, if a deal is not reached, things could come to a screeching halt. What’s worse, there might actually be a default if the U.S. failed to pay interest that was due or pay back maturing securities. That would have negative global implications and indirectly impact all debt everywhere.
Things are even heating up in the equity markets. There has been a sharp rise of put buying. The S&P 500 fell some 2% from highs over the past week then rebounded thanks to better-than-expected earnings. The U.S. dollar could fall and gold could rise. During the 2011 debt ceiling crisis, gold hit record highs of $1,923 while the US$ Index approached record lows.
Despite all the drama and last-minute brinkmanship, many still expect everyone to come to their senses and do something to prevent a bigger “catastrophe,” as Janet Yellen claims. But will they? While Congress passed its version of the debt ceiling (barely), the odds of it getting through the White House or the Senate are zero. The clock is ticking.
Markets & Trends
| % Gains (Losses) Trends | ||||||||
| Close Dec 31/22 | Close Apr 28/23 | Week | YTD | Daily (Short Term) | Weekly (Intermediate) | Monthly (Long Term) | ||
| Stock Market Indices | ||||||||
| `S&P 500 | 3,839.50 | 4,169.48 | 0.9% | 8.6% | up | up | up (weak) | |
| Dow Jones Industrials | 33,147.25 | 34,098.16 | 0.9% | 2.9% | up | up | up | |
| Dow Jones Transport | 13,391.91 | 14,021.87 | (2.7)% | 4.7% | down (weak) | neutral | up (weak) | |
| NASDAQ | 10,466.48 | 12,226.58 | 1.3% | 16.8% | up | up | neutral | |
| S&P/TSX Composite | 19,384.92 | 20,636.54 | (0.3)% | 6.5% | up | up | up | |
| S&P/TSX Venture (CDNX) | 570.27 | 613.38 | (0.1)% | 7.6% | down | neutral | down | |
| S&P 600 (small) | 1,157.53 | 1,148.17 | (1.0)% | (0.8)% | down | down | neutral | |
| MSCI World Index | 1,977.74 | 2,149.07 | (0.8)% | 8.7% | up | up | up (weak) | |
| Bitcoin | 16,535.23 | 29,231.16 | 3.7% | 76.8% | up | up | neutral | |
| Gold Mining Stock Indices | ||||||||
| Gold Bugs Index (HUI) | 229.75 | 260.64 | 0.2% | 13.5% | up | up | neutral | |
| TSX Gold Index (TGD) | 277.68 | 318.71 | flat | 14.8% | up | up | up (weak) | |
| % | ||||||||
| U.S. 10-Year Treasury Bond yield | 3.88% | 3.43% | (3.9)% | (11.6)% | ||||
| Cdn. 10-Year Bond CGB yield | 3.29% | 2.84% | (3.4)% | (13.7)% | ||||
| Recession Watch Spreads | ||||||||
| U.S. 2-year 10-year Treasury spread | (0.55)% | (0.57)% | 6.6% | (3.6)% | ||||
| Cdn 2-year 10-year CGB spread | (0.76)% | (0.83)% | (2.5)% | (9.2)% | ||||
| Currencies | ||||||||
| US$ Index | 103.27 | 101.40 | (0.2)% | (1.8)% | down | down | up (weak) | |
| Canadian $ | 73.92 | 73.95 | 0.1% | flat | neutral | down (weak) | down | |
| Euro | 107.04 | 110.15 (new highs) | 0.2% | 2.9% | up | up | down (weak) | |
| Swiss Franc | 108.15 | 111.78 | (0.2)% | 3.4% | up | up | up | |
| British Pound | 120.96 | 125.66 (new highs) | 1.0% | 3.9% | up | up | down (weak) | |
| Japanese Yen | 76.27 | 74.71 | 0.2% | (2.1)% | down | neutral | down | |
| Precious Metals | ||||||||
| Gold | 1,826.20 | 1,999.10 | 0.4% | 9.5% | up | up | up | |
| Silver | 24.04 | 25.23 | 0.7% | 5.0% | up | up | up | |
| Platinum | 1,082.90 | 1,090.10 | (4.3)% | 0.7% | up | up | up | |
| Base Metals | ||||||||
| Palladium | 1,798.00 | 1,509.90 | (6.1)% | (16.0)% | up | down | down | |
| Copper | 3.81 | 3.89 | (2.3)% | 2.1% | down | up (weak) | up (weak) | |
| Energy | ||||||||
| WTI Oil | 80.26 | 76.78 | (1.4)% | (4.3)% | neutral | down | up (weak) | |
| Nat Gas | 4.48 | 2.41 | flat | (46.2)% | up (weak) | down | down | |
New highs/lows refer to new 52-week highs/lows and, in some cases, all-time highs.
It was a pretty nothing week as everyone awaits the FOMC on Wednesday and the job numbers on Friday. The S&P 500 gained 0.9% on the week. But it wasn’t easy as initially stocks fell then rebounded at the end of the week thanks to some good earnings. But the S&P 500 Equal Weight Index was up only 0.1%. As we note, the two are diverging. The Dow Jones Industrials (DJI) was up 0.9% but the Dow Jones Transportations (DJT) was down 2.7%. A divergence? We also note that the DJI is below its earlier highs but the S&P 500 is near its recent high. The DJT is nowhere near earlier highs. More divergences. The NASDAQ gained 1.3% on the week but the driver was the FAANGs, with the NY FANG Index up almost 3.0%. The small-cap stocks are diverging as they were down. The S&P 400 (Mid) lost 0.3% and the S&P 600 (Small) was down 1.0%. We are also seeing the same in the Russell indices.
In Canada, the TSX Composite lost 0.3% while the TSX Venture Exchange (CDNX) was down only 0.1%. In the EU, the London FTSE lost 0.6%, the EuroNext was down 1.1%, and the Paris CAC 40 off 1.1% after making 52-week highs (a reversal), but the German DAX was up 0.7%, also making new 52-week highs. Usually, the CAC and the
DAX is in sync. In Asia, China’s Shanghai Index (SSEC) was up 0.7%, the Tokyo Nikkei Dow (TKN) was up 1.0%, but Hong Kong’s Hang Seng (HSI) was down 0.9%.
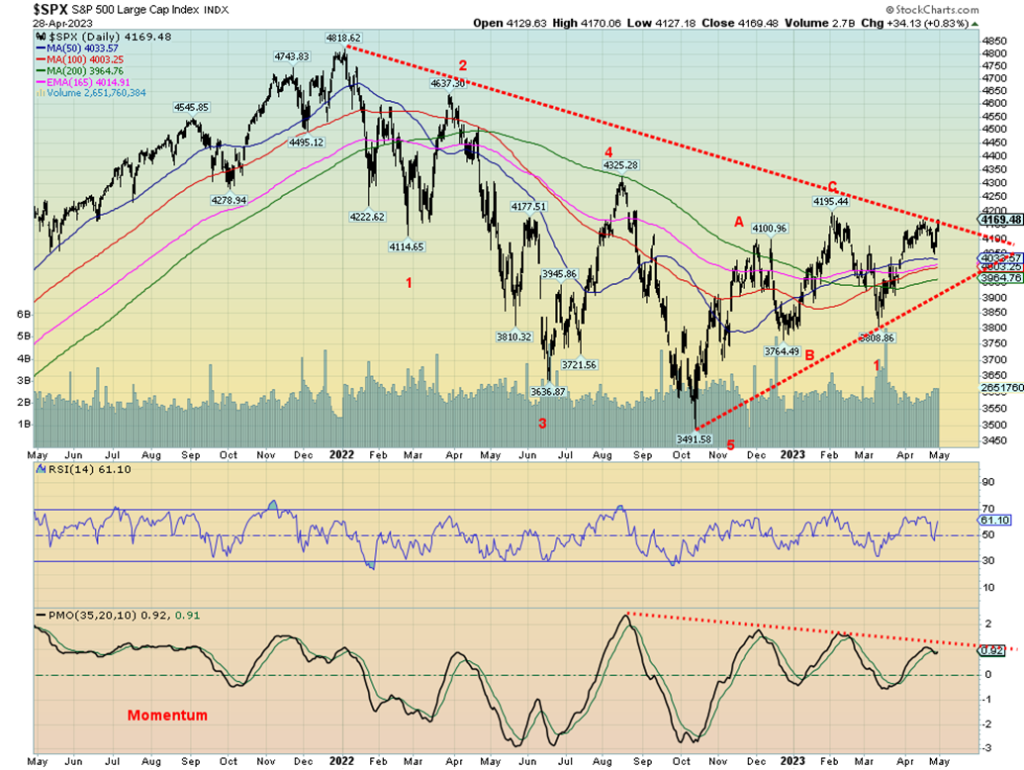
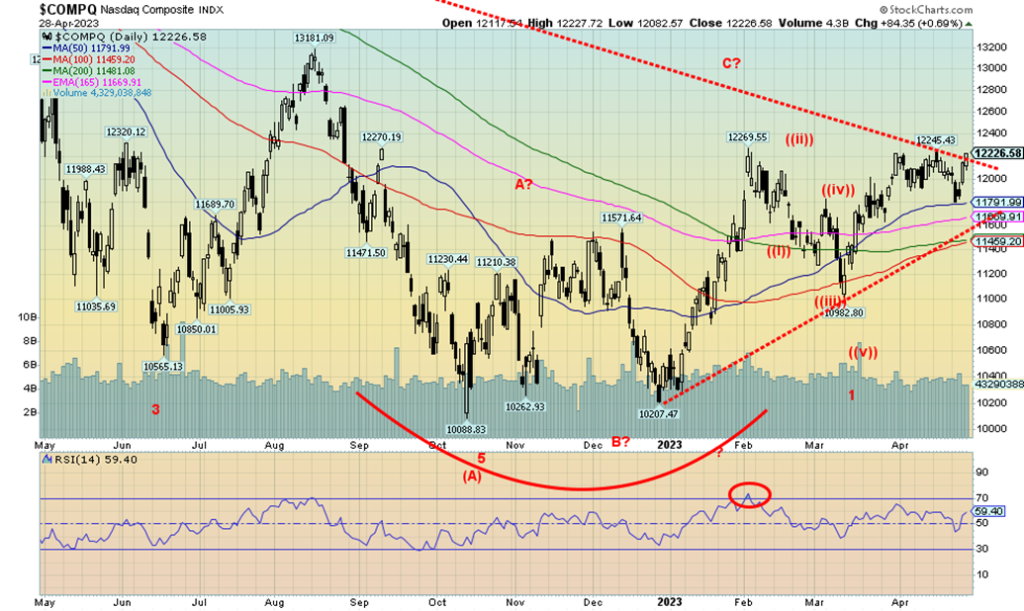
Maybe we’ll find more clarity this coming week with the FOMC and the job numbers. It’s widely expected the Fed will hike 25 bp but pause—meaning, the last hike for the time being. The S&P 500 is close to breaking out; however, with other indices giving us opposite signals we could see a breakout on the S&P 500 but not the others. That would be a divergence and could eventually translate into the market falling. We want to see the small-cap leading and we want to see more breadth but we are not getting it. Momentum, as one can see from the chart of the S&P 500, is making lower highs, suggesting this market is losing steam.
Still, none of this suggests that the market could imminently fall. But the divergences can’t be ignored. The narrow breadth can’t be ignored. That few stocks are leading this higher can’t be ignored. A breakout over S&P 500 by 4,200 could suggest higher prices going forward. The S&P 500 is still down some 13.5% from its all-time high set back in January 2022. A recession hasn’t even started, but we see many calling that October 2022 low the final bottom and a new bull market is underway. We reserve judgment as there are too many divergences and too many non-confirmations. The Fear & Greed Index is still registering greed, but it is fading and is now close to neutral. It is extremely rare, if at all, that a market bottoms before the actual recession gets underway. Usually, it doesn’t bottom until the recession is almost over. It hasn’t even started.
Yes, this market could still go higher, but it’s “sell in May, and go away.” Trends are up but we advise caution. A breakdown under 4,000 could start a downtrend. Under 3,900, a downtrend could be underway.
Is the NASDAQ breaking out? No this is not a convincing breakout, yet. It was a big week for the FAANG stocks as Meta leaped 12.9% to new all-time highs. Joining Meta was Microsoft, up 7.5% also to new all-time highs. All of this has been enough to drag the NASDAQ up as well. However, the NASDAQ is nowhere near its all-time high. That was set back in November 2021 at 16,212. The NASDAQ is still down almost 25% from that high, but here Meta and Microsoft are making new all-time highs. A divergence? Not all of the FAANGs were so lucky. Amazon lost 1.4%, reversing to down from up earlier in the week. The Chinese stocks were losers, with Baidu off 3.5% and Alibaba down 5.0%. That last low for the NASDAQ was near 11,800 so a breakdown under that level would be negative. Despite poking over that downtrend line, the recent high was at 12,245 so we’d need to take that level out as well. The NASDAQ is also diverging with its new highs/new lows line. The NASDAQ has been moving higher, but the new highs/new lows are well off its high. It suggests that the NASDAQ rally is rather narrow, being led by a few (FAANGs?).
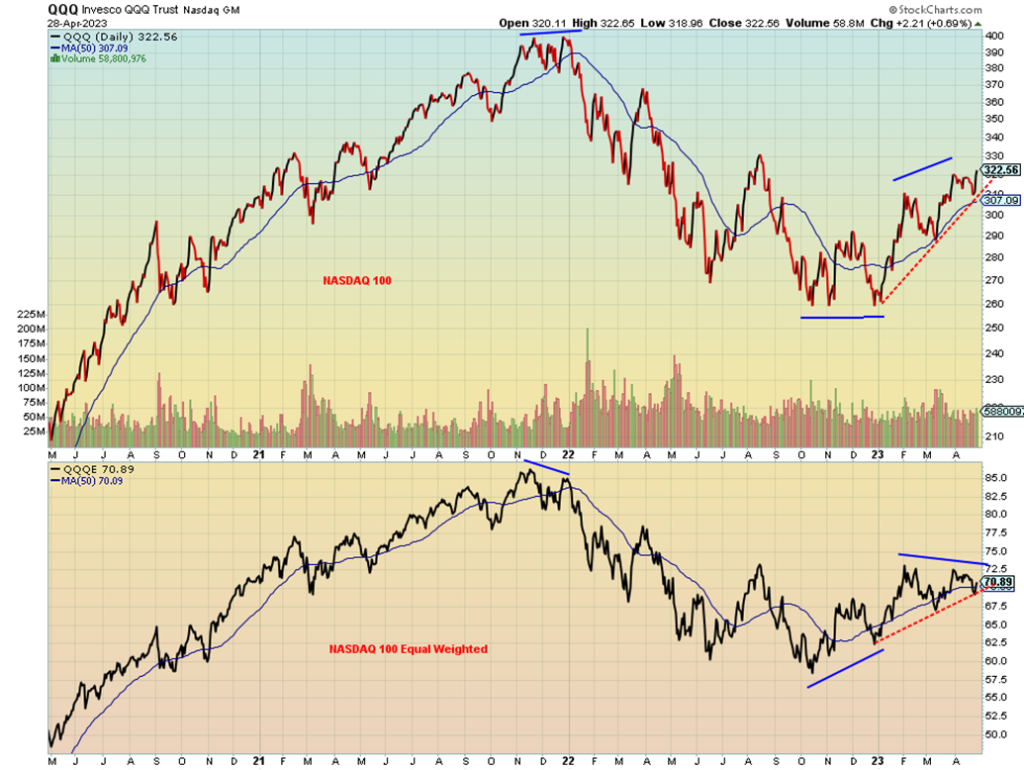
Divergence of note number one. This is the NASDAQ 100 ETF (QQQ) and NASDAQ 100 Equal Weight ETF (QQQE). Note at that high back in November/December 2021 QQQ was holding its highs through November/December but QQQE was making a lower high. This proved to be an omen for a coming drop. At the recent low QQQ was making what appears to be a double bottom, but QQQE was making a higher low. Now the QQQ is making a higher high but QQQE is making a lower high. Is that an omen that the market is about to drop? We are not showing it, but we also note the same divergence between the S&P 500 and the S&P 500 Equal Weight Index with the S&P 500 making new highs while the Equal Weight Index is not making new highs. An omen?
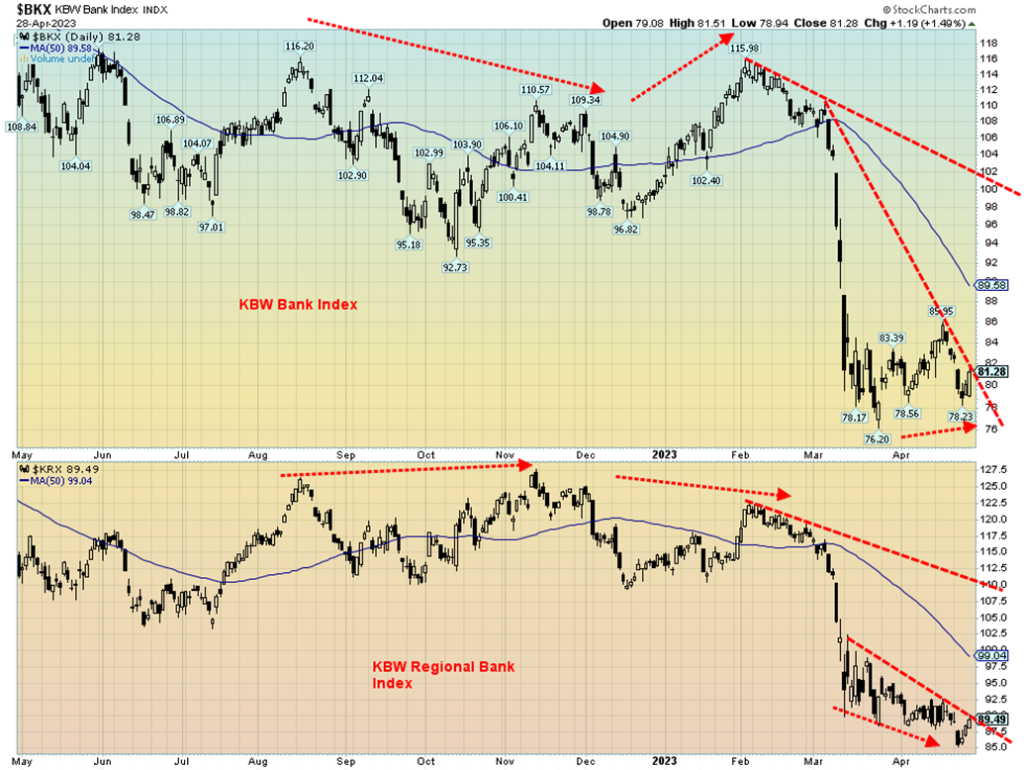
Potential divergence number two. Here is the KBW Bank Index and the KBW Regional Bank Index. In August and November 2022, the Bank Index made a lower high in August while the Regional Banks made a higher high. Once again in February, the Bank Index was making a higher high while the Regional Banks were making a lower high. The market collapsed into March as the SBW Bank/Signature Bank collapses got underway. Now the Regional Bank Index is making a lower low, dragged down no doubt by the woes of First Republic. But the Bank Index is a making a higher low. Is this a setup for a rally? We seem to be getting two different stories from these divergences. One is indicating that markets could fall (technology) while the other indicates a potential rise (banks). We’ll have to see how this plays out. But the recent rise in the market has been led by the technology stocks.
We had noted earlier the divergence between the DJI and the DJT with the DJI up while the DJT is down.
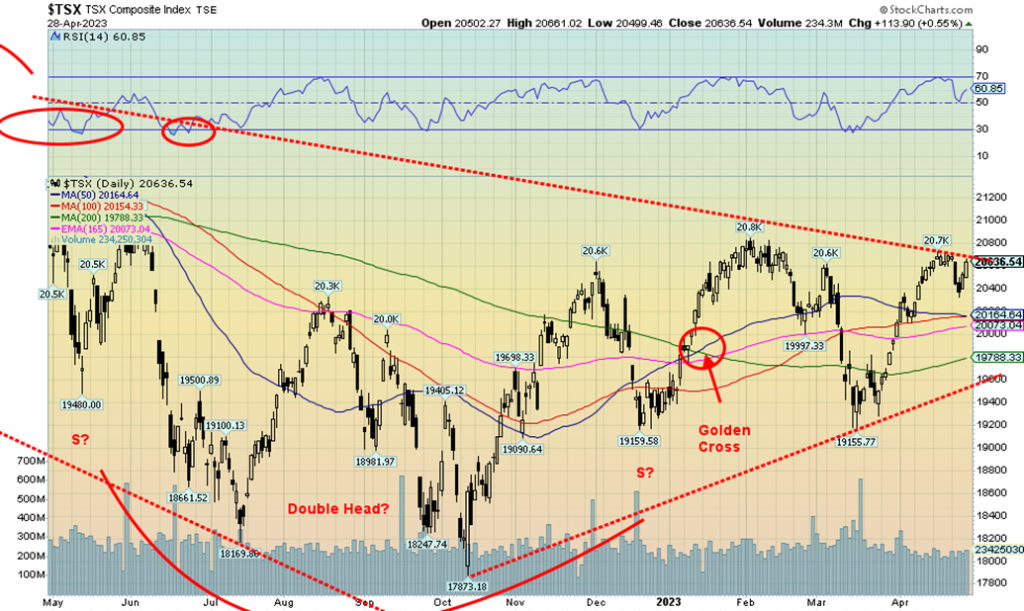
The TSX Composite lost a small 0.3% this past week while the small-cap TSX Venture Exchange (CDNX) was down 0.1%. It was a pretty dull week for most of the sub-indices. Eight were down on the week while three were up and three largely unchanged. The biggest loser was Industrials (TIN), down 2.5% after making 52-week highs. A reversal? Income Trusts (TCM) was the only other one down over 1%, losing 1.1%. The big winner on the week was Telecommunications (TTS), up 1.1%. The TSX continues to appear to want to break out over that resistance line near 20,600. A firm break over the previous high of 20,700 could send the TSX higher. However, a reversal and breakdown under 20,400 could send us down to 20,100/20,200. Long-term support is down at 19,600. Besides Industrials making fresh 52-week highs, Consumer Staples (TCS) also saw 52-week highs. Industrials reversing is not a particularly good sign as it is a key component for the economy. A reversal and drop could solidify thoughts about a recession.
U.S. 10-year Treasury Bond/Canadian 10-year Government Bond (CGB)
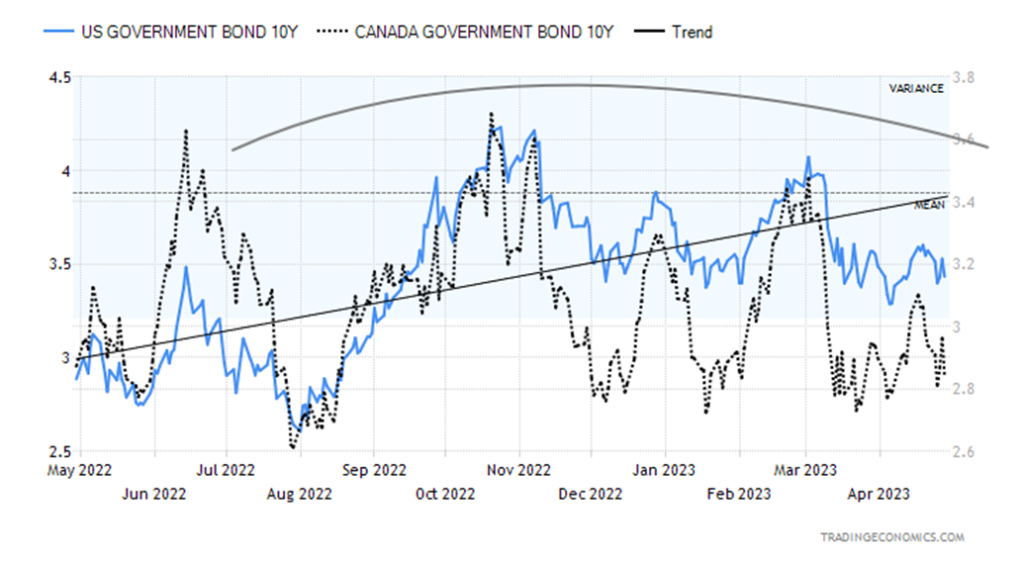
Bonds continue to form what appears to us as a topping pattern (yield) and bottoming pattern (price). Bond yields fell again this past week with the U.S. 10-year treasury note dropping to 3.43% from 3.57% and the Canadian 10-year Government of Canada bond (CGB) down to 2.84% from 2.94%. Both seem to be predicting a coming recession. The 2–10 yield spread, however, remained largely unchanged at negative 57 bp in the U.S., down from negative 61 bp and in Canada at negative 83 bp, up from negative 81 bp. As we have noted constantly, negative yield spreads for the 2–10 and 3-month–10 have predicted every recession since 1970. These spreads are as high as we have ever seen them. A reminder that next week is the FOMC on May 2–3 and the wide expectation is for a 25 bp rate hike, with either a strong indication of a pause or the announcement of a pause. The job numbers are also out May 5. Other numbers to watch are the ISM Manufacturing Index, out Monday. The market is looking for a reading of 46.7. Under 50 is indicative of a recession. The services ISM number is out Wednesday, which is expected to remain above 50.
As to the job numbers, the U.S. nonfarm payrolls are expected at 180,000, down from 236,000 the previous month. The unemployment rate expected is 3.6%, up from 3.5%. In Canada, they are expecting 20,000 jobs and an unemployment rate of 5.6% up from 5.5%. The week promises to be busy. The bond market continues to predict a recession and rates are expected to fall further.
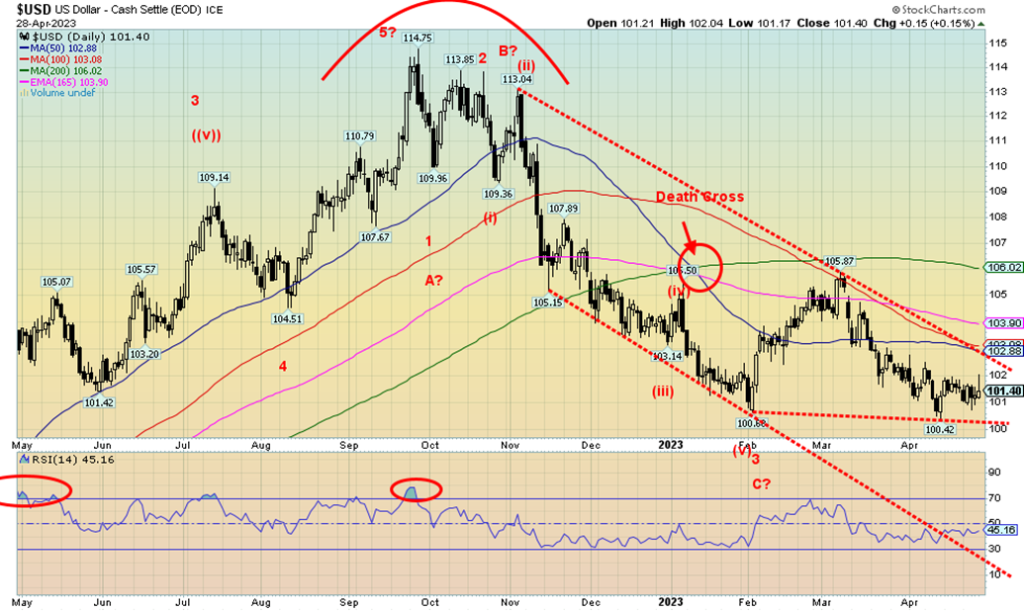
Currencies were pretty boring this past week. The US$ Index lost less than 0.2%, the euro was up 0.2%, the Swiss franc lost 0.2%, the pound sterling gained 1.0% (the big winner), and the Japanese yen was up 0.2%. The Cdn$ was up just under 0.1%. The euro and the pound sterling did, however, make fresh 52-week highs. With the euro and pound making new highs, the US$ Index did not confirm by making new lows. So far, 100 remains key support for the US$ Index. A breakdown under that level would definitely send the US$ Index lower toward 95. The 50-day MA that had been flattening out is beginning to curl lower again. But the breakout level for the index doesn’t occur until it is over 103. After that, there is resistance up to 106. The US$ Index is being bounced around given some weakening U.S. economic numbers, the ongoing banking turmoil, the credit limit war, and growing budget deficits.
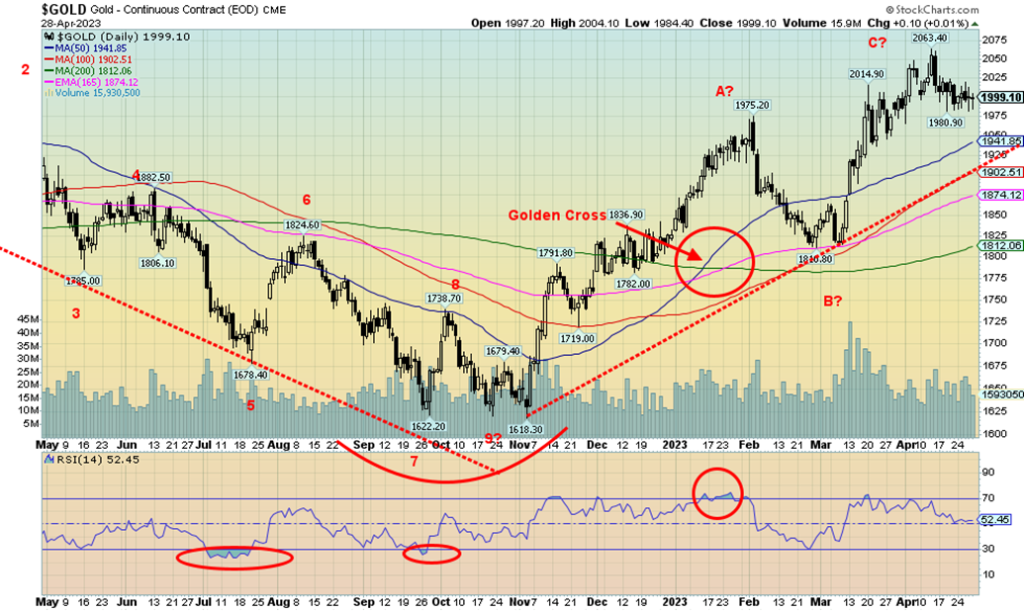
Despite ongoing banking turmoil and a drop in U.S. bond yields, gold only managed to eke out a 0.4% gain this past week. With good reason to rally, it was probably disappointing it didn’t really respond. Gold could be waiting for the FOMC on May 2–3. The wide expectation of a 25 bp rate hike, coupled with some hint or announcement that will pause, could be positive for gold. The banking turmoil may once again, at least temporarily, resolve itself if a buyer for First Republic is found. The credit limit war could also be good for gold. With gold up, silver also gained this past week, up 0.7%. But the joy did not spread to platinum as it fell 4.3%. The near precious metals didn’t fare any better with palladium down 6.1% and copper off 2.3%. If they are leaders, that could spell trouble for gold and silver going forward. However, given their industrial use they may also be predicting a recession. Volume has eased considerably since that volume jump that occurred in March. Gold had run some 13% or so from that low in late February.
We confess we hate it up here, keeping us in suspense. Why? Because, so far, the high is $2,063, just under the previous two highs of $2,089 in August 2020 and $2,079 in March 2022. We are calling this a make-or-break zone. Either we break out to new highs above $2,100 or we fail. The old adage of three strikes and you’re out. Naturally, we read endless stories of how gold is headed for the moon because of all the financial turmoil in behind it, but the reality is breaking to new highs is now essential if this bull is to be kept alive. And have that
happen while we are in a seasonally weak period that stretches into June/July. A move now above $2,040/$2,050 says we should now see new highs. But a break back under $1,975 could suggest a decline to the $1,900/$1,925 zone. That uptrend line is around $1,905. Triple tops are rare, but they could happen. We hate to think that. A breakdown under that October low at $1,618 could suggest a drop to $1,500 and lower. Ultimate targets could be as low as $1,150. We don’t believe that will happen, but as long as the triple-top scenario remains alive, anything is possible.
Ultimately, we are bullish, but short term we are a little uncertain until this pullback works itself through. We don’t see a major collapse coming, but a pullback toward $1,900/$1,925 would not be a surprise. That only becomes a possibility with a break under $1,975. So far, the low is $1,980.
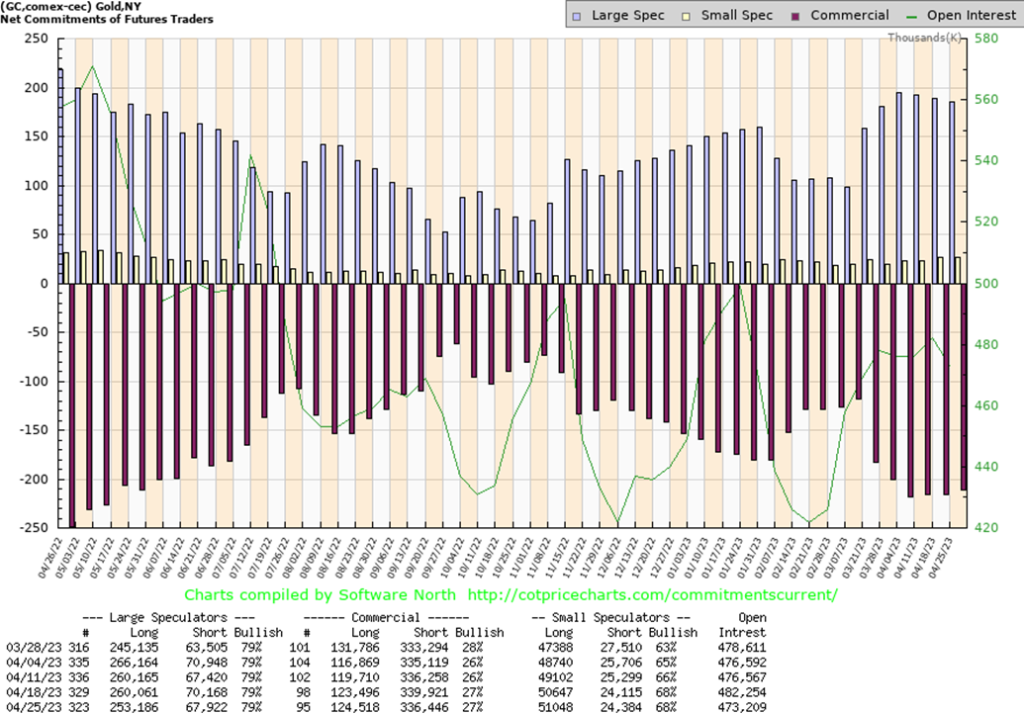
The commercial COT (bullion companies and banks) for gold was largely unchanged this past week at 27%. Long open interest did go up by around 1,000 contracts while short open interest fell by just over 3,000 contracts. The percentage was unchanged. The large speculators’ COT (hedge funds, managed futures, etc.) was also unchanged at 79%. However, their longs fell about 7.000 contracts while shorts dropped over 2,000 contracts. Overall open interest fell roughly 9,000 contracts on an up week.
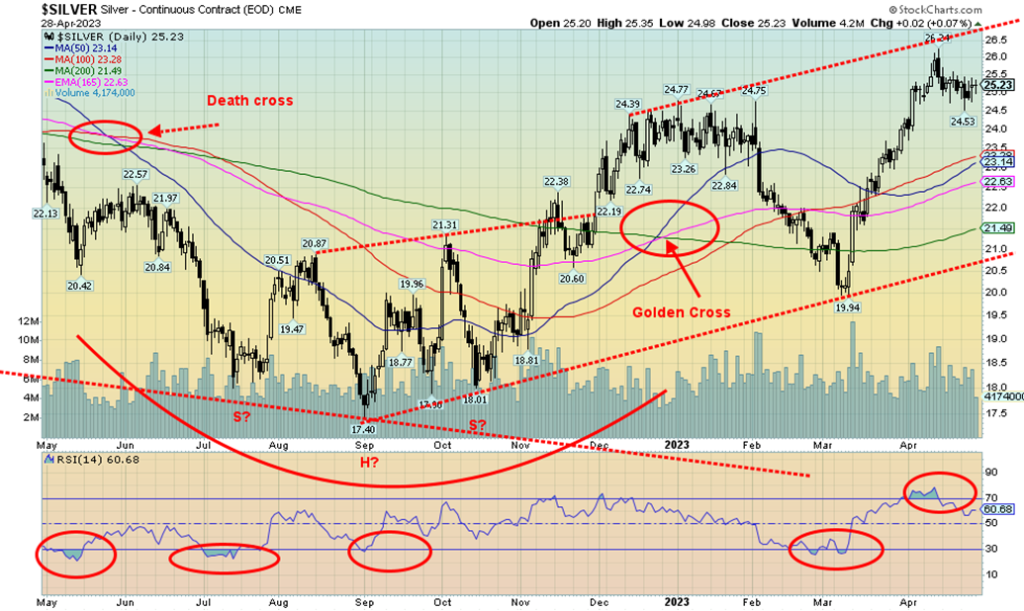
Silver managed a 0.7% gain this past week to help keep the bull move alive. However, the trouble is it appears to be weakening. Note how that pullback into January/February pulled the 50-day MA back under the 100-day MA. It still has not crossed back to the upside. The zone up to $26.50 remains a resistance level that needs to be overhauled if we are to go higher. There is an entire congestion zone for silver that stretches from $23.50/$24 up to $26.50/$27.00. A firm close above that $26.50 level would be positive and suggest higher prices. But a close now under $24.50 could drag us down to $23/$23.50 support. A decline to that level would be considered a normal correction for the move from $19.94 to $26.40. A break of $23 would be considerably more problematic and suggest that the rally may be over. That longer-term trendline is currently down at $21. While we don’t expect to fall to that level, we note it in the event we were to break back under $23.
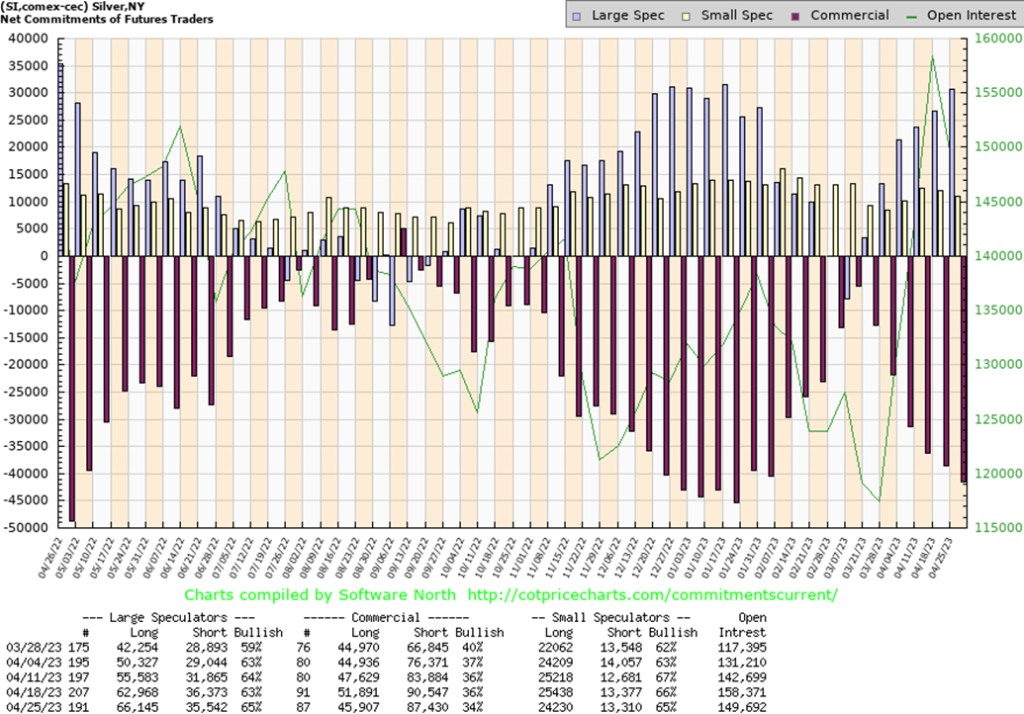
The silver commercial COT fell to 34% this past week from 36%. Longs fell roughly 6,000 contracts while shorts were down about 3,000 contracts. The large speculators’ COT rose slightly to 65% from 63% as they added over 3,000 long contracts while losing about 1,000 shorts. Overall open interest was down about 9,000 contracts on an up week. Like gold, it could indicate a covering of longs.
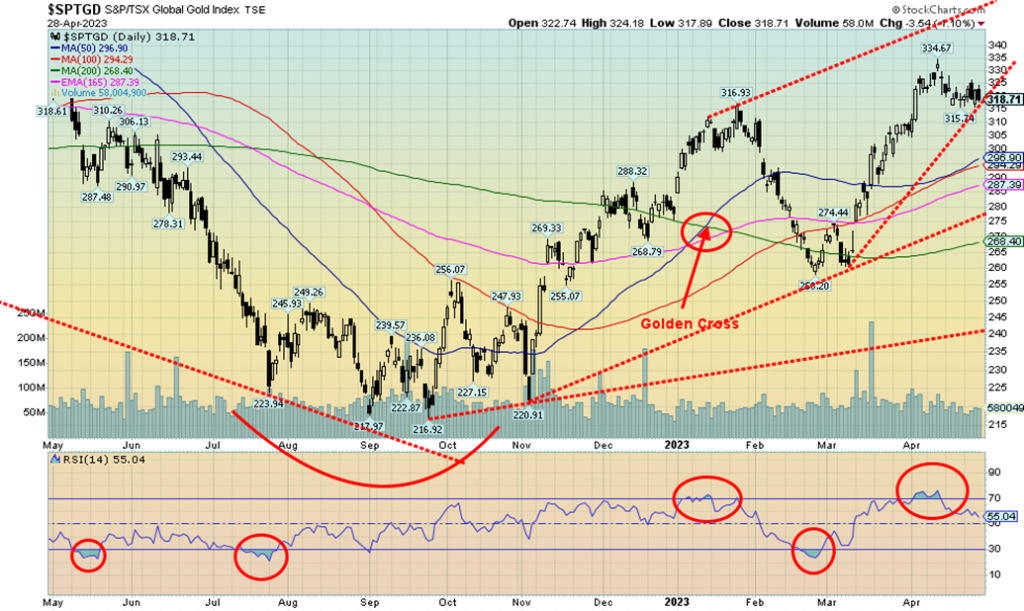
It was a nothing week for the gold stocks. The TSX Gold Index (TGD) was essentially flat while the Gold Bugs Index (HUI) was up less than 0.2%. Maybe the TGD is forming support in this area, but a decline to that 50-100-day MA near 295 would not be a surprise. The only thing that could change our minds on that is new highs above 335. Volume is on the rise and the recent pullback have been stellar. This is happening despite both gold and silver up on the week. The TGD did well in April up 3.7% while the HUI gained 1.7%. Not huge, but positive just the same. In the year, the TGD is up 14.8%, and the HUI up 13.5%. On that basis, the gold stocks have done well and are outperforming the broader market.
Sentiment has been rising but is still not at ultra-bullish levels. The Gold Miners Bullish Percent Index is currently at 75. It’s high, but still below levels where the gold stocks have turned down in the past. The 50-day MA is starting to curl upward again which is positive. The RSI is a neutral 55. That 50–100-day MA near 295 could still beckon. Longer trendline support is way down at 280 and the 200-day MA even lower at 268. Barring a collapse of gold prices, it is doubtful we’ll see those levels. Resistance for the TGD is all the way up to 380, a level that was seen a year ago April.
We remain bullish overall but cautious as we try to work off the last run-up that saw the TGD gain about 26% from that low in February.
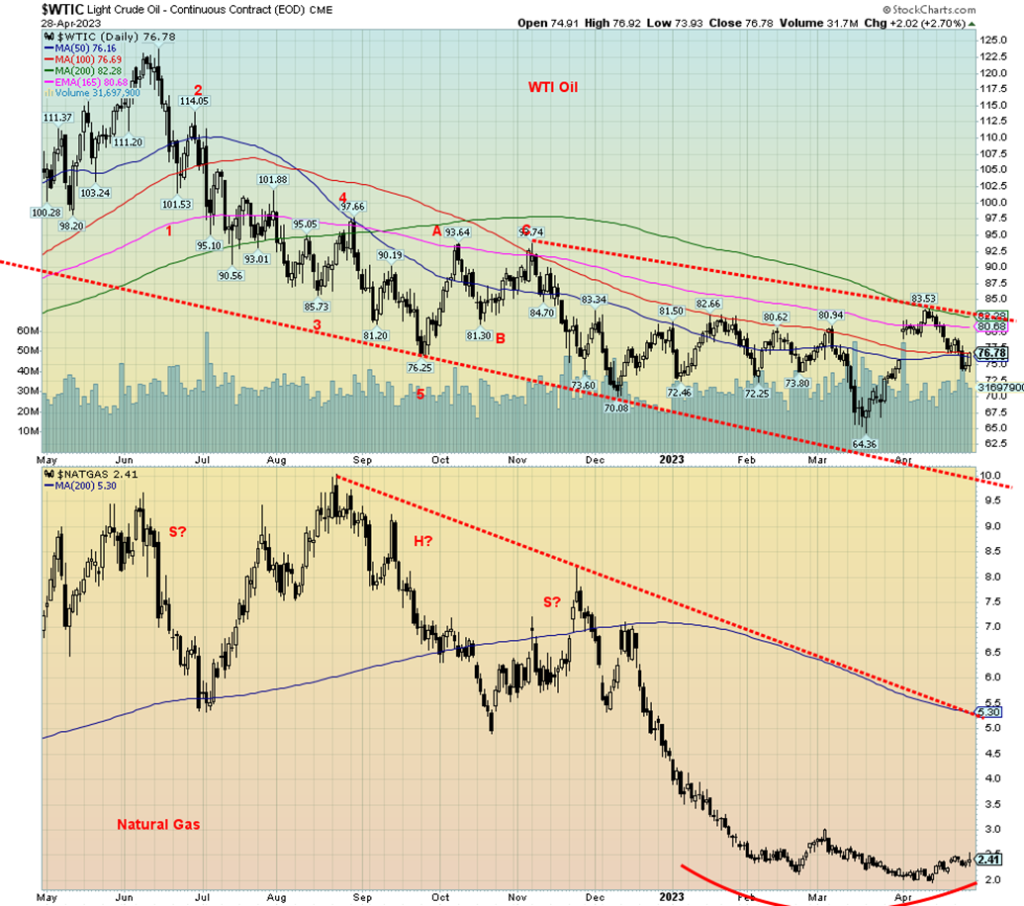
Oil prices remain in a downtrend. For oil, this was the sixth consecutive monthly loss. The highs of 2022 seem but a distant memory. WTI oil actually gained 1.4% this past week but remains down 4.3% on the year. Brent crude fared worse, losing 3.2% and is down 6.5% in 2023. Natural gas (NG) prices were flat this past week, an unusual occurrence. They are down a whopping 46.2% so far in 2023. EU NG at the Dutch Hub fared far worse, losing 4.0% and down 49% in 2023. The energy stocks cannot get any traction as the ARCA Oil & Gas Index (XOI) was essentially flat on the week, but the TSX Energy Index (TEN) gained 0.7% despite the weakness elsewhere.
While the stock market focuses on earnings, oil focuses on the economy and this past week they were not liking what they saw. Refinery margins are apparently being squeezed and data on capital spending negatively impacted oil as well. Crude oil stocks, after rising for a few weeks, have started to turn down.
The imposed price cap on Russian oil is causing a problem for ship insurers. The insurers don’t want to touch anything that could be Russian-related. This increases navigation safety risks as there may be uninsured Russian ships plying the seas. Iran seized a Turkish tanker this past week that was carrying Kuwait oil for Chevron. Apparently, the ship hit an Iranian vessel in the Gulf of Oman and the Iranian navy seized it. Predictably, the U.S. complained that Iran was blocking navigational rights.
Technically, WTI oil remains in a downtrend with the bottom of that channel down around $55. Not that we expect to fall down there. $82/$83 remains tough resistance and until we break that level the trend remains down. WTI oil rebounded on Friday as the stock market rallied and USDX fell. WTI appears to be finding support around the 50/100-day MAs, so maybe it can rebound again. Another break of $75 could send prices lower. NG continues to form what may be a rounding bottom. Depressed NG holders can only hope so as the downtrend has been long and vicious. That 200-day MA at $5.30 is a long way off.
Copyright David Chapman 2023
__
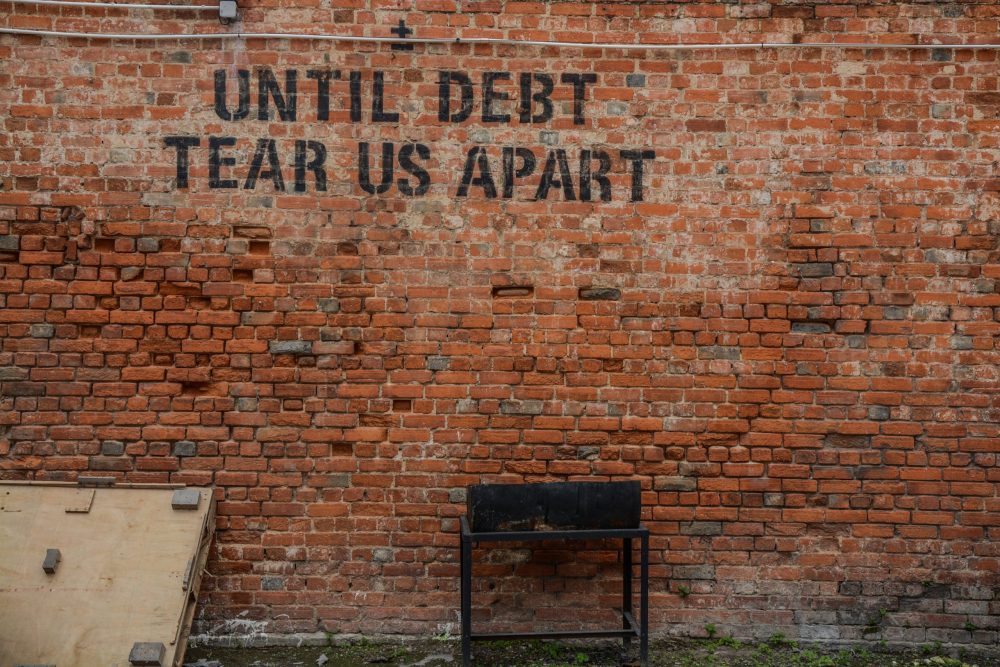
(Featured image by Alice Pasqual via Unsplash)
DISCLAIMER: This article was written by a third-party contributor and does not reflect the opinion of Born2Invest, its management, staff, or its associates. Please review our disclaimer for more information.
This article may include forward-looking statements. These forward-looking statements generally are identified by the words “believe,” “project,” “estimate,” “become,” “plan,” “will,” and similar expressions. These forward-looking statements involve known and unknown risks as well as uncertainties, including those discussed in the following cautionary statements and elsewhere in this article and on this site. Although the Company may believe that its expectations are based on reasonable assumptions, the actual results that the Company may achieve may differ materially from any forward-looking statements, which reflect the opinions of the management of the Company only as of the date hereof. Additionally, please make sure to read these important disclosures.
David Chapman is not a registered advisory service and is not an exempt market dealer (EMD) nor a licensed financial advisor. He does not and cannot give individualised market advice. David Chapman has worked in the financial industry for over 40 years including large financial corporations, banks, and investment dealers. The information in this newsletter is intended only for informational and educational purposes. It should not be construed as an offer, a solicitation of an offer or sale of any security. Every effort is made to provide accurate and complete information. However, we cannot guarantee that there will be no errors. We make no claims, promises or guarantees about the accuracy, completeness, or adequacy of the contents of this commentary and expressly disclaim liability for errors and omissions in the contents of this commentary. David Chapman will always use his best efforts to ensure the accuracy and timeliness of all information. The reader assumes all risk when trading in securities and David Chapman advises consulting a licensed professional financial advisor or portfolio manager such as Enriched Investing Incorporated before proceeding with any trade or idea presented in this newsletter. David Chapman may own shares in companies mentioned in this newsletter. Before making an investment, prospective investors should review each security’s offering documents which summarize the objectives, fees, expenses and associated risks. David Chapman shares his ideas and opinions for informational and educational purposes only and expects the reader to perform due diligence before considering a position in any security. That includes consulting with your own licensed professional financial advisor such as Enriched Investing Incorporated. Performance is not guaranteed, values change frequently, and past performance may not be repeated.


Ecobnb Turns Sustainable Tourism Into Measurable Impact
Ecobnb’s sustainable tourism platform generated significant environmental and social impact in 2025, avoiding 58,207 kg of CO₂ and adding 583...


Sugar Markets Balance Biofuel Demand and Global Supply
Sugar markets in New York and London were mostly unchanged as the Iran conflict renewed interest in biofuels. Drought concerns...


The $40 Trillion Trap: Disinflation Is Not Deliverance
U.S. debt has reached $40 trillion, with $24 billion weekly interest, while deficits accelerate. Despite disinflation in CPI, from cooling...


FinTech Matures as AI and Infrastructure Drive the Next Growth Phase
Fintech markets are entering a mature phase, shifting from rapid growth to consolidation, specialization, and sustainable business models. Zurich and...


Bitcoin, and Ethereum Rise, While Cardano Enters Transition
Bitcoin and Ethereum posted modest weekend gains, supported by ETF inflows. A new proposal may protect Bitcoin from quantum threats....
 |
|
 |  |
 |
|
-

 Biotech2 weeks ago
The New Biotech Act Targets Europe’s Funding and Innovation Gap
-

 Crowdfunding4 days ago
Avant Devices Moves Toward Electric Wheelchair Kit Production with New Funding Drive
-

 Africa2 weeks ago
Bank of Africa Launches SME Pact to Boost Business Growth
-

 Impact Investing6 days ago
Vexuvo Secures €39M UniCredit Financing to Drive Agrivoltaic and Storage Expansion in Italy