Markets
How Markets Performed This Past Week
There was a lot happening this past week, so we highlighted some of the surprises including the U.S. Q3 GDP and Canada’s job numbers. We also look at the performance of the TSX and its sub-indices in 2023. Finally, we look at the bear market in bonds. Oil has been on the skids but we believe it is trying to find a bottom here. Oil is the subject of our chart of the week.

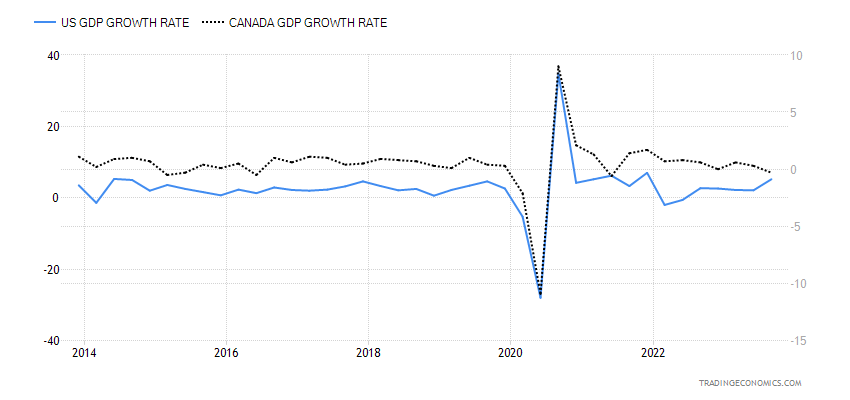
It came as a bit of a surprise that Q3 GDP growth for the U.S. came in at 5.2% above the earlier estimate of 4.9% and the previous quarter’s growth of 2.1%. Inventory growth was up 1.4%, above the estimate of 1.3%, government spending was up 5.5%, again above estimate of 4.6%, and consumer spending was up 3.6%, which was below the estimate of 4.0%. That said, consumer spending was the highest recorded since Q4 2021. Retail sales were down 0.1% in October so Q4 is not starting out well.
Canada’s Q3 GDP growth showed a contraction down 0.3%. Higher interest rates seem to be biting. No, it’s not a recession yet because an official recession is at least two consecutive quarters of negative growth.
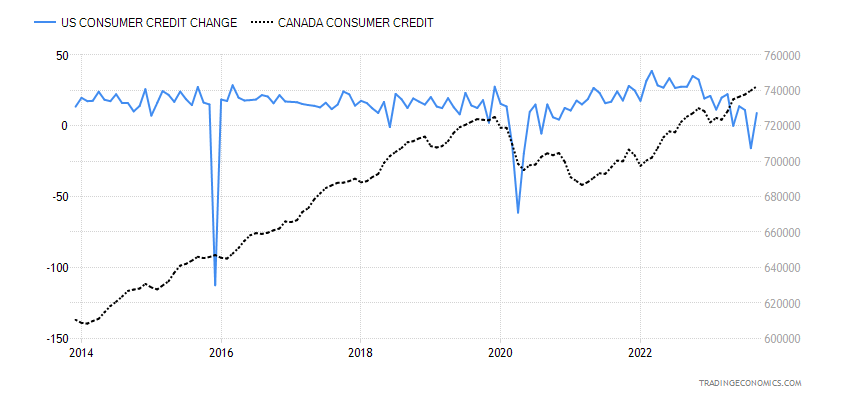
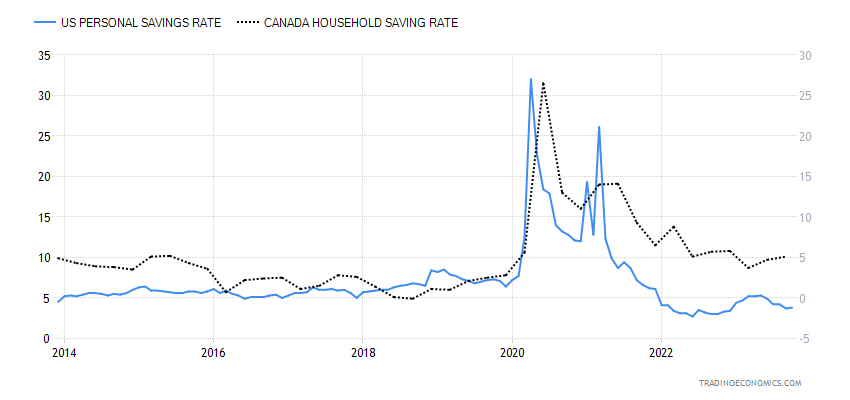
But maybe it’s no surprise to see consumer credit is rising. In the U.S., consumer credit rose some $9.1 billion in September while in Canada it was up $742 million. While Canada’s consumer credit has been steadily growing in 2023. the U.S. has been seeing a choppy decline since peaking in 2022. Meanwhile. consumer confidence is falling in both countries and the consumer has been paying down their personal savings. Savings down, consumer credit up, consumer confidence down. Does not sound like a recipe for growth going forward.
U.S., Canada GDP Growth Rate Q3 2023 – Table 2013–2023
Consumer Credit U.S. and Canada 2013–2023
U.S. and Canada Personal Savings Rate 2013-2023
The Fed watches personal consumption expenditures (PCE) closely as an alternative to the Consumer Price Index (CPI). Given the stronger than expected growth numbers for Q3, this could ease Fed concerns about stagflation. Stagflation would occur against the backdrop of stubbornly high inflation, coupled with slowing or even negative growth.
U.S. PCE Inflation vs. CPI Inflation 2013–2023
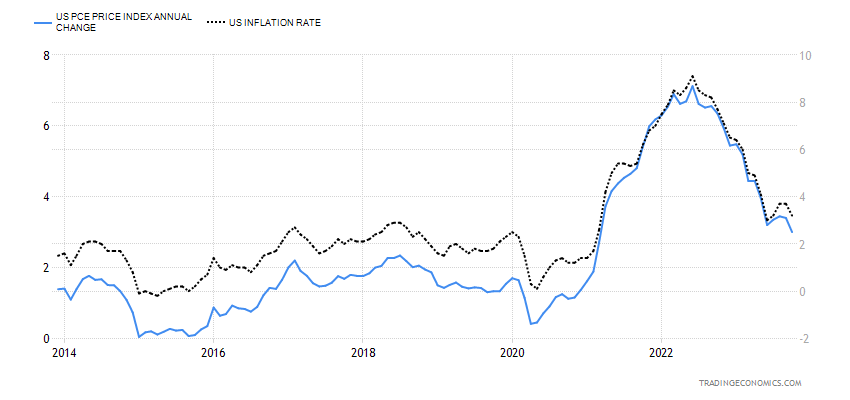
Instead, what we have is GDP growth up 5.2% while PCE inflation is up only 3%. Grant you, that could change into Q4 and into 2024 if the economy does slow, as many economists expect. Gasoline prices could play a key role in inflation. Of late, they have been soft, but expectations going into 2024 could see them rise once again. Measures taken to fight slowing growth and rising unemployment—such as lowering of interest rates or quantitative easing (QE)—could, instead, fuel inflation. On the other hand, fighting inflation by raising interest rates and doing quantitative tightening (QT) results in a slowing economy and rising unemployment. As they might say, the Q3 numbers put that fear to rest, at least for the moment.
With Q3 U.S. GDP growth higher than expected, it makes everyone wonder when the Fed is not going to just pause but pivot. Right now, everyone is in the pause camp, but, surprisingly, there are many who believe the Fed will pivot, meaning starting to cut rates, in 2024. The question is, why would anyone think that when the U.S. just posted stellar GDP numbers? Yet, bond king Bill Ackman is predicting the Fed will start cutting in Q1 2024. While there are signs of softening employment, unemployment remains near the recent low. Unemployment is also low in Canada, despite last month’s upward blip. (See Canada’s November employment numbers later).
The Fed started hiking rates in March 2022, coinciding with the start of the Russia/Ukraine war. War is normally inflationary. Was the hike timed for the war? That is conjecture—or is it a coincidence? The question now is, how can the Fed even think about cutting rates when there is still no strong sign of a recession? However, we do know two things. First, there is absolutely no case of a prolonged inverted yield curve that did not eventually end in a recession. Second, rate hikes invariably led to a recession or at least a slowdown.
Finally, stock market declines were a feature of rate hikes and an inverted yield curve. Often, however, the biggest part of the stock market decline didn’t really occur until after the Fed pivoted from rate hikes to rate cuts. But it was not unusual for the stock market to anticipate the recession and start falling before the Fed actually cut rates. Everyone now seems to be anticipating rate cuts in 2024. They may be right, but the recent GDP numbers seem to say otherwise. Inflation is coming down, but what’s key may be next Friday, December 8 when the U.S. November job numbers are released.
Fed Reserve Rate Cycles and Result 1950–2023
| First rate hike | Last rate Hike | First rate cut | Result | Maximum stock market decline DJI % |
| October 1950 | May 1953 | Recession July 1953–May 1954 | 13% | |
| October 1955 | August 1957 | November 1957 | Recession August 1957–April 1958 | 19.4% |
| September 1958 | September 1959 | October 1959 | Recession April 1960–February 1961 | 17.4% |
| December 1965 | September 1966 | February 1967 | Soft Landing | 25.2% |
| November 1967 | June 1969 | December 1969 | Recession December 1969–November 1970 | 35.9% |
| April 1972 | September 1973 | February 1974 | Recession November 1973–March 1975 | 45.1% |
| May 1977 | March 1980 | May 1980 | Recession January 1980–July 1980 | 16.4% |
| August 1980 | December 1980 | April 1981 | Recession July 1981–November 1982 | 24.1% |
| March 1983 | August 1984 | October 1984 | Soft Landing | 15.6% |
| January 1987 | May 1989 | July 1990 | Recession July 1990–March 1991 | 21.2% |
| February 1994 | February 1995 | July 1995 | Soft Landing | – |
| June 1999 | May 2000 | January 2001 | Recession March 2001–November 2001 | 37.8% |
| June 2004 | June 2006 | September 2007 | Recession December 2007–June 2009 | 53.8% |
| December 2015 | December 2018 | August 2019 | Recession February 2020–April 2020 | 37.1% |
| March 2022 | August 2023 *To Date | ? | ? | 22.4% *To Date |
TSX Performance 2023
It has been a mixed bag for the TSX in 2023. With one month to go, outside of information technology, no one has stood out. Of the 14 sub-indices on the TSX, eight are down on the year while six are up. Leading the gains is Technology TKK, up 52.0% in 2023. TKK, more than anyone else, is key to the TSX Composite up on the year by 5.5%. Next best was Health Care THC that enjoyed a rebound year, up 12.0%. At the other end, the big loser is Utilities TUT, down 7.0%. Telecommunications TTS is down 6.4% as Income Trusts TCM. Real
Estate TRE has lost 3.0%, but possibly more telling is the TSX Capped REIT Index RTRE, which is down 7.7%. Financials, the largest component, represents some 31.7% of the index. Energy represents 19.0%, so between the two they comprise over 50% of the index. Health Care makes up only 0.4% of the index—barely noticeable. Hence, that’s why picking individual stocks may fare better than owning an index. There are ETFs for most of the sub-indices, but not all.
Outside of the indices we have noted in the past such as Golds and Metals, most indices do not look overly attractive as we go into 2024. Most have been in a corrective phase rather than forming bottom patterns. We have previously noted Golds as being attractive for 2024. We feature oil and gas for our chart of the week. Our table on the next page shows the return for each of the TSX sub-indices, plus a few other related indices or ETFs.
We also have a chart of the TSX Financials Index (TFS). Following a long five-wave decline in 2022 that saw the TFS lose 25.5%, financials rebounded in 2023. But the pattern appears to us as an ABCDE type of correction that made its high in July 2023. It was a lower high than the one seen in February 2023. The decline from July to October appears to have unfolded in five waves. This suggests that the rebound is merely a correction. The pattern has the look of a potential descending triangle (declining highs, flattish bottom). If that’s correct, the rally is most likely about done, but we also wouldn’t be surprised at a false breakout that leaves the July 2023 high intact. Financials is the largest component of the TSX. If the financials falter, the rest of the TSX is not likely to do well.

TSX Sub-Indices 2023
| TSX plus sub-indices | Year-to-date % gain (loss) to Dec 1, 2023 |
| TSX Composite | 5.5% |
| TSX 60 | 5.4% |
| TSX Venture Exchange (CDNX) | -4.2% |
| Income Trusts TCM | -6.4% |
| Consumer Discretionary TCD | 7.5% |
| Consumer Staples TCS | 2.4% |
| Energy TEN | 5.7% |
| Financials TFS | 2.0% |
| Golds TGD | 5.3% |
| Metals & Mining TGM | 2.5% |
| Health Care THC | 12.0% |
| Industrials TIN | 6.4% |
| Materials TMT | -2.8% |
| Real Estate TRE | -3.0% |
| Information Technology TKK | 52.0% |
| Telecommunications TTS | -6.4% |
| Utilities TUT | -7.0% |
| Others | |
| TSX Capped REIT RTRE | -7.7% |
| TSX Dividend Aristocrats CDZ | 3.7% |
| TSX Small Cap TSES | 0.6% |
| S&P 500 | 19.7% |
| Dow Jones Industrials (DJI) | 9.4% |
| NASDAQ | 36.7% |
| Gold | 14.4% |
U.S. Treasury Bonds
As we have noted before, the bond market has been going through its worst bear market since the U.S. Civil War. At least, that is what one pundit has noted. We are noting bear markets using the U.S. 30-year treasury bond. The current bear market in bonds is the worst we’ve seen since the 1978–1981 bear. Officially, this bear is not over. While we have rebounded recently, it is not necessarily a sign that we’ve seen our low. Our chart below outlines all the bond bears we’ve had since that 1978–1981 bear. Previous bond bears brought stress and even a fund collapse or major bankruptcy.
Bond Bears USB 30-year U.S. Treasury Bonds – 1978–2023
| Period | Loss % |
| 1978-1981 | 43.5% |
| 1993-1994 | 25.4% |
| 1998-2000 | 22.2% |
| 2008-2009 | 20.0% |
| 2012-2013 | 17.0% |
| 2016-2018 | 22.5% |
| 2020-2023 | 41.8% |
| Stocks | |
| NASDAQ 2000-2002 | 77.9% |
| DJI 2007-2009 | 53.8% |
This bond bear has not been much different. It is estimated that Bank of America is sitting on some $132 billion in bond losses in 2023. They sold roughly half their portfolio this year. Silicon Bank, one of the banks that went under earlier this year was sitting on some $91 billion of U.S. government bonds when they went down. Recall as well the disaster that unfolded in the U.K. earlier under former PM Liz Truss when the BOE was forced to come into the market to rescue a potential collapse of the U.K. pension funds because of their mini-budget.
Bond yields have been rising steadily since lows in 2020. The U.S. 10-year treasury note went from 0.55% to a high of 4.93% in 2023. Similarly, the 30-year treasury bond went from a low of 0.99% in 2020 to a high earlier this year of 5.11%. Somewhere, a disaster is lurking.
Because of high spending demands, the U.S. government is having trouble with its bond auctions. Recent auctions have been anything but smooth as investors need higher rates to compensate. The U.S. budget deficit in 2023 is estimated at $1.9 trillion. That has to be financed by issuing treasury securities, plus whatever treasuries are maturing in 2023. That’s an improvement, actually. In 2020, the budget deficit was $2.5 trillion. Printing money from the Fed is the only solution. While foreign holdings of U.S. treasuries are up over the past year (to September) by $354 billion, the two largest foreign buyers are both down. China’s holdings have fallen $123.6 billion while Japan is down $28.7 billion. Both have currency woes and China wants to lessen
dependence on the U.S. due to their ongoing conflicts. Other central banks have picked up the slack. Foreign holders account for $7.6 trillion of the outstanding U.S. federal debt of $33.8 trillion. The balance is held by the Fed and other government accounts ($12.3 trillion) such as Social Security while the remainder is scattered with banks, pension funds, mutual funds, insurance companies, and even state and local governments. Holders of U.S. savings bonds make up another cohort holding U.S. securities.
However, the sheer demand of the U.S. Federal government is putting a strain on markets
Hedge funds got caught the wrong way earlier this year (too short) and a short squeeze forced them to buy back. Many financial institutions are sitting on losses and are reluctant to add more paper to their portfolios. Strain is being seen elsewhere, particularly in the commercial loan market where a $71 billion real estate fund run by Blackstone (BKX) shut down the ability to withdraw funds. Could others follow?
U.S. treasuries are supposed to be safest in the world. But the U.S. has already suffered downgrades to its debt and Moody’s, who had been a holdout, has put the U.S. on negative watch for a possible downgrade. Safe may not be too safe any longer.
U.S. 30-year Treasury Bond
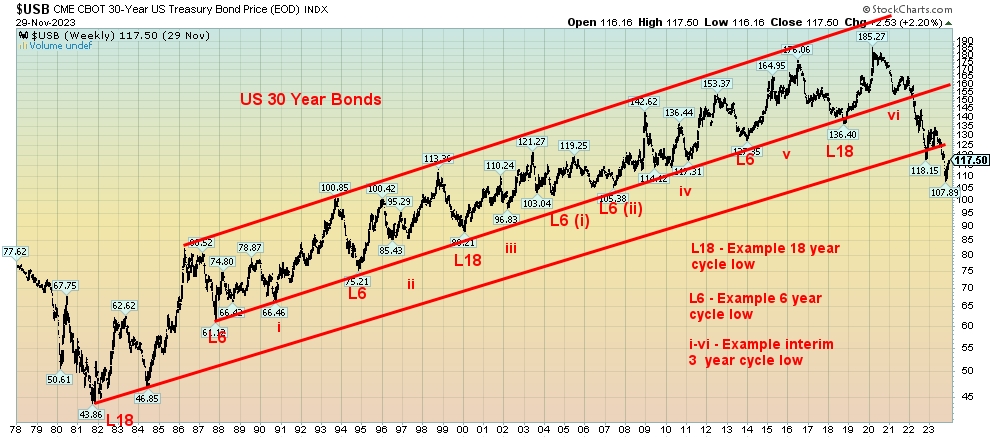
We’ve shown this chart before of the 30-year U.S. treasury bonds with the cycles marked. Treasuries, it seems, go through a long 18-year cycle that breaks down into three 6-year cycles, which in turn breaks down to into two 3-year cycles or three 2-year cycles. The 18-year cycle bottomed in 1981, 2000, and 2018. The next 6-year cycle is due to bottom in 2024, but the range is 5–7 years so it is possible that recent low in 2023 is our 6-year cycle low. We had a low in 2021 (three years from 2018), but the rebound was feeble. We not only plunged to new lows, but we broke the uptrend that has been in place since 1987 and the uptrend that has been in place since 1981. That tells us we have now entered a long-term bear market for bonds. We are coming off an
incredible 39-year bull market. We haven’t had a bear market like this since the 1970s. It is a question of when, not if, there will inevitably be a blow-up.
Canada Job Numbers
Canada Employed Persons, Unemployed Persons 2018–2023
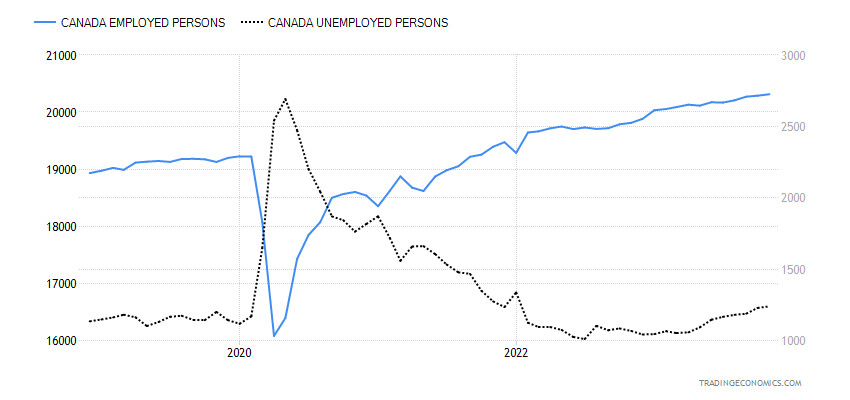
Canada surprised, reporting its job numbers early before the U.S. Usually it’s the other way around. Nonetheless, there were some surprises. Canada added 24,900 jobs in November when they only expected a gain of 15,000. Full-time jobs jumped 59,600 while part-time jobs fell 34,700. Oddly enough, all this occurred as we are hearing of more layoffs with Canada’s banks. The Bank of Canada, however, noted that job gains have been coming in below labor force growth and job vacancies are easing. That suggests that demand for labor could decline. The labor force participation rate remained unchanged at 65.6%. However, the unemployment rate grew to 5.8% from 5.7%. This was largely in line with expectations. The number of unemployed persons grew by 11,000 in November. But the labor force grew by 36,000 with only 24,900 new jobs. The R8 unemployment rate, the highest reported by Statistics Canada that includes discouraged searchers and the waiting group portion of involuntary part-timers, jumped to 7.2% from 6.9%.
While the number was good, the fact the labor force grew and the number of unemployed grew is not a good sign going forward.
Chart of the Week
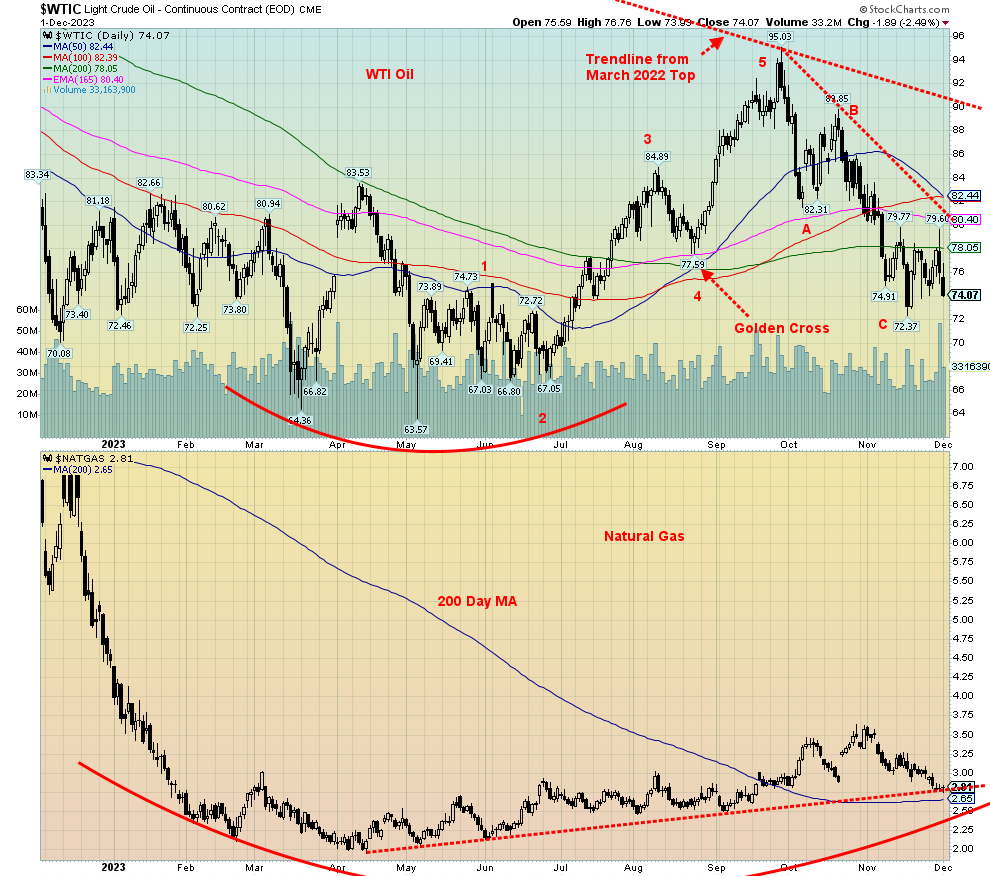
WTI Oil Natural Gas 2018–2023
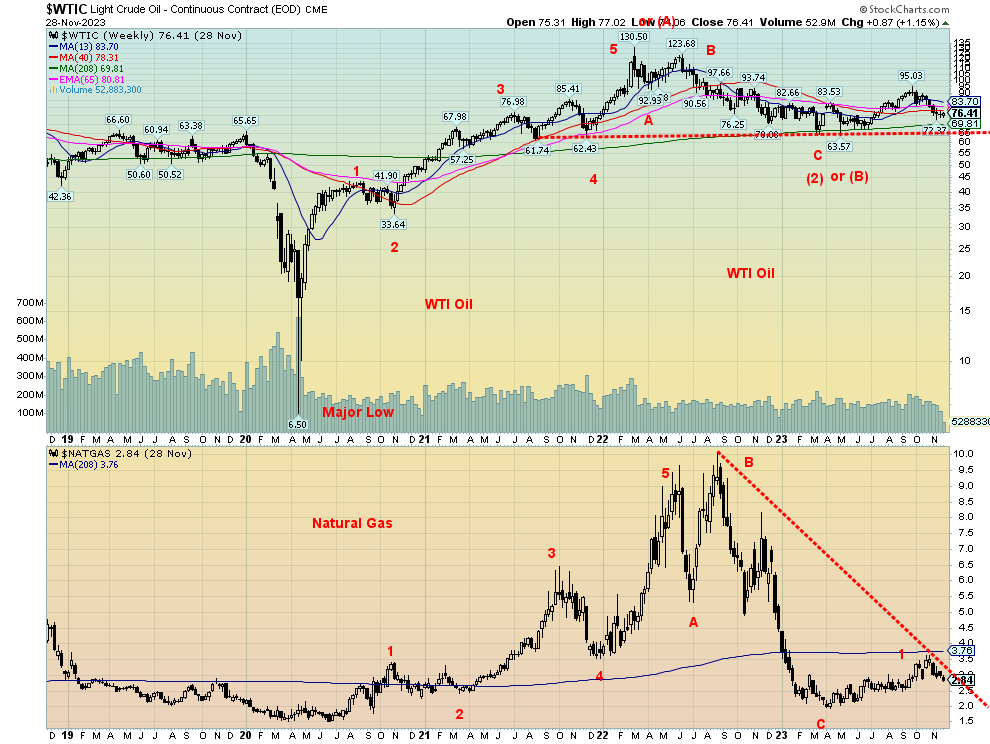
Is that a huge platform for WTI oil that will see oil plunge off the cliff? Or is it a major support zone as oil is poised to move higher? We suspect the latter. If it was a platform, then a breakdown under $60 could be very dangerous, taking oil potentially back to the lows of 2020. We find that highly unlikely, given the current global geopolitical situation. The low in March 2020 has all the look of a generational low. It was during the March 2020 pandemic crash that WTI oil actually went negative to -$37. The chart low is $6.50. No matter a price that low hadn’t been seen since 1973, before the Arab oil embargo of October that year—50 years ago.
Cycle analyst Ray Merriman (www.mmacycles.com) notes that oil really didn’t start trading until after the embargo was underway. As a result, there is a lack of history of peaks and troughs in oil trading before that time. WTI futures started in 1983. The first big jump in oil prices came in 1948 as prices almost doubled at that
time. It was pushed with unrest in the Middle East (where else). The Arab/Israeli war at the time played a role and, in the early 1950s, Iran elected a government under Mohammad Mosaddegh who nationalized the Anglo-Iranian Oil Company. In 1953, Mosaddegh was overthrown in a CIA/British arranged coup that restored the Shah of Iran as the leader.
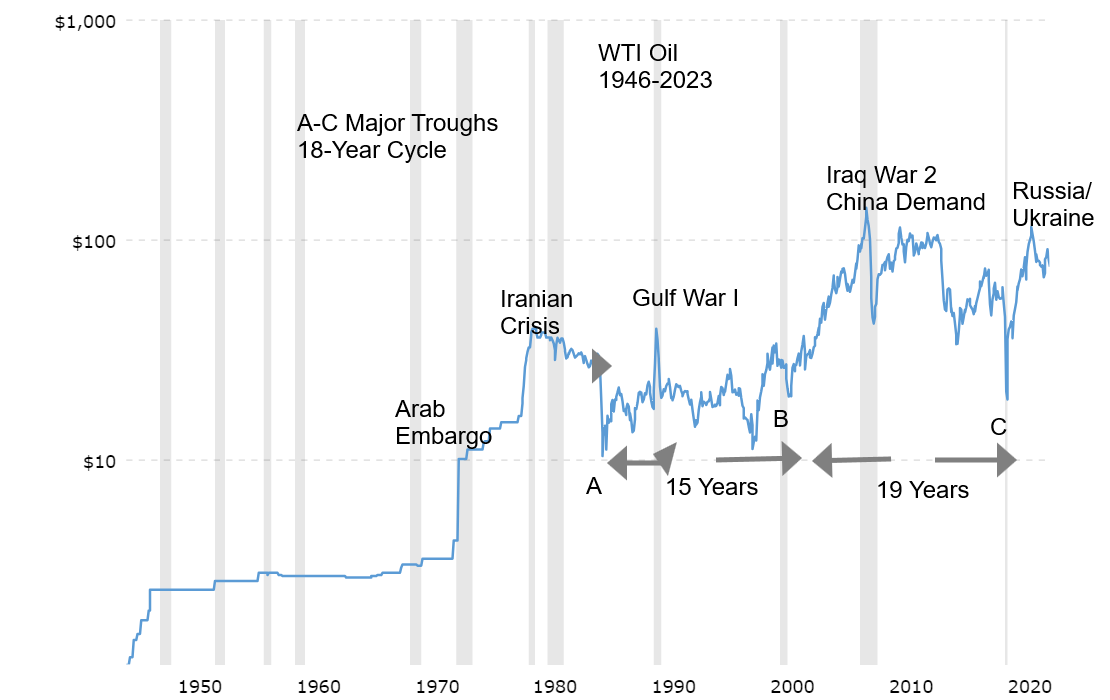
Nonetheless, Merriman cites a potential 36-year cycle in oil prices with a range of 30–42 years. From 1948, the next major low was in 1986 (38 years) followed by March 2020 low (34 years). The next subdivision of the 36-year cycle is an 18-year cycle with a range of 15–21 years. From 1986 we had a significant low in 2001 (15 years) followed by the March 2020 low (19 years). In theory, the next one won’t be seen until 2035–2041. Thus, we are in a new 18-year cycle. The question is, did we peak in March 2022 with the Russia/Ukraine war? The next cycle would be a 9-year cycle with a low due 2027–2031. The 9-year cycle could break down into two 4.5-year cycles or three 3-year cycles. If three years, then the low we saw in 2023 fits perfectly.
Our wave count suggests we made a 5-wave advance out of the March 2020 trough, peaking in March 2022. What unfolded next appears to be an ABC correction that bottomed in May 2023 at $63.57. If that’s correct, we may be on the next phase to the upside.
We note how WTI oil held the 4-year MA for the three years. The 4-year MA is currently at $69.80. With this recent pullback, we may be forming a 2-wave to the downside. A 3-wave to the upside could soon get underway with confirmation coming when it takes out the recent high at $95.03.
Natural gas (NG) also appears poised to move higher; however, the 4-year MA is currently at $3.76 and it is essential for NG to take that level out if we are to move higher.
WTI oil, along with NG, appears poised to move higher. By extension, that should translate into higher prices for energy stocks.
Markets & Trends
| % Gains (Losses) Trends
|
||||||||
| Close
Dec 31/22 |
Close
Dec 1, 2023 |
Week | YTD | Daily (Short Term) | Weekly (Intermediate) | Monthly (Long Term) | ||
| Stock Market Indices | ||||||||
| S&P 500 | 3,839.50 | 4,594.63 | 0.8% | 19.7% | up | up | up | |
| Dow Jones Industrials | 33,147.25 | 36,245.50 (new highs) | 2.4% | 9.4% | up | up | up | |
| Dow Jones Transport | 13,391.91 | 15,463.76 | 2.5% | 15.5% | up | up (weak) | up | |
| NASDAQ | 10,466.48 | 14,305.03 | 0.4% | 36.7% | up | up | up | |
| S&P/TSX Composite | 19,384.92 | 20,452.87 | 1.7% | 5.5% | up | up | up (weak) | |
| S&P/TSX Venture (CDNX) | 570.27 | 546.26 | 2.6% | (4.2)% | up | down | down | |
| S&P 600 (small) | 1,157.53 | 1,204.52 | 2.6% | 4.1% | up | up (weak) | neutral | |
| MSCI World | 1,977.74 | 2,141.74 | 1.2% | 8.3% | up | up (weak) | neutral | |
| Bitcoin | 16,531.31 | 38,872.49 (new highs) | 2.7% | 135.4% | up | up | up | |
| Gold Mining Stock Indices | ||||||||
| Gold Bugs Index (HUI) | 229.75 | 245.20 | 8.1% | 6.7% | up | neutral | down (weak) | |
| TSX Gold Index (TGD) | 277.68 | 292.57 | 7.1% | 5.4% | up | neutral | neutral | |
| % | ||||||||
| U.S. 10-Year Treasury Bond yield | 3.88% | 4.21% | (5.8)% | 8.5% | ||||
| Cdn. 10-Year Bond CGB yield | 3.29% | 3.43% | (7.8)% | 4.3% | ||||
| Recession Watch Spreads |
|
|||||||
| U.S. 2-year 10-year Treasury spread | (0.55)% | (0.34)% | 29.2% | 38.2% | ||||
| Cdn 2-year 10-year CGB spread | (0.76)% | (0.64)% | 13.5% | 13.8% | ||||
| Currencies | ||||||||
| US$ Index | 103.27 | 103.21 | (0.2)% | (0.1)% | down | neutral | up (weak) | |
| Canadian $ | 73.92 | 74.10 | 1.5% | 0.2% | neutral | neutral | down | |
| Euro | 107.04 | 108.81 | (0.6)% | 1.7% | up | up (weak) | down (weak) | |
| Swiss Franc | 108.15 | 115.04 | 1.5% | 6.4% | up | up | up | |
| British Pound | 120.96 | 127.13 | 0.8% | 5.1% | up | up | neutral | |
| Japanese Yen | 76.27 | 68.10 | 1.8% | (10.1)% | up | down | down | |
| Precious Metals | ||||||||
| Gold | 1,826.20 | 2,089.70 (new highs) | 4.3% | 14.4% | up | up | up | |
| Silver | 24.04 | 25.86 | 6.2% | 7.6% | up | up | up | |
| Platinum | 1,082.90 | 936.10 | (0.1)% | (13.6)% | up | down (weak) | down | |
| Base Metals | ||||||||
| Palladium | 1,798.00 | 1,010.40 | (6.0)% | (43.8)% | down | down | down | |
| Copper | 3.81 | 3.93 | 3.7% | 3.2% | up | up | neutral | |
| Energy | ||||||||
| WTI Oil | 80.26 | 74.07 | (2.0)% | (7.7)% | down | down (weak) | neutral | |
| Nat Gas | 4.48 | 2.81 | (6.3)% | (37.3)% | down | up (weak) | down (weak) | |
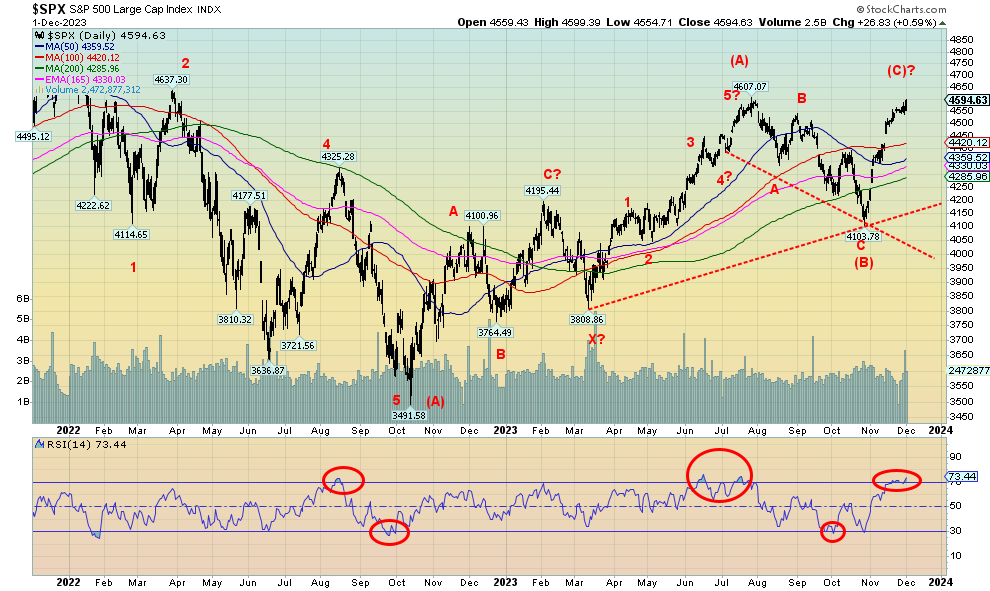
Driven by thoughts of the Fed pausing, the Fed cutting rates, inflation cooling, and bond yields falling, stocks continued their recent rally. But now things are getting a bit frothy. The RSI for the S&P 500 is over 70. For the Dow Jones Industrials (DJI), it’s over 80. The DJI made fresh 52-week highs, but nobody else did. It’s a non-confirmation; however, it’s early, so the others could still join the DJI. Unless things break down first.
On the week, the S&P 500 gained 0.8%. It was the fifth consecutive weekly gain. It also leaves the S&P 500 up 19.7% in 2023, a stellar year. Okay, it was a stellar year if you owned the big seven. Otherwise, not so great. As noted, the DJI made fresh 52-week highs, up 2.4% on the week. The DJI has been the best performer in this rally. The Dow Jones Transportations (DJT) is nowhere near its 52-week high, although it was up 2.5% on the week. The NASDAQ was the weak sister, up only 0.4%. The S&P 500 Equal Weight Index gained 2.4%, outpacing the S&P 500. The S&P 400 (Mid) was up 2.6% while the S&P 600 (Small) also gained 2.6%. Is the market rally broadening? It often does that at the end of a run. Bitcoin continued its recent run-up of 2.7% also to fresh 52-week highs. Bitcoin is the star, up 135.1% on the year. But the market is small.
In Canada, the TSX gained 1.7% thanks to Golds, while the TSX Venture Exchange (CDNX) was up 2.6%. In the EU, the London FTSE was up 0.6%, the EuroNext gained 0.7%, the Paris CAC 40 was up 0.7%, while the German DAX was the star, up 2.3%. In Asia, China’s Shanghai Index (SSEC) lost 0.3%, the Tokyo Nikkei Dow (TKN) was down 0.8%, while Hong Kong’s Hang Seng (HSI) lost a big 4.2%. Is Asia sending a signal?
Fed Chair Powell speaking welcomed decelerating inflation. Bond billionaire Bill Ackman says rate cuts are coming in Q1, but there will also be a hard landing, not a soft one. The Chicago Purchasing Manager’s Index (PMI) came in at 55.8, well above the expected recessionary 44, but the S&P Global PMI was a recessionary 49.4 and the ISM Manufacturing Index was also a recessionary 46.7. Two out of three were reporting recessionary conditions. The Chicago PMI was a complete surprise.
We’ve had a good 12% rally for the S&P 500 off those October lows. We are overbought. The Fear & Greed Index is showing greed. The Israel/Hamas war is starting up again, which is an unknown going into Christmas. Will we have the Santa Claus rally? If Santa Claus should fail to call, the bears may come to Broad and Wall. The January effect starts in mid-December. It’s been a stellar year (so far), so some may step up to dump their losers before year end. Or even take profits to lock it in. We are only 13 points from new 52-week highs for the S&P 500. Seems to be a chance we could see it this coming week. But if it fails? Then we could leave a double top on the charts.
A breakdown under 4,500 would be a negative sign. But we don’t really break down until under 4,300 and especially under 4,200. The trend is up—until it isn’t.
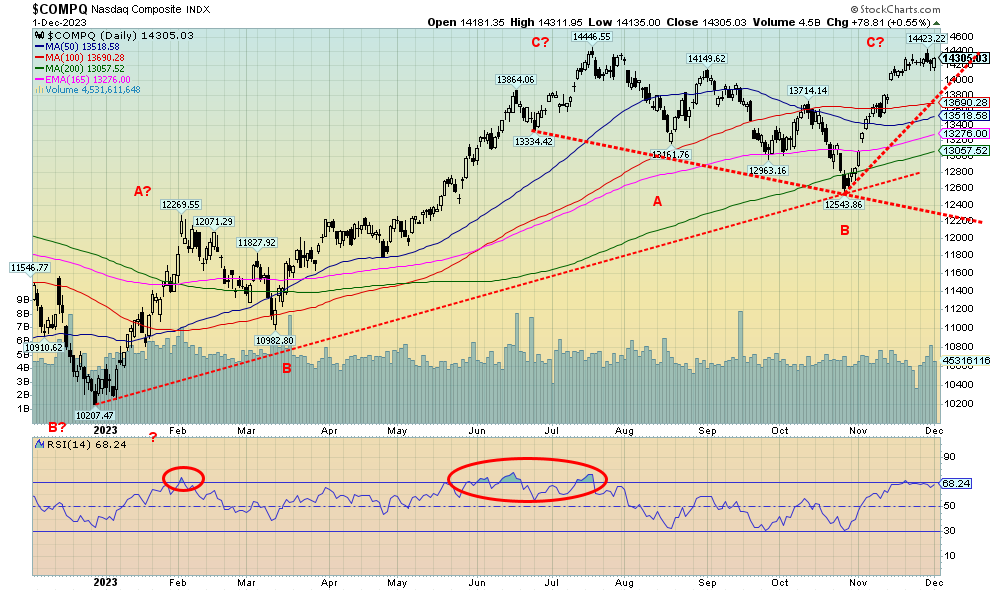
The NASDAQ gained only 0.4% this past week. The much-ballyhooed NY FANG Index, which contains the FAANGs that dominate the NASDAQ and the S&P 500, actually fell almost 0.9%. Is something amiss? This past week, while the DJI was making new 52-week highs and the S&P 500 was nearing its 52-week high, the NASDAQ actually faltered below its 52-week highs. The DJT is, as we note, is nowhere near its 52-week high. Is this a sign that something is amiss? When we look at the FAANGs we note that, of the 10 components, seven were down on the week, led by Meta (Facebook), down 3.8%. If one adds in non-NY FANG Index stocks like Baidu, Alibaba, and Advanced Micro, 10 of the 13 were down on the week. The big gainer was Snowflake, up 8.8%. Apple gained 0.8% while Amazon was up 0.2%.
The NASDAQ appears to be rolling over. However, it will take a break of 14,000 to help us confirm a potential top. The major breakdown line is down at 12,800. Below that, the NASDAQ enters a bear market once again.
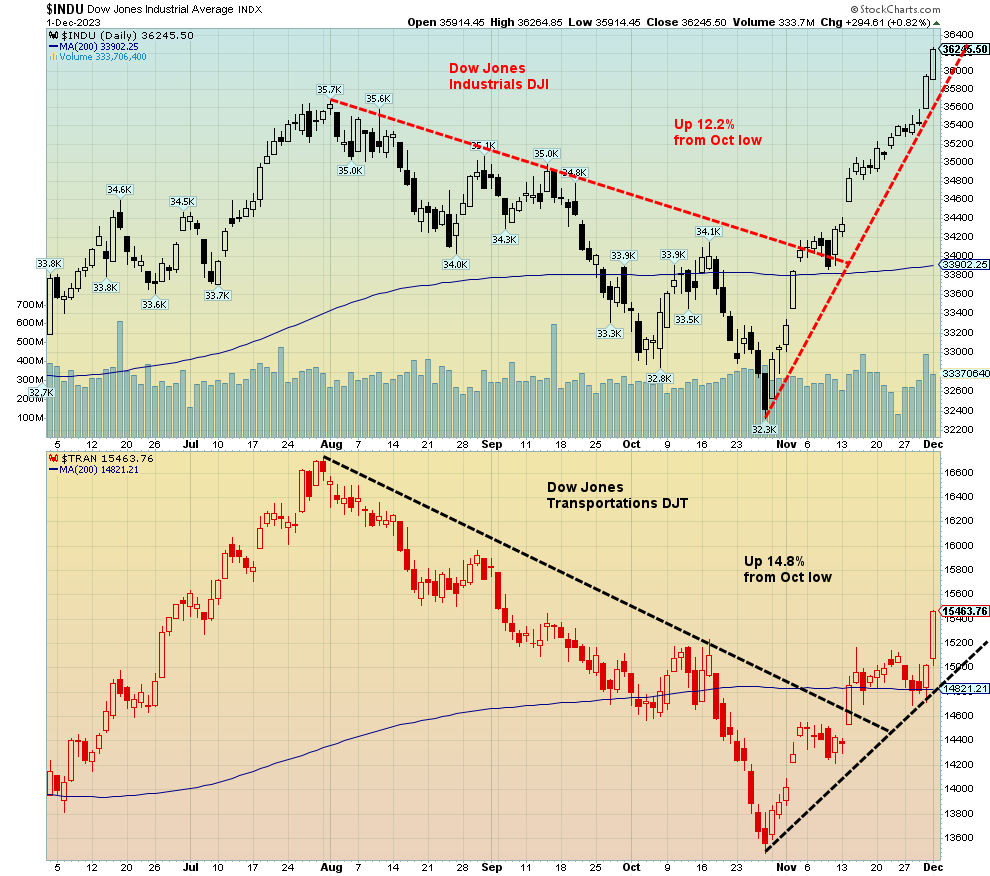
The DJT has gained 14.8% from that October low vs. the DJI only 12.2%. However, it’s noteworthy that the DJI made new highs, well over that late July high, while the DJT remains well down from that high. The DJI is clearly overextended now, some 6.9% above its 200-day MA, while the DJT is only 4.3% above its 200-day MA. The DJI is overbought with an RSI over 80 while the DJT’s RSI is only at about 68. Dow Theory says the averages must confirm each other. Right now, they are not. That’s a significant divergence and suggests to us that yes, we have seen a good rally but something is amiss.
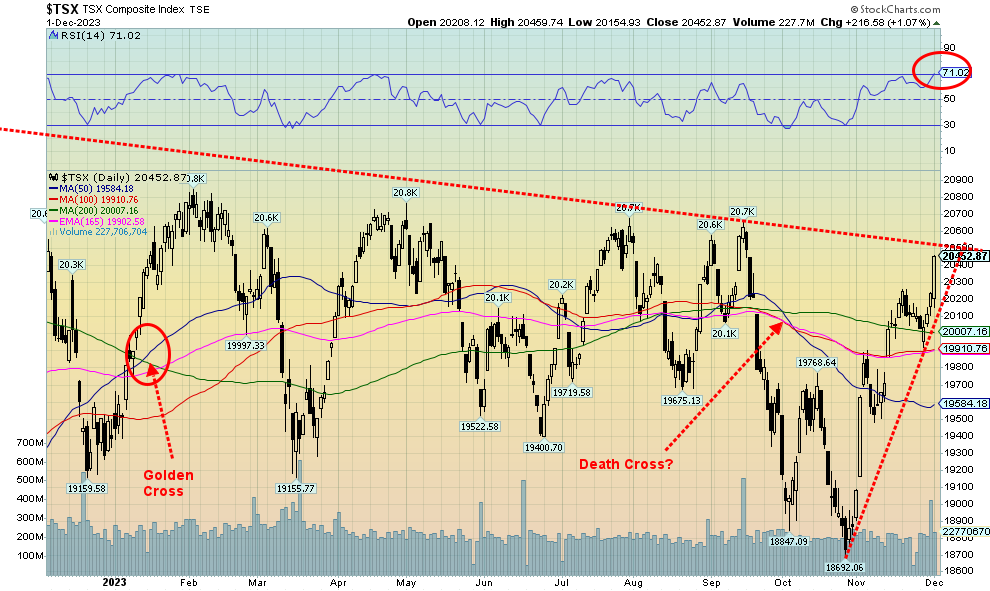
Is the TSX Composite poised to break out to the upside, ending that string of highs near 20,800? It certainly looks that way, given the up move this past week where the TSX gained 1.7%. But we now note we are overbought with the RSI over 70. We’ve also made almost a straight up move as the TSX has gained 9.4% since that low in late October. The breakout point appears to be at 20,500, but to be safe we’d prefer to see a good close over 20,600 to confirm the low and the breakout.
It must be a sign that the happy days are here again, as the only loser on the TSX this past week was Consumer Staples (TCS). If staples are not wanted, it must mean happy full stomachs. Of course, nothing could be further from the truth as the official recession hasn’t even started yet and the food banks are overflowing along with tent cities in the parks. Canada recorded negative growth in Q3 and signs are that Q4 won’t be much better. If we have two consecutive negative quarters of GDP, then we’ll be in an official recession. Markets are rallying on the expectation of inflation falling and the central banks, including the Bank of Canada (BofC), pausing and the possibility the central banks will start cutting rates as soon as Q1 2024. The markets could be in for a nasty surprise as this rally is too much, too fast.
Of the gainers, Golds (TGD) led the way, up 7.1%. Other good gainers were Materials (TMT), up about 4%, Metals & Mining (TGM), up 3.8%, and Health Care (THC), up 3.5%. The two largest components saw Financials (TFS) up 1.9%, while Energy (TEN) gained a small 0.2%.
U.S. 10-year Treasury Bond/Canadian 10-year Government Bond (CGB)
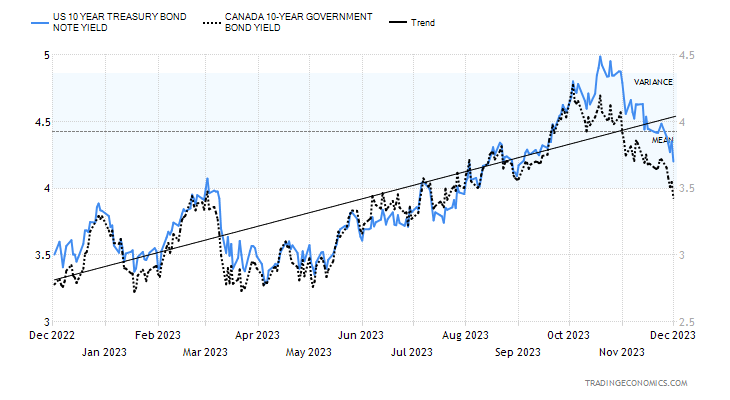
The bond bulls are getting all excited as the recent rally in bonds (yields falling, prices rising as prices move inversely to yields) is starting to see many predicting the days of rising bond yields are over. That seems to fly in the face of the sloppy bond auctions of late. With further credit rate cuts a possibility, record and growing debt not only in government but also consumer and corporate, and federal interest payments approaching $1 trillion annually, it seems almost insane that bond yields are falling instead of rising. But slowing inflation and signs that the job market may be weakening are helping to push yields lower along with might be a huge short squeeze. Thoughts that the Fed would cut rates in the first half of 2024 are driving this market. Bond billionaire Bill Ackman is predicting the Fed will cut rates in Q1. The reason is that the Fed keeping the Fed rate at 5.5% when inflation has fallen to 3% is a very high historical spread. It should come down.
The question, of course, is, will rates keep falling? This past week the U.S. 10-year treasury note fell to 4.21% from 4.47%. Canada’s 10-year Government of Canada bond (CGB) fell to 3.43% from 3.72%. With the falling yields for the 10-year, it is no surprise that the inverted yield curve is also falling. The U.S. 2–10 spread dropped to negative 34 bp from negative 48 bp, while the Canada 2–10 spread fell to negative 64 bp from negative 74 bp. All of this suggests that we are getting closer to the start of the recession. Often by the time the recession starts, the 2–10 spread has fallen to near-zero.
At the recent highs for the 10-year, the RSI did go over 70, suggesting it was overbought. As well, the recent high for the 10-year saw the yield higher but the RSI and other indicators were making lower highs. That suggested we should soon rally, and we did. We are not yet oversold.
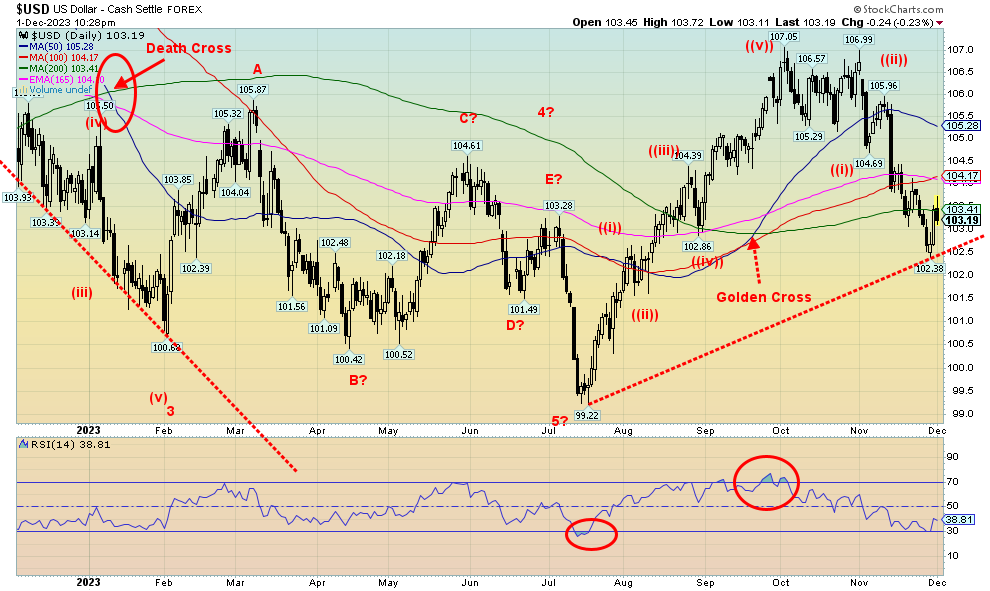
The US$ Index attempted to rally this past week, but 103.00/103.50 proved to be resistance and we fell back once again. On the week, the US$ Index fell about 0.2%. It would have been a higher close except Friday saw the US$ Index drop, thanks to some weak economic numbers. Strangely, the euro also fell this past week, off almost 0.6%. The gainers that helped the US$ Index not fall too much saw the Canadian dollar up 1.5%, the Swiss franc up 1.5% as well, the pound sterling up 0.8%, and the Japanese yen recouping, up 1.8%. A break now for the US$ Index below 102.50 could start the next decline. Holding support near there would suggest that the upward correction that started a week ago has further to go. Over 104.25, the index looks better, but the reality is we need to regain back above 105.25 to suggest that the low is in. Thoughts of a Fed pause or rate cuts and falling bond yields are helping to push the US$ Index lower.
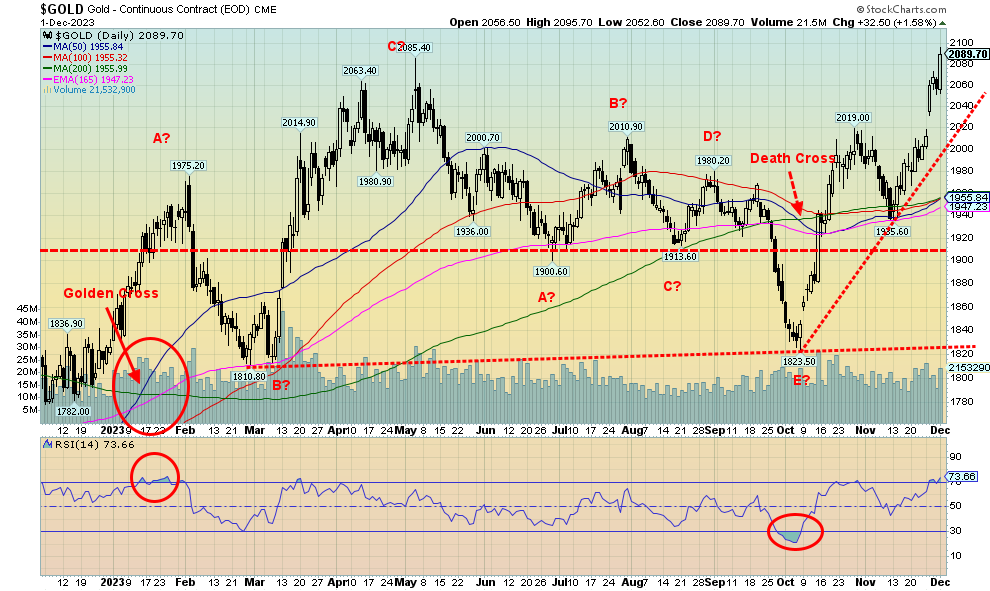
In some respects, we call it a surprise. The surprise? Gold made new all-time highs this past week, hitting a high of $2,095.70. While we had expectations of a new all-time high, we didn’t believe we’d get it so soon. Grant you, this is because February is now the front month futures. The gold chart above is a continuous contract, which means it always switches to the front month futures to track. Cash closed out at $2,072. Good, but not yet new all-time highs. When cash takes out $2,090, we’ll feel better. Still, the futures curve is in contango with prices higher as we go out further on the curve. Expectation then is for higher prices going forward. We also note we are close to a golden cross, after seeing a death cross occur in September. Pundits love those golden and death crosses, but they come late after the trend is underway and can whipsaw, as may soon be the case.
The potential for a Fed pause and even Fed rate cuts, signs of a slowing economy despite the strong Q3 GDP numbers, a weaker US$ Index, slowing inflation, and the outbreak once again of hostilities between Israel/Hamas have all sparked a rush once again to gold as a safe haven from geopolitical concerns. Then there are also the ongoing polarization and tensions on the U.S. domestic political scene that could yet turn the 2024 election into a nightmare. There are also impeachment discussions underway of President Biden from the Republican led Congress. The rise since mid-November has been swift as gold has gained roughly $155 or about 8%. That has dragged silver up as well, and the gold stocks have also enjoyed a good up move.
This past week, gold gained 4.3% to new all-time highs. Silver was up 6.2%, but is nowhere near its all-time high. The Gold Bugs Index (HUI) was up 8.1% while the TSX Gold Index (TGD) gained 7.1%. But elsewhere it was not so rosy. Platinum lost about 0.1% while palladium fell 6.0%. However, copper gained 3.7%.
The odds are high now that we could soon break over $2,100. That could also bring in new players. We even saw some movement this past week in junior gold miners. Hopefully, they are at least stirring from their long (depressive) slumber. Over $2,100 and new players coming in could push the price even higher. As gold pundit Doug Casey noted, the gold market is so small it is like trying to push the contents behind the Hoover Dam through a garden hose.
However, given the overbought conditions with the RSI at 73.6, a pullback and profit-taking would not be surprising. On the other hand, overbought is just a condition and does not necessarily suggest that a top is at hand. The commercial COT for gold has fallen to 25.7%, down from over 30%. So that’s another cautionary sign as the commercials load up on shorts. In the powerful market of 2009–2011, the commercial COT was constantly below 30%, and yet it didn’t stop the market from going higher. During the 2009–2011 bull there were a couple of 10% plus pullbacks.
Nonetheless, a breakout over $2,100 appears to be when, not if. However, we’ll feel better when cash gold also breaks out over $2,100. We have positive seasonals in favour of gold here as well. A break under $2,060 would be a cautionary sign. But we’d have to break under $2,020 to suggest that the rally is over. Under $2,000, it would be over.
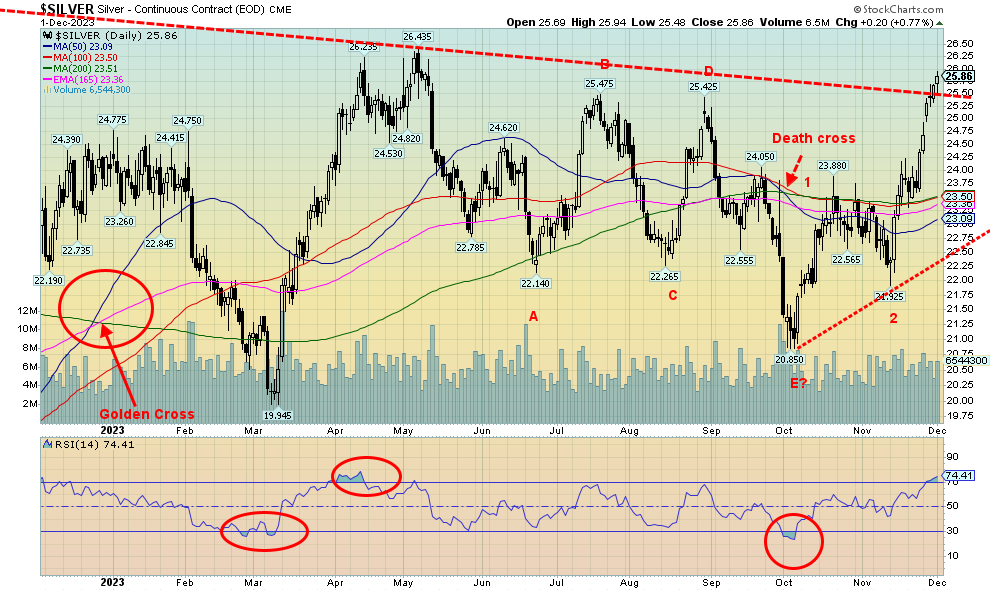
Is silver breaking out? We appear to have penetrated above the trend line coming down from the February 2021 high of $30.35 that hooks up with the April 2023 high of $26.44. Nonetheless, we’d feel better if silver cleared over $26 on a close basis to confirm the breakout. The commercial COT has fallen to 31.4%, down from recent levels of 35%. So that’s a bit of a cautionary sign. We note that the daily RSI is now at 74.41, which is overbought. It is not supportive of any strong moves from current levels without at least some kind of pullback to ease the overbought conditions.
While gold is making new all-time highs, silver remains well below its all-time high of $49.82 set in 2011. It’s a divergence that has always bothered us as to whether this rally continues or not. Normally we’d prefer to see both gold and silver making new highs together, not diverging widely as is the present case. The rally since the low of $24.93 in November has been straight up. It is a condition that is usually not sustainable without some sort of pullback. However, having successfully taken out $25/$25.25, it suggests we should see new highs above $26.44, the April high. A move above $27.30 could suggest we’ll see new highs above $30.35. We’d have to get above $41 to suggest we could see new all-time highs.
Since we can’t take anything for granted, a move back below $25 would be a caution but a move back under $24 could suggest a high is in. Under $23 and we’re looking once again at the recent lows. We have positive seasonals in our favour. But taking out $26 on a close basis would reassure us that we should go higher.
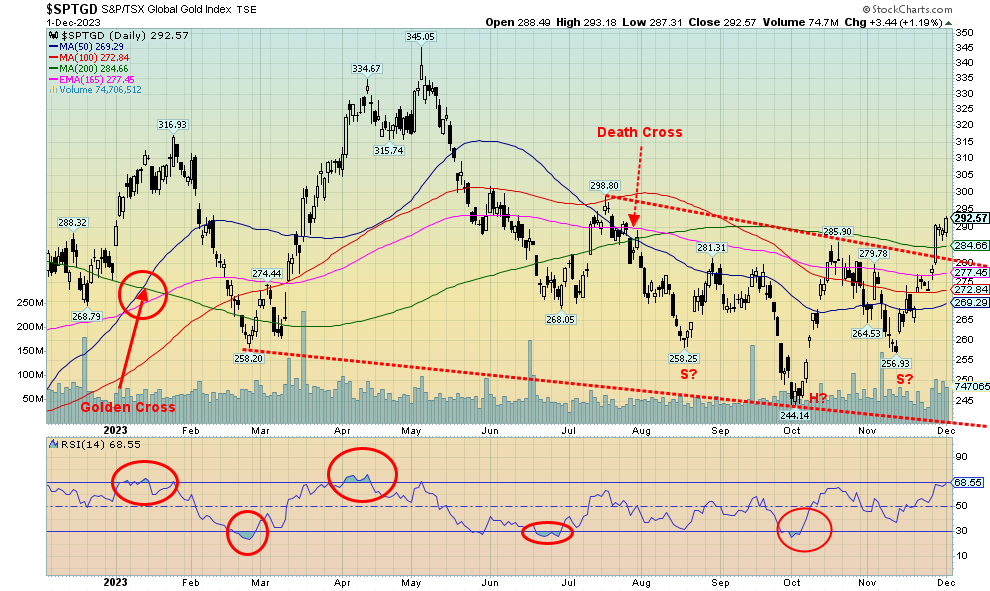
Gold stocks appear to have broken out this past week. We broke above resistance near 280, then cleared resistance at the 200-day MA near 285. By clearing above 280 we may have broken the neckline of a possible head and shoulders bottom pattern. Potential targets for the TSX Gold Index (TGD) are up to 335. That would still leave us short of the May high of 345. Another measurement could suggest a run-up to 380. To do that, we’d have to take out the May high of 345.
The gold stocks enjoyed a stellar week, thanks to a new record for gold. The TGD gained 7.1% while the Gold Bugs Index (HUI) was up 8.1%. What’s key now is we hold above 280 on any pullback. One concern is that the RSI hit 68.55 this past week. Not overbought but getting close. However, if the rally is strong enough, overbought is merely a condition. Usually if we get overbought, we look at some profit-taking and also to not add any new positions. The Gold Miners Bullish Percent Index (BPGDM) is up to 53.6. That suggests it has further to move higher before becoming overbought. Once the index is above 75, caution is advised. We have room to move higher. The recent low was at 10.7 in October. Anything below 25 is considered oversold.
Nonetheless, it is not unusual following a move like this that some profit-taking steps in. That could occur early this coming week. But, as noted, as long as we stay above 280, we should be good. The market doesn’t become dangerous again unless we were to break under 270.
A very confusing week for the oil market. Once again, OPEC + has decided to cut production, this time by 2.2 million barrels per day (bpd) in Q1 2024. What did the market do? It fell. WTI oil lost almost 2.0% on the week while Brent crude fell almost 2.5%. Natural gas (NG) didn’t fare much better. NG at the Henry Hub was down 6.3% while at the EU Dutch Hub NG fell 6.8%. Did the energy stocks get dumped? No, as the ARCA Oil & Gas Index (XOI) rose 0.4% while the TSX Energy Index (TEN) gained a small 0.2%.
So, what’s happening? They thought they were going to cut more. The weather has been warmer. U.S. reserve stocks have been filling up, even as they remain below peak five-year range. However, we are moving into the traditional strong seasonal period for both oil and gas. That might help. And, as well, the Israel/Hamas war is heating up again. That doesn’t impact oil directly, but attacks could erupt once again against U.S. bases in Iraq and Syria. The U.S. accuses them of being Iranian proxies. That in turn could spark a clash with Iran, which sits adjacent to the Straits of Hormuz where 30% of the world’s oil flows through. Hezbollah in Lebanon has also upped attacks against Israel as have the Houthis of South Yemen. Hezbollah and the Houthis are alleged Iranian proxies as well. Any attack against Iran could spark a sharp rise in oil prices.
With the drop this past week, there is a danger we’ll see new lows below $72.37, the most recent low. A drop below $71 and we could be potentially looking at new lows under the May low of $63.57. The recent pattern is taking on the look of a fourth wave. That suggests that the $72.37 low could be taken out. Regaining above $80 would suggest that we’ve made a low. But we need to get back above $90 to even begin to suggest that we have made our low and are embarking on an up wave.
NG is also suffering. A break of $2.80 would not be good. Under $2.65 and we could well probe even lower back towards the April 2023 lows near $2.
All does not look well with the energy commodities right now. But there are factors plus seasonals that could change that narrative. As we noted with our chart of the week, the longer-term outlook looks better than the short-term outlook today.
__
(Featured image by AbsolutVision via Pixabay)
DISCLAIMER: This article was written by a third party contributor and does not reflect the opinion of Born2Invest, its management, staff or its associates. Please review our disclaimer for more information.
This article may include forward-looking statements. These forward-looking statements generally are identified by the words “believe,” “project,” “estimate,” “become,” “plan,” “will,” and similar expressions. These forward-looking statements involve known and unknown risks as well as uncertainties, including those discussed in the following cautionary statements and elsewhere in this article and on this site. Although the Company may believe that its expectations are based on reasonable assumptions, the actual results that the Company may achieve may differ materially from any forward-looking statements, which reflect the opinions of the management of the Company only as of the date hereof. Additionally, please make sure to read these important disclosures.
Copyright David Chapman 2023
David Chapman is not a registered advisory service and is not an exempt market dealer (EMD) nor a licensed financial advisor. He does not and cannot give individualised market advice. David Chapman has worked in the financial industry for over 40 years including large financial corporations, banks, and investment dealers. The information in this newsletter is intended only for informational and educational purposes. It should not be construed as an offer, a solicitation of an offer or sale of any security. Every effort is made to provide accurate and complete information. However, we cannot guarantee that there will be no errors. We make no claims, promises or guarantees about the accuracy, completeness, or adequacy of the contents of this commentary and expressly disclaim liability for errors and omissions in the contents of this commentary. David Chapman will always use his best efforts to ensure the accuracy and timeliness of all information. The reader assumes all risk when trading in securities and David Chapman advises consulting a licensed professional financial advisor or portfolio manager such as Enriched Investing Incorporated before proceeding with any trade or idea presented in this newsletter. David Chapman may own shares in companies mentioned in this newsletter. Before making an investment, prospective investors should review each security’s offering documents which summarize the objectives, fees, expenses and associated risks. David Chapman shares his ideas and opinions for informational and educational purposes only and expects the reader to perform due diligence before considering a position in any security. That includes consulting with your own licensed professional financial advisor such as Enriched Investing Incorporated. Performance is not guaranteed, values change frequently, and past performance may not be repeated.


Avant Devices Moves Toward Electric Wheelchair Kit Production with New Funding Drive
Murcia-based Avant Devices is seeking €260,000 in crowdfunding to launch mass production of its electric wheelchair conversion kit. The funds...


Legend Biotech: Growth Driven by CAR-T Innovation and Carvykti Expansion
Legend Biotech's stock reflects demand for innovative CAR-T cancer therapies. The US biotech focuses on commercializing Carvykti with partner Janssen...


Senegal’s Debt Strategy: Choosing Between Restructuring and Financial Innovation
Senegal’s upcoming choice of debt advisor, with Lazard reportedly leading the race, reflects a broader strategic decision. Rather than pursuing...


Pictet Raises $253 Million for Environmental Investment Fund
Pictet Group closed its Environment Co-Investment Fund I at $253 million, surpassing its $200 million goal. The Article 8 SFDR...


Virginia Cannabis Market Could Reshape Regional Competition
Virginia’s planned recreational cannabis market could reshape the Washington region’s economic landscape. With nine million residents, it may draw consumers...
 |
|
 |  |
 |
|
-

 Crypto1 week ago
SpaceX Bitcoin Move Sparks Debate Amid Market Uncertainty
-

 Impact Investing2 weeks ago
ReLife Recycling Acquires Palcart Recycling Operations in Verona
-
 Crypto4 days ago
Bitcoin Rally Faces Tests from Fed, ETFs, and Market Fear
-

 Impact Investing1 week ago
Milione Secures €80M EIB Financing to Drive Venice Airport’s Green Transformation