Featured
A look at the markets since Trump’s election
Data show that economic changes since Trump’s election are mostly positive, such as employment and unemployment rates, but Federal debt is rising.

Well, the election turned out close to what was predicted. The Democrats took over the house, but by a modest margin. The Republicans picked up at least two and likely three Senate seats, making their control there more solid.
The truth is that the Democrats should have done better with a first-term president who is wildly unpopular and their focus on the number one issue of health care.
I warned on Monday that the Democrats just don’t seem to have the energy and anger that the Republicans do. They didn’t turn out in the numbers they need to make a bigger win.
I judge it by the markets.
The Dow Futures the day after election looked to an open nearly 200 points up. That means the Republicans had a modest victory.
Trump had almost everything going for him going into these midterms. The economy is going gangbusters thanks to his tax cuts, cash repatriation, and pro-business policies. Yet he chose to focus more on immigration and the caravan threat, throwing out more hyperbole and exaggeration.
In short, the Democrats AND the Republicans were their own worst enemies!
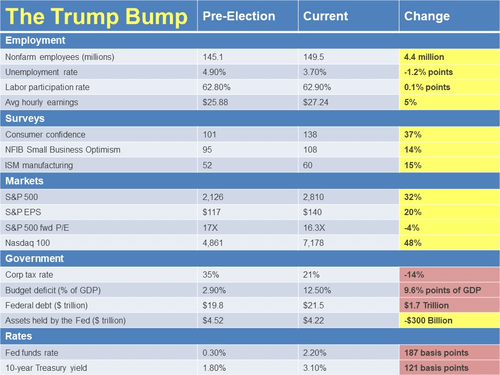
If we look at this table, you’ll see I try to quantify the “Trump Bump.” This is what we get looking at now compared to pre-election…

© Harry Dent
This table shows the economic changes since Trump was elected, and they’re mostly positive in the short term. The positive impacts are highlighted in yellow and the negative in red.
On the economic front, it’s all positive: 4.4 million added employment, the unemployment rate down by 1.2 percentage points (from 4.9 percent to 3.7 percent), and best of all for Main Street, hourly wages up 5 percent after being stagnant for almost two decades.
The labor participation rate went up only 0.1 percentage point, but I would call that a modest plus because that number is slowing heading down due to Baby Boomer retirement.
The only negative is those rising wages are stirring up inflation and interest rates.
In general, surveys were very positive. Consumer confidence is near the high in 2000 and is up a whopping 37 percent.
People weren’t feeling that good about the recovery before Trump.
Small Business Optimism is also up 14 percent. And the ISM manufacturing index is up 15 percent.
All good!
Maybe too good…
The stock markets, of course, go gangbusters in a stimulus-driven bubble… and this one is the one to end all bubbles.
The Nasdaq is up 48 percent, the S&P 500 32 percent, and S&P EPS up 20 percent. Somehow the forward P/E (prince/earnings) ratio went down a bit. That’s also a plus for slightly less overvaluation.
But…
Yes, corporate tax rates are down 14 percentage points (a whopping 40 percent). That’s good for corporations and the top 1 percent to 10 percent of the population that largely own them. But they do little good for Main Street.
And the budget deficit as a percentage of GDP is up from 2.9 percent to 12.5 percent, or 9.6 percentage points. That’s horrible! In fact, it’s a record in boom times. Just imagine how devastating it’s going to be in a deep recession or depression ahead.
The Federal debt is up 9 percent in two years. At that rate, it’ll be $33 trillion by the end of 2024 (assuming Trump has a second term), and much more if we have the great downturn I see.
Unfortunately for us all, my original forecast of another doubling of Federal debt in eight years, to near $40 trillion by the end of 2024, is possible!
And short- and long-term borrowing costs are rising.
Up 1.87 percent points (187 basis points) for Fed funds.
Up 1.12 percent for corporate and mortgage, long-term borrowing (and likely to rise another 0.9 percentage points in the next year, by my best calculations).
It’s these negatives that continue to reinforce my belief that now is NOT the time to continue the greatest over-stimulus program in history.
Like any addiction, financial drugs never work out well when taken to excess…
And at this point, we’re well beyond excess.
We should see the real costs from debt deleveraging and financial bubbles bursting come due between 2020 and 2023.
—
DISCLAIMER: This article expresses my own ideas and opinions. Any information I have shared are from sources that I believe to be reliable and accurate. I did not receive any financial compensation for writing this post, nor do I own any shares in any company I’ve mentioned. I encourage any reader to do their own diligent research first before making any investment decisions.

-

 Markets1 week ago
Gold’s Historic Surge and Sudden Crash Signal Volatility, Not Defeat
-

 Africa7 days ago
Ivory Coast Development Plan 2026–2030: Investment, Growth, and Strategic Reforms
-

 Biotech2 weeks ago
Eli Lilly Enters Recombinase Gene Editing Through Strategic German Partnership
-

 Crypto3 days ago
Bitcoin Rebounds Above $70K as Crypto Markets Show Fragile Signs of Recovery


You must be logged in to post a comment Login