Featured
Markets unaffected by Trump’s decision to move the US embassy to Jerusalem
The U.S. economy improving and the job market growing amid Trump relocating the US embassy from Tel Aviv to Jerusalem.
Could we have reached an important crossroads in history with the announcement from President Trump that they are moving the U.S. embassy to Jerusalem? The move has been widely condemned even as it has been praised in some quarters. The move has already triggered protests, riots, and violence. Some view it as a declaration of war as rockets have been fired from Gaza. The move comes against the backdrop of ongoing Israeli bombing into Syria against military installations of Syria, Iran, and Hezbollah even as there has been no formal declaration of war.
What all of this is doing is setting up the potential for a wider war in the Mid-East, a region of the world already aflame, particularly in Syria and Yemen. A wider war could eventually bring in the global powers USA (NATO), Russia, and China, all of whom have military in the region and are aligned on different sides in the conflicts. Any outbreak of war could have serious ramifications for global markets. We have seen this happen before as stock markets fell on the outbreak of WW1, WW2 and the events surrounding 9/11.
Nevertheless, do markets care? It seems not. The U.S. economy is growing, 3.3% in the 3rd quarter and 2.3% year over year to the 3rd quarter. The job market continues to grow: 1.7 million new jobs according to the monthly nonfarm payrolls in the past year including 228 thousand in November, which was above expectations. The official unemployment rate, currently at 4.1%, is at a 17-year low. The stock markets are at record highs, and, while interest rates have been rising they are still lower than they have been at any point before 2008.
The markets appear to be ignoring potential war drums, political investigations and record high debt. Some are calling what is happening in markets a melt-up (especially Bitcoin). But not everyone has joined the party. The one sector that has been missing the boat is precious metals, led by gold. Given that one sector has been on a tear and almost consistently in the overbought territory now for some time while the other has been falling and is approaching oversold territory, could the two be close to changing places? Could the stock markets be approaching their zenith even as the gold and precious metals market approach a potential nadir? In other words, a crossroads.
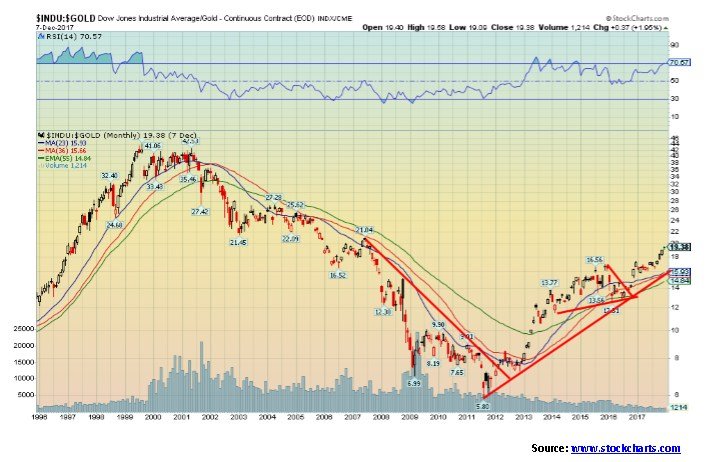
The chart below shows the Dow Jones Industrials (DJI)/Gold ratio. When the ratio is rising, the DJI is outperforming gold. If the ratio is falling gold is outperforming the DJI. Since making a bottom in August 2011, the DJI has been outperforming gold. The ratio topped way back in August 1999 at a then-record 44. In September 1999, the ratio broke to the downside and then spent the next two years in a sideways pattern. In September 2001, the ratio broke for good and for the next ten years gold was favored over the DJI (representing stocks).
© David Chapman
The trend for the DJI/Gold ratio is up as is the trend for the DJI. Gold’s trend has been down. Given a strong economy (or at least the perception of one) coupled with rising interest rates along with a stronger US$ of late there appear to be few compelling reasons to own gold. Even Bitcoin, a cryptocurrency that has only been around for a few years and appears to be in a bubble mania is favored more than gold. Yet gold has been a long-term store of wealth for 5,000 years. It seems that gold is trash. Of course, gold has been through that before.
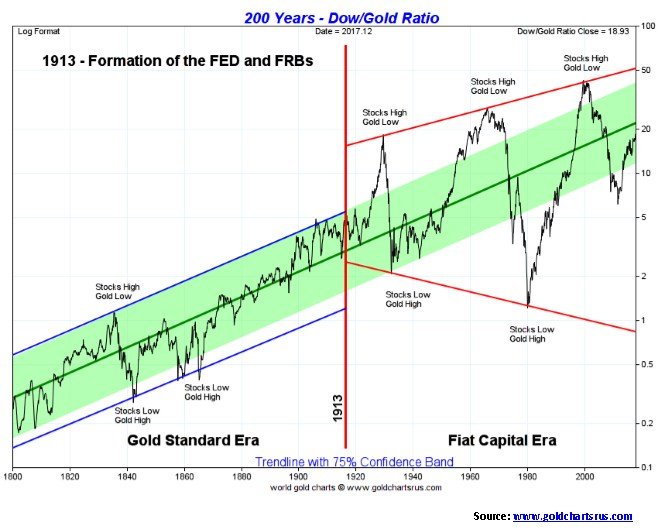
The DJI/Gold ratio has a long history. Our chart below shows it from 1800. For over 100 years, the DJI/Gold ratio rose within a steady rising band. Following the formation of the Federal Reserve in 1913, the DJI/Gold ratio has taken on a far more volatile life. The ratio rose sharply into the stock market top of 1929 only to be followed by a collapse during the Great Depression. Following several years of bouncing around, the ratio took off once again in favor of stocks in the 1950s only to once again top in the mid-1960s. Following the end of the gold standard in August 1971, the DJI/Gold fell rapidly in favor of gold. There was a brief respite when the ratio bounced back in the mid-1970s before once again returning in favor of gold. The ratio bottomed in 1980 when gold topped out at $875.
Once again, a long ascent in favor of stocks got underway before topping as noted in 1999. As we saw in the 1970s, the ratio found a low and started a significant rebound in the middle of the decade as the Watergate crisis eased with the resignation of Richard Nixon and, at least temporarily, the Arab oil embargo eased. Many have compared the current action in the DJI/Gold ratio to be similar to what occurred in the mid-1970s. Once the ratio shifts back in favor of gold, many are expecting gold to shine as the stock markets fall.
© David Chapman
Gold performs best during periods of political and financial stress. The events of the Great Depression and war (WW2) were ideal for gold to outperform stocks. During the 1970s political tensions with Watergate coupled with oil embargos, sharply rising inflation and the Iranian crisis helped push the DJI/Gold ratio in favor of gold. The events following the financial collapse of 2008 once again helped propel gold to outshine the stock market as there was fear of financial collapse and instability in governments in both the US and the EU.
Since 2000 gold has been the best performing asset, outperforming the DJI by almost 3 to 1. Most of that occurred by 2011 and since then, the DJI has outperformed gold. Rising geopolitical tensions in the Mid-East and even North Korea, coupled with the potential for government instability with the Russian investigation that has already resulted in indictments, could again propel gold higher as the stock markets falter. If a debt crisis were to erupt given the high level of global debt, it would add to the instability.
Complacency is high in the stock markets even as sentiment has been plunging for gold. A historic crossroad may have occurred with the movement of the U.S. embassy to Jerusalem, resulting in geopolitical instability that could cause both a fall in the stock market and an upward reversal for gold. However, if the focus remains on tax bills and the economy, and the movement of the embassy proves to be nothing more than a “tempest in a teapot,” then stock markets could continue their relentless climb higher and gold could continue to languish. Crossroads are like that. The fork you take may turn out to be the same as the fork you left.
Bitcoin Watch!
© David Chapman
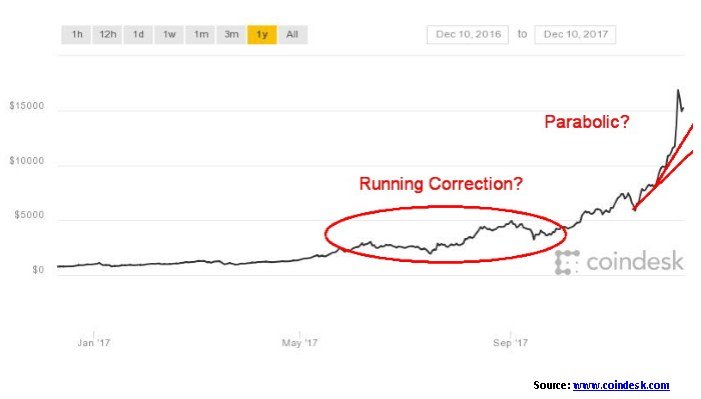
Bitcoin just leaves one breathless. A week ago, Bitcoin was trading around $10,500. On Friday, December 8, 2017, Bitcoin hit yet another all-time high of $17,153 then reversed and plunged to $13,963, an 18.5% drop, before rebounding. Yes, a $3,190 plunge from the high, all in a few hours. No wonder we are breathless. That wasn’t all, as Bitcoin rose once again to over $16,000 only to plunge right back to $14,000. Currently, it sits somewhere in the middle of this zaniness. At the high, Bitcoin was up almost $7,000 in a week or 64%.
Despite the craziness, I picked up a piece saying that this is nothing, that Bitcoin will rise 10 times the current price in the next 12 months. And it could even rise 100 times. Bitcoin $150,000 or Bitcoin $1,500,000? Is this for real or utter insanity? How can anyone get involved in such volatility? However, many are especially in Japan, Korea.
We wonder what the advent of Bitcoin futures is having on the market. Bitcoin futures are to begin trading on not one but two regulated exchanges. The CME gets underway on Dec 18. But the CBOE is trying to get a head start and it will start trading on Dec 10.What this will do is allow investors (if you want to call them that) both institutional and retail to get involved with Bitcoin without having to deal with cryptocurrency exchanges and wallets. With futures, we will also be able to get some view into volume in the market. And will Bitcoin futures become even bigger than Bitcoin itself? After all the gold futures market is over 10 times larger than the physical gold market.
But one has to wonder—is the current phase merely another up move before even bigger up moves get underway. We don’t know, but we do know that regulators are circling. What we have learned according to Martin Armstrong, an economic forecaster, is that all the government has to do is to change the definition of money. The government could change the rules such that digital currencies and digital exchanges are financial accounts and financial institutions. Currently, Bill S.1241 is working its way through a Senate Judiciary Committee. If successful, that would allow the government to go after participants and catch them for tax evasion. Miners of Bitcoin would, in essence, become a bank.
However, we have also been reading about all sorts of problems. Apparently, customers on the Bittrex Exchange were having trouble withdrawing money. The problem has been ongoing. Bittrex is one of the largest cryptocurrency exchanges trading in excess of $1 billion daily. Given the wildness of the Bitcoin price if one can’t get their money out it is a big problem. Delays in cashing out could wipe them out if the market moves against them. In another story, hackers breached NiceHash, a cloud-based system for mining cryptocurrencies, and stole a large quantity of Bitcoins from a virtual wallet. Such is life in the world of Bitcoin and cryptocurrencies. The question begs with these stories and the price volatility—why would anyone want to get involved? Yet many do.
Last week we wrote that our next target for Bitcoin was $14,850. Well, that turned out to be merely a pause point. So is there a next target? Well, the next one we have calculated is up at $18,600. That could be there on Monday.
The price we quote each week for Bitcoin is in US$ so one Bitcoin = US$15,250. So what is one U.S. Dollar worth? Well $1 = 0.000065574 Bitcoins. Not sure how that is divided up. So if one could use Bitcoin to buy a coffee and say the coffee was $3 then the coffee would cost 0.00019672 Bitcoins. Of course, that’s absurd as one cannot buy a cup of coffee with Bitcoin. If Bitcoin were quoted in Cdn$ then Bitcoin = Cdn$19,627 with the Cdn$ at 1.2870. And remember with that cup of coffee the price in Bitcoins could be higher or lower in an hour with the price moves these days. The rapid rise of Bitcoin means that the US$ and all other fiat currencies are crashing vs. Bitcoin.
Yet, despite the above issues and others, many believe Bitcoin will keep on rising. Only 1,500 Bitcoins are created each day and it will eventually be capped at 21 million. The new supply of Bitcoin also occurs at diminishing rates. Many believe that countries will not be able to stop Bitcoin and other cryptocurrencies through legal means. Witness Korea, where they banned new ICOs. Yet, Koreans are now widely accepting Bitcoin as a hedge against North Korea and their own unstable government, a characteristic more associated with gold. The world’s highest trading volumes for Bitcoin and cryptocurrencies occurs in Japan.
Whatever happens, it appears that cryptocurrencies are not going away. Indeed, they have become mainstream as we see articles in financial newspapers and discussions on financial TV on a daily basis now. So is it a mania, a bubble that will eventually crash? Many believe it is but then there are many who believe it is only going to go higher. It appears to have become a religion.
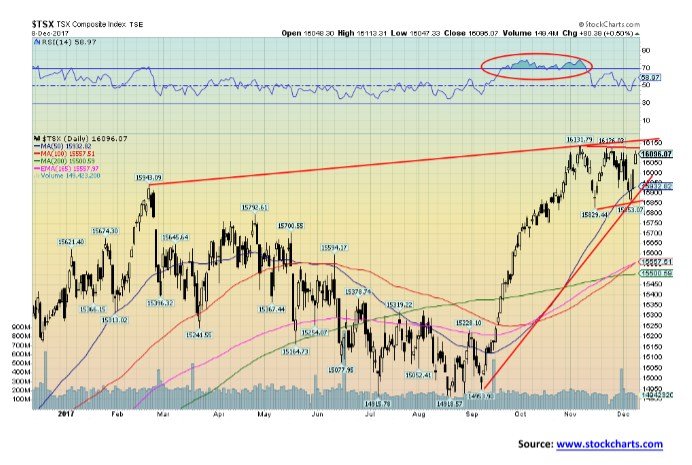
MARKETS AND TRENDS
© David Chapman
Note: For an explanation of the trends, see the glossary at the end of this article.
New highs/lows refer to new 52-week highs/lows.
© David Chapman
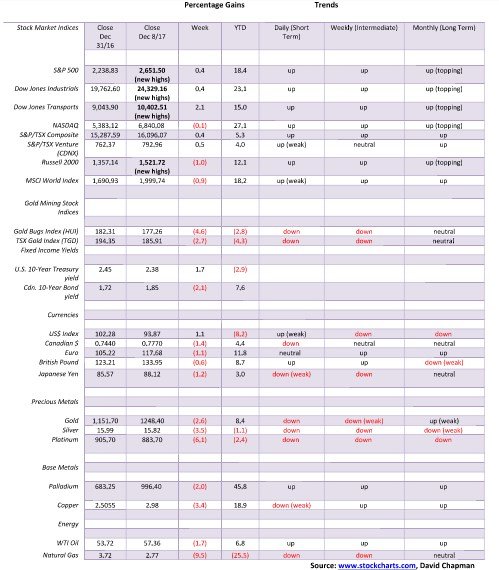
Another week, another new all-time high. Grant you, it was a spike high on December 4, 2017 that actually reversed and the market closed lower leaving a bit of a dark cloud on the chart. The high at 2,665 was just above our original target of 2,658 (which was hit the previous week). Failure to close above the level leaves open to interpretation as to what the next move might be. Oddly enough, the spike high came on what is known as a supermoon. It is also known as the Full Cold Moon and the Moon of the Long Nights. It is extra big and bright. The full moon was on December 3 and then the next day the market opens higher and reverses.
One of the main things pushing the market higher was the wide expectation of the passage of the tax bill. The passage of the bill was expected to be positive for the stock market. The bill was being passed with haste (apparently with handwritten notes in it) and few had opportunities to really read it. The bill contains cuts to health care benefits and education while according to forecasts could add from $1 trillion to $1.5 trillion to the deficit. The primary beneficiaries are the wealthiest.
The CBOE put/call ratio has reached a four-year extreme in favor of the bulls. Sentiment charts for both institutions and retail investors are at extreme highs in favor of the bulls. Cash allocations are very low. This has forced us and others to ask if everyone is so bullish and has already bought who is left out there to buy? None of this, of course, holds any meaning as long as the market keeps marching higher. As we noted in last week’s commentary you can lead a horse to water but you can’t make him drink.
After pulling back, the market is attempting once again to make new highs. If they should fail then a break under 2,625 and especially under 2,600 would be a sign that we are at least going to have a corrective period. Under 2,550 would be another sign of weakness. A more serious break would not occur until we broke under 2,400 and the 200-day MA. At that point, one would have to surmise we could be starting a bear market.
© David Chapman
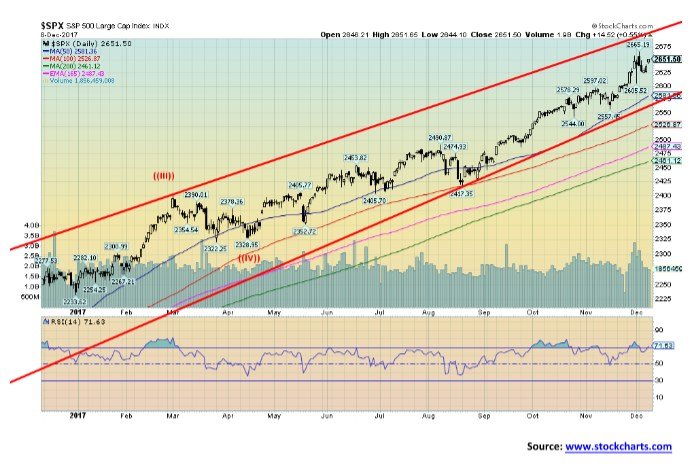
The VIX Volatility indicator, a measurement of fear and greed in the market made an all-time low back in November at 9.14. Despite what appeared to be only a minor pullback the VIX shot all the way up to 13.13. Despite making new all-time highs once again the VIX failed to make a new low, a divergence. Another pull back shot the VIX northward once again but it only reached 11.68. Now it is falling once again currently at 9.58. The extreme on the VIX is a sign of complacency in the market or, as one might say, maximum greed. We have had periods like that in the past but in the end markets self-correct to the mean. If it gets out of whack one way it has a nasty habit of snapping the opposite way to regain the balance. The longer it goes up the potential for a nasty snap in the opposite direction. At the bottom of the market in 2008 the VIX hit a record 80.86. Other spikes such as the 2011 and 2015/2016 market corrections saw the VIX rise to 40 and higher. As with numerous other signs the VIX is just an indicator suggesting how overbought the market is. It does not tell us that there will actually be a major top, or when that top might occur.
© David Chapman
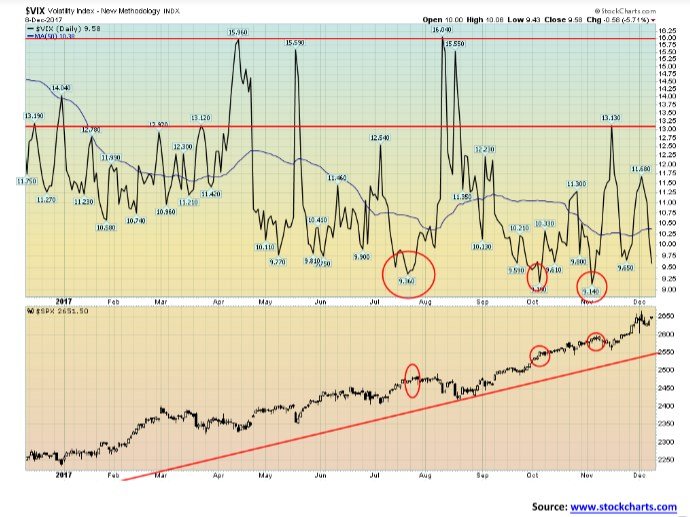
After hitting an all-time high of 16,131 back in October 2017 the TSX Composite has gone into a sideways pattern. The pattern is such as we could interpret it either way; i.e., either bullish or bearish. We could argue we are forming a potential wedge triangle. However, it is recent and not something that has been developing over time. The sharply rising 50-day MA has held the market so far. The breakdown point is at 15,850 and the breakout point is at 16,125. A downside break could suggest a decline to 15,550 and the 200-day MA. An upside breakout could take the market to 16,450. One has to go with the flow. Many of the sub-indices appear toppy. Exceptions are the TSX Energy Index and possibly the TSX Gold Index and TSX Metals Index, which could be forming bottoms. The TSX Health Care Index could be coming out of a bottom pattern.

© David Chapman
It has been some time since we mentioned the TSX Venture Exchange (CDNX). This exchange is dominated by junior mining (both gold and metals) and junior technology companies. Despite ongoing weakness in gold, the precious metals, and the mining metals the CDNX actually rose this past week. Indeed, it turned the daily indicators to the upside. The junior gold and metals companies have come out of the recent weakness particularly for gold and silver prices relatively unscathed.
Over the past several months’ volume has been rising even as the market has largely traded in a sideways pattern. This is a sign that insiders and others are getting positioned for the next move, a move that should be to the upside. Since topping back in February 2017 the CDNX has been largely trading in a sideways pattern forming what appears to be a large symmetrical triangle. Given the last move was to the upside the triangle should be interpreted as bullish. At just under 800 the CDNX is a long way from its highs of 3,370 seen back in 2007. After that peak, the CDNX suffered two major bear markets 2007–2009 and 2011–2015 losing some 86% in the process. In between, there was a strong bull from 2009–2011 that saw the CDNX leap 265%. An earlier bull market that got underway in 2001 saw the CDNX rise 427% to the 2007 peak. The bear markets are excruciating. The bull markets are exhilarating.
© David Chapman
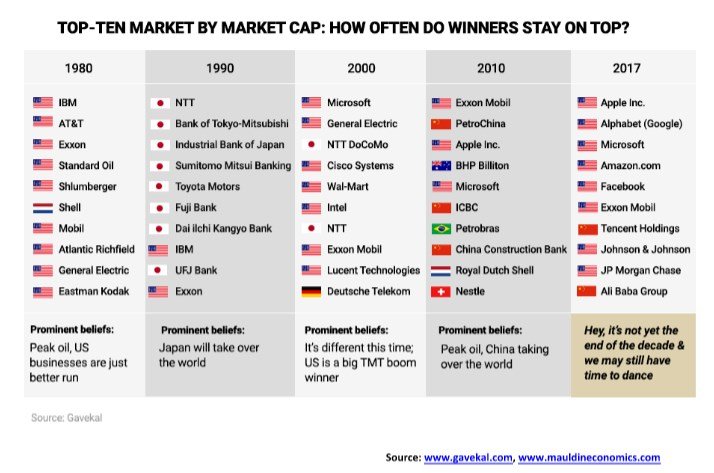
We found this chart quite interesting from a contrarian point of view. It is a great demonstration and reminder that everything remains in flux, that this time it is not different, and what is popular today may not be tomorrow. If you look at this chart only Exxon and Exxon Mobil have appeared in every top ten over the past 37 years. Microsoft has managed to appear in three consecutive top ten. The chart is every ten years so it will be interesting to see if all current top ten are still there in 2020 and especially in 2030. The consensus is not always right.
© David Chapman
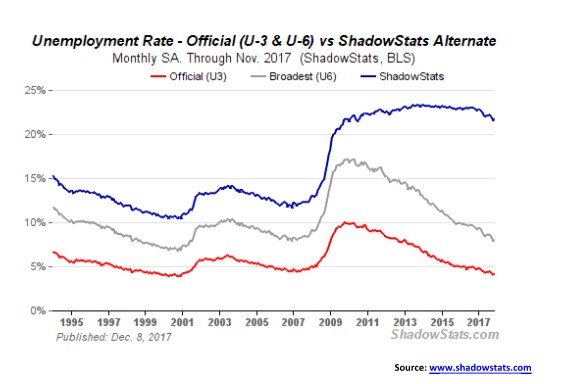
This past Friday saw the release of the November nonfarm payrolls and unemployment numbers. For the record, the nonfarm payrolls for November leaped a higher than expected 228,000. The market had expected roughly 195,000. The headline unemployment rate (U3) remained at 4.1% although we should note the October rate was actually 4.07% vs. November’s 4.12%. The U6 unemployment rate that is the Bureau of Labour Statistics (BLS) broadest unemployment measurement that includes short-term discouraged and other marginally attached workers as well as those working part-time who cannot find full-time employment came in at 8.0% vs. 7.9% in October. Finally, the Shadow Stats unemployment number, which is the BLS’s U6, plus long-term discouraged workers who were removed following redefinitions back in 1994 came in at 21.7% vs. 21.6% in October.
Other measurements of employment include the BLS’s labor force participation rate that came in at 62.7% unchanged from October, and the employment-population rate at 60.1% also unchanged from October. Other highlights saw adult male unemployment at 3.7%, adult female 3.7%, Black 7.3%, White 3.6%, Asian 3%, and Hispanic 4.7%. Those numbers also showed little change from October. At a headline rate (U3) of 4.1%, the unemployment rate is the lowest in 17 years. Could it fall into a 3 handle for the first time since the 1960s? 17.6% of the workforce is part-time.
The current report was adjusted for the warps that came as a result of the earlier hurricanes. As well what we see reported is the establishment survey and not the household survey. The establishment survey for one tends to double count those who might have two part-time jobs whereas the household survey would not. As is usual, a large number of the November’s nonfarm payrolls were part-time jobs. What the jobs report does not do is show how job growth has been decelerating in 2017. That is not surprising given how deep we are in the economic cycle. Wage growth is also slowing. The jobs report does not show the angst out there as workers fear losing their jobs—especially losing their jobs to robots.
© David Chapman
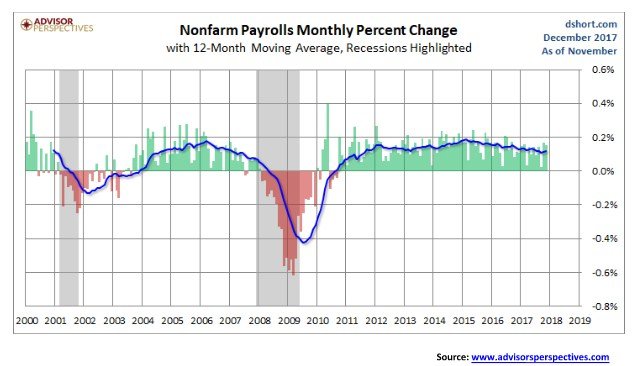
Above is a snapshot of the monthly percent change in nonfarm payrolls since 2000. The blue line is a 12-month moving average (MA). The biggest jump came in October 2009 at 10%. Since then the percentage gain each month has been slowing as we noted in the previous commentary. It is not yet tailing off as was seen in 2006 and 2007 prior to the 2008 financial collapse. The shaded areas represent recessions.
© David Chapman
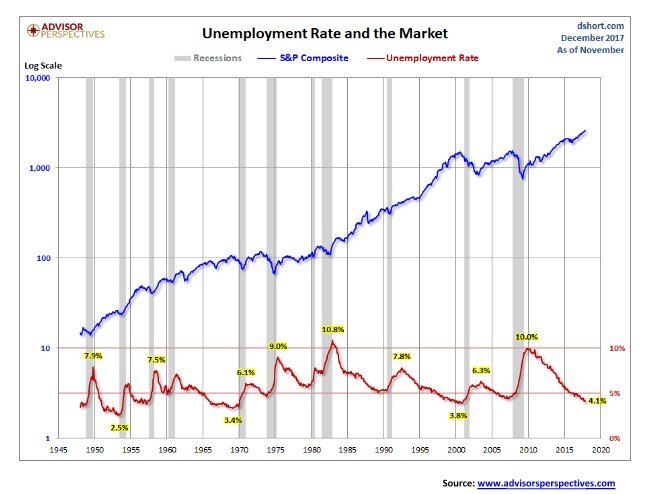
What is interesting about this chart is it lines up the stock market with the unemployment rate. Peak unemployment tends to coincide with market bottoms while peak markets tend to coincide with unemployment lows. Note that at 4.1% the unemployment rate is not far from the low seen in 2000. Odds of seeing the levels of the 1950s and 1960s are extremely low. As before the shaded areas represent recessions. Since 1945 the current era 2009-2017 represents one of the longest spans without a recession matched only with the bull market of the 1990’s.

© David Chapman
For the past several weeks, the U.S. 10-year Treasury note has traded in a narrow range, roughly between 2.32% and 2.42%. This gives us pause to suggest as to what the next move might be. A breakout over 2.45% would confirm our suspicions that interest rates are headed higher. However, a break of 2.30% would suggest that there could be problems out there in the economy and that interest rates are believing that the odds of a recession are rising. Of course, an upside breakout is not positive either as it could suggest a weakening credit market. Treasuries are the highest credit and all others fall in line behind them.
This coming week is the FOMC and the universal expectation is that the Fed will once again hike the key Fed rate by another ¼%. There are, of course, those who believe the Fed for political reasons might hold off, but they are in a minority. Everyone is awaiting word from the new Fed Chair Jerome Powel. But lest we forget, Janet Yellen is there until February. After that, she is leaving. That leaves a considerable hole in experience at the Fed. The market is still waiting as to who will be number 2 behind Powell. So far, Powell sounds a lot like Yellen, but then he is a Trump appointee and Mr. Trump is well known for his desire to shake things up. Also, the Republican-controlled Congress and Senate would like to see the Fed considerably diminished. As to the market’s thoughts on that, well, not so much.
The Fed is committed to its unwinding of QE and if they also continue their rate hikes into 2018, one should know that both are signs of market tightening. Rates have not risen to levels that could yet be a concern for the market.
© David Chapman
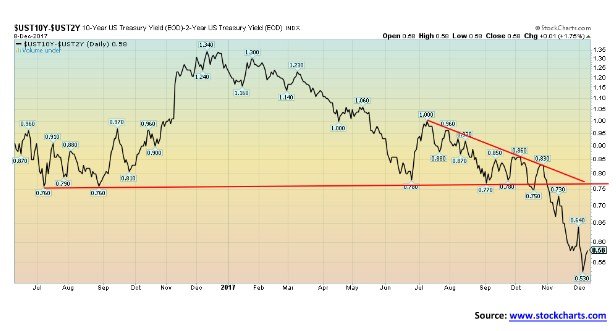
After falling as low as 0.53% this past week the 2–10 year Treasury spread wound up unchanged at 0.58%. While a narrowing 2–10 year Treasury spread is a sign of a potential weakening economy the spread is still not at levels that would suggest any impending recession. Any probability of a recession is at least 12 to 20 months away and even then the odds of a recession are considerably less than 50% at this time according to most economists. Of course, we can’t help but note that these are the same economists that failed to see the 2008 financial crash coming. Economic forecasting is an inexact science.
Still one needs to pay attention to the narrowing yield curve, but as noted it is not at levels that should yet spark alarm. For the moment, at least, the spread could go into another sideways down pattern not dissimilar to what was seen from June to November 2017. The only thing that could change the downward scenario we believe is a rebound that takes us back over 0.75% once again.
© David Chapman
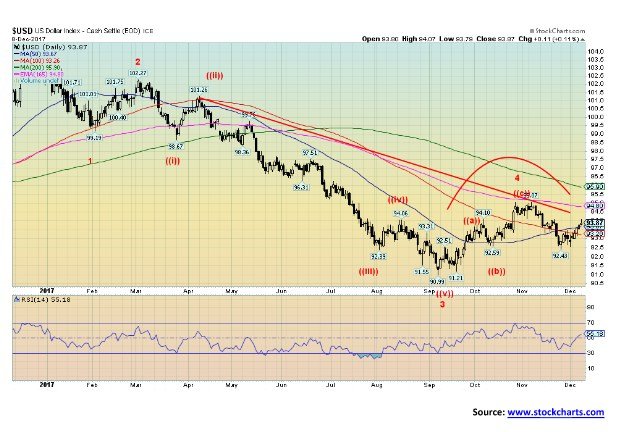
Is the US$ Index starting a new leg to the upside? The US$ Index leaped this past week despite the news of moving the Israeli embassy. Focus remains on the relatively strong U.S. economy, the tax bill, and interest rate hikes. All other major currencies fell this past week. The Cdn$ was one of the hardest hit falling 1.4%. We continue to hold to a 75 target for the Cdn$ vs. the US$. A return back under 93.40 and 93.25 would start to negate thoughts of a further rise. The US$ Index is currently just above the 50 -day MA. A move up over 94.10 would suggest that further gains are ahead. Failure could set up the potential for a head and shoulders top that could be forming. The short-term trend has once again turned up, although it remains weak.
A rising US$ Index could have negative ramifications for gold. A rising US$ Index does not appear to have much impact if any on Bitcoin. The US$ has been falling rapidly against Bitcoin as it takes more and more US$ to purchase one Bitcoin. Next week with the FOMC could prove key for the US$. Most of the news is out for the tax bill and the best news is out for the U.S. economy including the recent jobs report, a report that helped spark the US$ higher on Friday.
© David Chapman
Gold, thy name is misery, especially if you are a gold bug or just believe in it as an alternative currency. Gold? Who cares about gold when you have Bitcoin. It now takes roughly 12 ounces of gold to buy one Bitcoin (depending on where Bitcoin is trading at any given moment). At the beginning of the year, one could have bought a Bitcoin for less than an ounce of gold. Some precious metals sellers such as SilverGoldBull accept Bitcoin and cryptocurrencies as payment. No word, however, that central banks are going to dump their U.S. Treasuries and their gold bullion for Bitcoin.
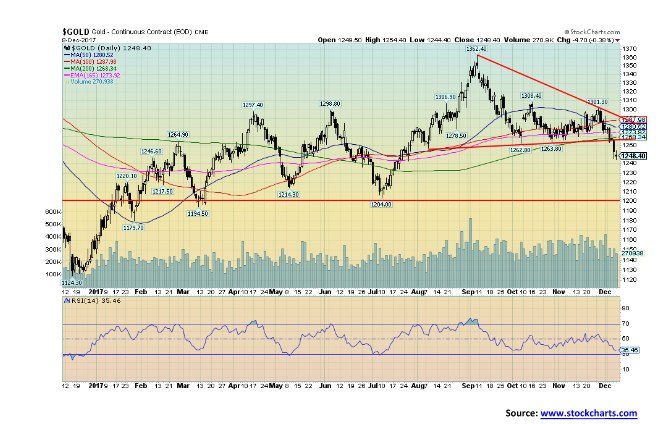
This past week gold broke down breaking under $1,268 support. Near-term targets appear to be down to $1,222 if gold were to fall under $1,240. The low thus far on the futures has been $1,244. Sentiment has plunged and now sits at 19%. We have seen sentiment far lower, especially at the December 2015 and December 2016 lows. So it is possible for gold to fall further to pull sentiment even lower.
Since the bear market got underway in September 2011 gold has had a propensity to make important lows in December. December lows were seen in 2011, 2013, 2015, and 2016. Exceptions were in 2012 where late in the year gold started to break down and 2014 where the low was seen in November. The December FOMC has of late proven to be a nadir for gold especially since the Fed started hiking interest rates back in 2015. The market reaction appeared to be “sell the rumour” (the Fed is going to hike rates) and “buy the news” (the Fed hiked rates). Will 2017 see a repeat?
Gold needs to regain above $1,270 to suggest a low might be in. Gold breaks out above $1,290, although there is further key resistance at $1,300 to $1,320. We continue to hold that the December 2015 low was a key low. The first major wave out topped in July 2016. Wave two may have bottomed in December 2016. Since then we have started what appears to be an irregular rise that has seen higher highs and higher lows. Key therefore remains that gold hold above $1,200/$1,205 on any further decline to maintain the higher low scenario. Once this correction is over gold should start a significant rise as the seasonals turn positive into January.

© David Chapman
Finally, a bit of encouragement from the COT report. This past week the commercial COT jumped to 29% from 24% the previous week. Short open interest plunged by roughly 41,000 contracts while long open interest jumped almost 16,000 contracts. It was no surprise then to see the large speculators COT (hedge funds, managed futures, etc.) fall to 76% from 82%. Long open interest plunged roughly 36,000 contracts while short open interest jumped about 15,000 contracts for the large speculators. But the encouragement came from the commercials who finally appear to be covering their shorts.
© David Chapman
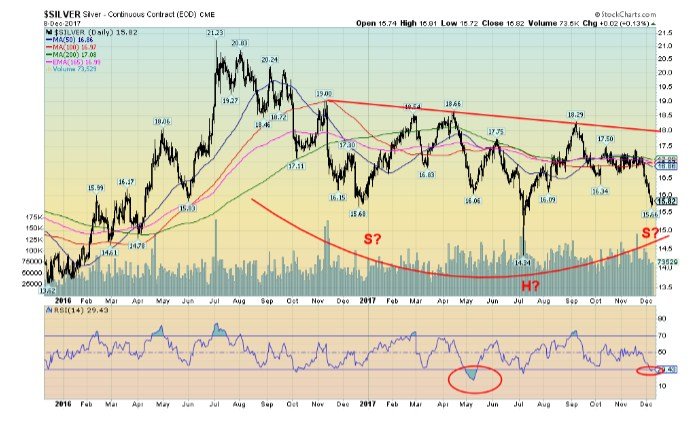
Silver, like gold, plunged this past week losing 3.5% to gold’s drop of 2.6%. Silver tends to lead both in bear and bull markets. The silver RSI briefly plunged under 30 this past week, indicating an oversold market even as it could become more oversold. Silver is now down 1.1% on the year. As a side note, platinum was hit even harder losing 6.1% and is now down 2.4% on the year. Gold remains positive on the year by 8.4%. The breakdown in silver has potential targets down to $15.74. With a low this week of $15.66 the target was more than satisfied. The good news is that silver managed to close above the target zone leaving the possibility that a low might have been made.
Silver continues to make what could be a head and shoulders bottom, but if new lows below $15.66 are made then all bets are off. The next target zone is $15 if new lows below $15.66 are seen. Regaining above $16 would be a positive start. But right now silver needs to regain above $17 to really suggest that a key low is in and a new up move may be underway. Daily sentiment for silver has fallen to 10%. We have seen the sentiment extreme lower in the past. Stated the other way, 90% are bearish on silver. Silver prices could be nearing their exhaustion point.
© David Chapman
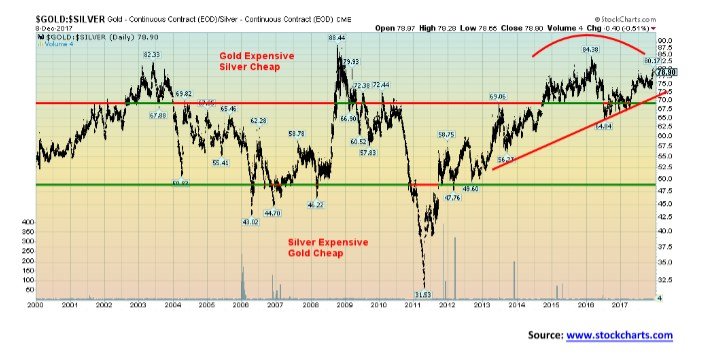
The real ratio of silver to gold is actually much better than what is currently being shown. Back in 1792, the U.S. fixed by law the gold/silver ratio at 15:1 meaning one ounce of gold was worth 15 ounces of silver. In 1803, France enacted a ratio of 15.5:1. The Gold Aureus of Ancient Rome was worth 25 pure silver denarii. A gold stater in Ancient Greece was worth about 20–28 silver drachma. During the 19th century, the U.S. Geological Survey showed that silver is about 17.6 times more abundant than gold. The Comstock silver lode of 1859 showed a ratio of 23:1. In 1980, when gold topped at $875 and silver topped at $50 the ratio fit with historic levels at 17.5:1. Yet throughout the 20th century, the gold/silver ratio averaged around 47:1 and today it sits at 78.90:1. We often say if something is out of line it will eventually self-correct. At current levels, silver is therefore quite cheap when compared to gold.
© David Chapman
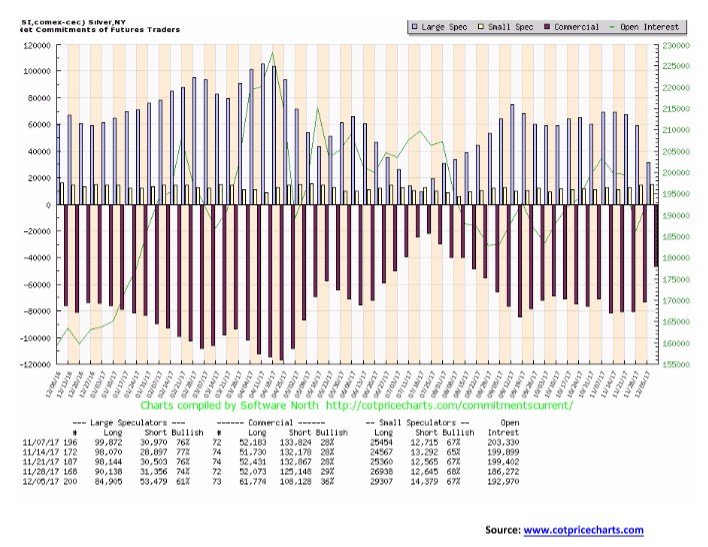
As with the gold commercial COT, the silver commercial COT improved sharply this past week leaping to 36% from 29%. Short open interest fell roughly 17,000 contracts while long open interest rose over 9,000 contracts. As is usual, the large speculators went the other way with their COT falling to 61% from 74%. The large speculators lost over 5,000 contracts of long open interest and saw their short open interest jump roughly 22,000 contracts. Naturally, the commercial COT has been better at major turns but this past week’s move, like gold, is quite encouraging if you are a bull.
© David Chapman
If gold and silver have been miserable then the gold stocks have most likely been miserable as well. This past week the TSX Gold Index (TGD) fell 2.7% and the Gold Bugs Index (HUI) was even weaker, losing 4.6%. Both indices are now down on the year and appear to be headed for a losing year. The TGD is currently down 4.3% on the year while the HUI is down 2.8%. If there is a note of encouragement, as we had noted earlier, the junior mining dominated TSX Venture Exchange (CDNX) was actually up this past week and is up on the year.
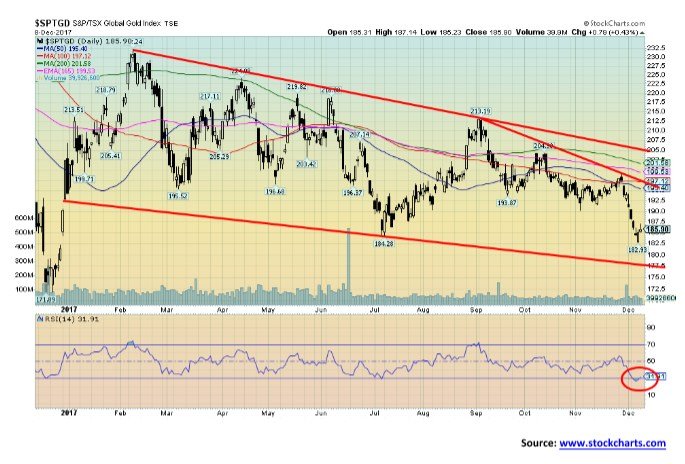
With this week’s breakdown, any thought of a head and shoulders bottom pattern was destroyed. One might still claim there could be a double bottom in play even as this week’s low of 182.93 was lower than the July low of 184.28. One note of encouragement was that even as gold and silver remained weak on Thursday/Friday the TGD actually rose. Thursday saw a nice upside reversal take place. None of this confirms a bottom, but it was encouraging that a bottom could be forming.
A return back over 190 would go a long way in confirming a low. The breakout point for the TGD remains at 205, although above 195 reaching 205 becomes more possible. A firm breakout above 205 could see a strong move to potential targets up to at least 235 with further potential to 255. New lows below 183 could suggest a strong test of the December 2016 low of 172.
© David Chapman
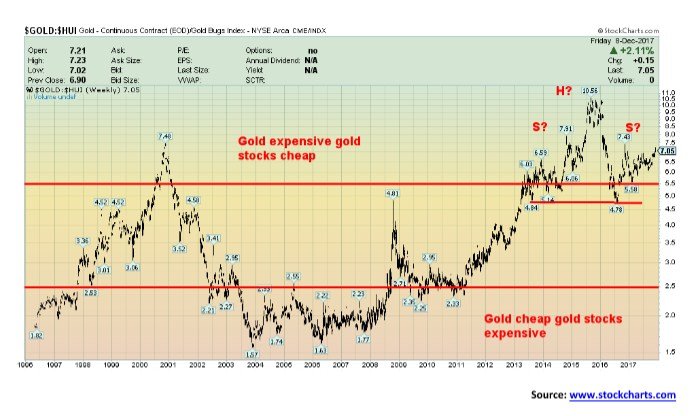
Like silver, the gold stocks remain exceptionally cheap to the price of gold. The Gold/HUI ratio is currently 7.05. The ratio has been almost consistently above 5.5 since 2012. It has been a historic run of the gold stocks being cheap when compared to gold. Gold stocks are highly leveraged with gold, but unlike physical gold, they do have liabilities and are at best paper gold. If everything is ultimately self-correcting we could see a shift that could even take the Gold/HUI ratio back to the levels seen from 2003 to 2008. Back then the gold stocks were expensive when compared to gold. It was no surprise then that once gold entered a bear market the gold stocks were quite weak and led the way lower. But the reverse takes place in a bull market and if a strong one gets underway the gold stocks should lead the way along with silver.
© David Chapman
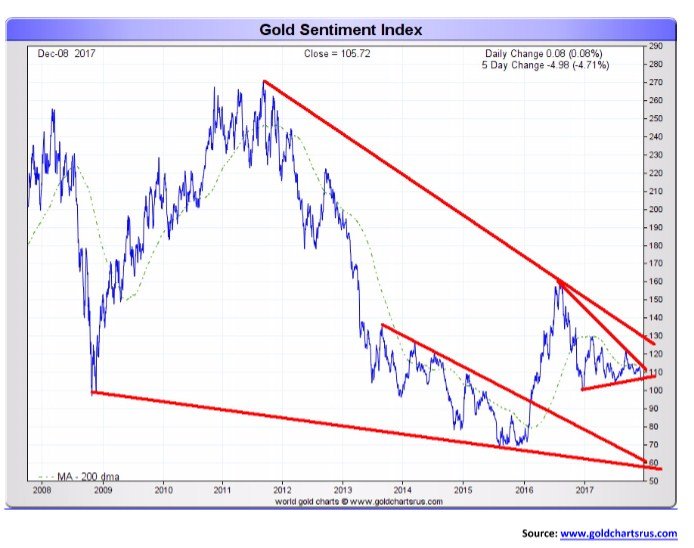
We close with a gold sentiment chart courtesy of Gold Charts R Us. While the sentiment is quite weak here it remains above the levels seen in 2015 at what continues to be a major low. The sentiment indicator is caught in a forming triangle. For the past several months the triangle has seen rising lows even as it has seen declining highs. It should break to the upside but one can’t rule out another plunge to the downside. It would appear that above 130-sentiment would be breaking a strong downtrend. Gold’s cycles turn positive into January. Sentiment should turn positive with gold. One just hopes that sentiment doesn’t then get too bullish too fast. A break under 105 on the sentiment index would suggest lower to at least 75.
GLOSSARY
Trends
Daily – Short-term trend (For swing traders)
Weekly – Intermediate-term trend (For long-term trend followers)
Monthly – Long-term secular trend (For long-term trend followers)
Up – The trend is up.
Down – The trend is down
Neutral – Indicators are mostly neutral. A trend change might be in the offing.
Weak – The trend is still up or down but it is weakening. It is also a sign that the trend might change.
Topping – Indicators are suggesting that while the trend remains up there are considerable signs that suggest that the market is topping.
Bottoming – Indicators are suggesting that while the trend is down there are considerable signs that suggest that the market is bottoming.
(All charts are courtesy of Advisors Perspectives, ShadowStats, Gavekal, Mauldineconomics, Stock Charts, Gold Charts Rus, Cots Price Charts )
__
DISCLAIMER: David Chapman is not a registered advisory service and is not an exempt market dealer (EMD). We do not and cannot give individualized market advice. The information in this article is intended only for informational and educational purposes. It should not be considered a solicitation of an offer or sale of any security. The reader assumes all risk when trading in securities and David Chapman advises consulting a licensed professional financial advisor before proceeding with any trade or idea presented in this article. We share our ideas and opinions for informational and educational purposes only and expect the reader to perform due diligence before considering a position in any security. That includes consulting with your own licensed professional financial advisor.


Temotiva Launches Crowdfunding Campaign to Advance Preventive Mental Health
Temotiva Innovación Lab has launched a crowdfunding campaign through Santander X Explorer, marking a new phase for the University of...


Fed Policy Shift Raises Concerns Over Debt and Inflation Risks
The Federal Reserve is criticized for resuming balance sheet expansion through Treasury purchases despite expectations of tighter policy under new...


AI Adoption in Italian Retail Stalls Despite Strong Experimentation
A survey on AI in Italian large-scale retail trade shows companies are increasingly adopting artificial intelligence, but only 1.4% have...


Crypto Market Stays Stable as Bitcoin and Ethereum See Mild Declines
The crypto market remained stable despite slight declines in major coins like Bitcoin and Ethereum. Bitcoin held near $64,362, while...


WNBA Removes Cannabis From Banned Substances List in New CBA
WNBA removed cannabis from its banned substances list in a new CBA running 2026–2032, aligning with NBA policy and allowing...
 |
|
 |  |
 |
|
-

 Cannabis5 days ago
Europe’s Cannabis Shift: Rising Use, and New Risks
-

 Markets2 weeks ago
Sugar Markets Rise Slightly Amid War, Oil Price Pressure, and Strong Global Supply
-
 Impact Investing2 days ago
AI Adoption in Italian Retail Stalls Despite Strong Experimentation
-

 Cannabis1 week ago
Cannabis Legalization in Germany: A Mixed Interim Assessment
You must be logged in to post a comment Login