Featured
Markets react to US, Canada employment rates for February
20,000 jobs vs. 55,900 jobs. That was the stark difference between the U.S. nonfarm payrolls and the Canadian job numbers for February.

Given Canada’s population is only about 1/10th that of the U.S., it would be like Canada created 559,000 jobs in February. For the U.S. Fed, it gives meaning to their “patient” approach. To the BofC, it gives pause to any thoughts of lowering interest rates. As to the unemployment rates, the U.S. rate (U3) fell to 3.8 percent from four percent while the Canadian unemployment rate remained unchanged at 5.8 percent. But not the difference in the labor force participation rate.
For the U.S., it was unchanged in February at 63.2 percent while in Canada, it rose slightly to 65.8 percent from 65.6 percent. The higher the participation rate, the higher the unemployment rate. For the record in the U.S., the U6 unemployment rate fell to 7.3 percent from 8.1 percent while the Shadow Stats unemployment rate fell to 21.1 percent from 21.8 percent. Not surprisingly, those not in the labor force in the U.S. rose to 95,208 thousand from 95,010 thousand.
With the Eurozone, Japan and China all showing signs of slowing, it is not surprising as well we are seeing signs of slowing in the U.S. and Canada. In the U.S., the real merchandise trade deficit just hit record levels as both annual and Q4 deficits were the deepest in history. Q4 housing starts were revised sharply lower. Given the trade deficit and the slowing housing market, expect a sharp downward revision in Q4 GDP.
The Baltic Dry Index (BDI) a measurement of shipping activity around the world is at its lowest level since 2016. It is signaling a global slowdown in trade. Canada’s housing market is also experiencing a slow down as housing starts plummet across the country and prices continue to soften. Canada also experienced a widening trade deficit. In the U.S. a widening trade deficit is not what President Trump wants.
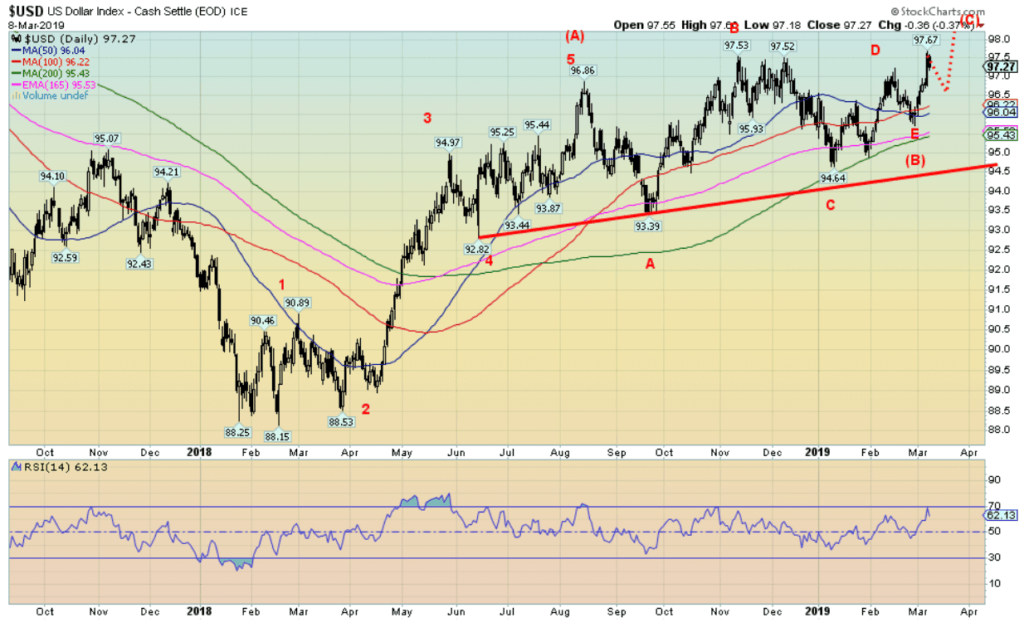
As well, a strong U.S. dollar is not what President Trump wants either. But this past week, the US$ Index jumped to its highest level since December. It backed off on Friday but what it is telling us is that odds favor further gains for the U.S. dollar rather than falling. A run to par (100) is now not out of the question. The Canadian $ gained on Friday following the strong job numbers but the reality is the Canadian $ is not far from its 2018 low of 73.30 (closed Friday at 74.57).
© David Chapman
We have relabeled the US$ Index. The correction since August 2018 now appears as an ABCDE type pattern which we have labeled as wave (B). To come is wave (C) up that should take the US$ Index to at least par (100). All this is against a backdrop of an overly optimistic US$ and a depressive Euro. The breakdown point remains at 94.50.
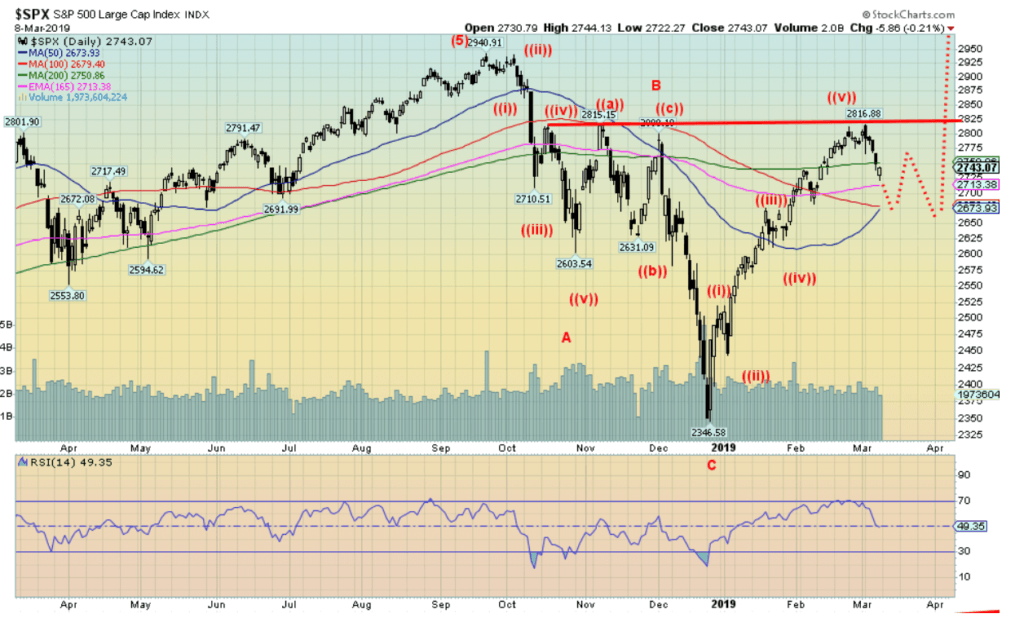
The reaction of the markets on Friday to the February nonfarm payrolls was in the end rather muted. The markets had been falling all week but Friday’s action saw the stock markets fall only to reverse and come back to almost unchanged on the day. But overall stock markets were down on the week. We also note divergences such as the sharp fall in the Dow Jones Transportations (DJT) while the NASDAQ made new highs for the move but other indices did not.
© David Chapman
The S&P 500 along with the other stock market indices stopped short of a major breakout that would have suggested a run to new all-time highs. Remember DJI 30,000? Well, it is still alive. The S&P 500 along with the other indices could form the right shoulder of a potential head and shoulders bottom. After that, a breakout above 2,825 could project up to around 3,300. Key is the S&P 500 does not breakdown under 2,600. The five wave up pattern from the December low has forced to reassess just where we are and the conclusion we came to is that the stock indices could still run to new all-time highs. But we emphasize the S&P 500 must hold above 2,600 or potentially all bets are off.
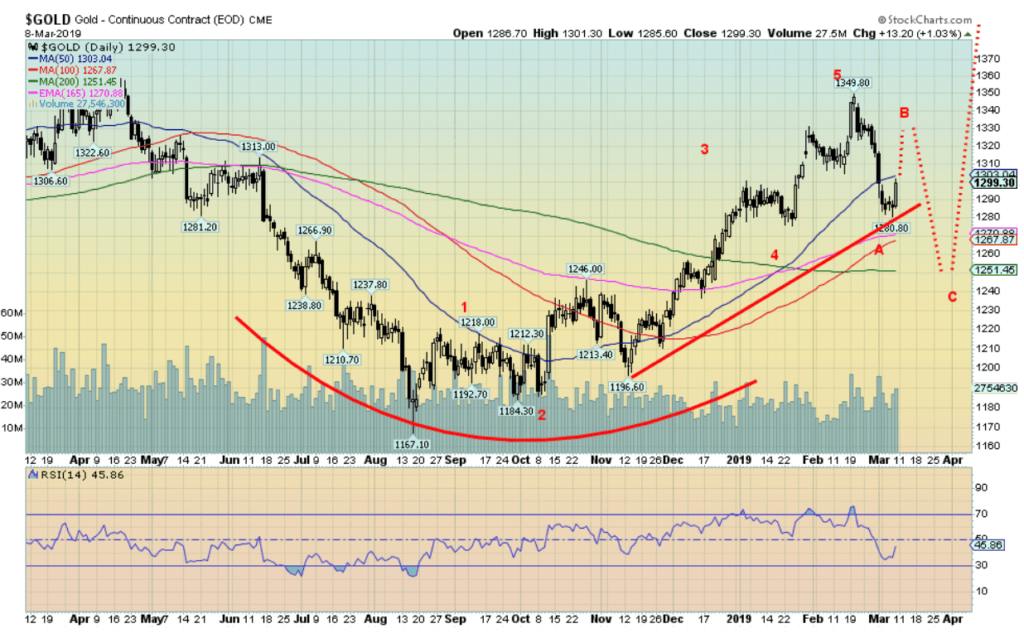
Gold benefitted from the poor economic numbers seen on Friday but at the end of the week all gold could do was remain flat on the week. Silver managed to eke out a small 0.6 percent gain. Our view on gold hasn’t changed. After hitting a peak near $1,350 our expectations are a corrective period that could last into May and gold fall to around $1,250 with a worst case scenario down to $1,220. That would fit with a stronger US$.
Nonetheless, gold after falling from $1,350 to near $1,280 is due for a rebound. We note improvement in the commercial COT this week suggesting the commercials have knocked back on their short positions although they didn’t really add to their long positions. A gold rebound could take gold back to around $1,320 before it resumes its downtrend. Once this correction is out of the way our expectations are that gold should embark on a multi-month rally that should take it past $1,400 and up towards $1,500.
© David Chapman
(Featured image by fizkes via Shutterstock)
—
DISCLAIMER: David Chapman is not a registered advisory service and is not an exempt market dealer (EMD). We do not and cannot give individualized market advice. The information in this article is intended only for informational and educational purposes. It should not be considered a solicitation of an offer or sale of any security. The reader assumes all risk when trading in securities and David Chapman advises consulting a licensed professional financial advisor before proceeding with any trade or idea presented in this article. We share our ideas and opinions for informational and educational purposes only and expect the reader to perform due diligence before considering a position in any security. That includes consulting with your own licensed professional financial advisor.


Bitcoin Stalls Near $60K as Strategy Moves, ETFs Outflow, and EU MiCA Rules Take Effect
Bitcoin hovers near $60,000 with ETF outflows, while Strategy boosts reserves, sells BTC, and raises dividends to reassure investors. Ethereum...


Cannabis Dominates Global Drug Use: Trends, Risks, and Shifting Markets
Cannabis remains the world’s most widely used illicit drug, with 256 million users in 2024, surpassing all others combined. Growth...


Italy Approves First Hydrogen-Powered Train for National Rail Network
ANSFISA has approved Italy’s first hydrogen-powered train, the Alstom HMU214, for use on the Brescia–Iseo–Edolo line. Capable of 140 km/h,...


Cotton Market Weakness Persists Despite Brief Rebound
Cotton prices fell to new lows last week before a modest rebound. USDA data shows crop conditions remain worse than...


Eli Lilly Hits $1 Trillion Valuation Amid Strong Bullish Momentum
Eli Lilly stock hit a record high, surpassing $1 trillion market value after strong product demand. Shares surged over 7%,...
 |
|
 |  |
 |
|
-

 Cannabis2 weeks ago
WNBA Removes Cannabis From Banned Substances List in New CBA
-
 Markets22 hours ago
Cotton Market Weakness Persists Despite Brief Rebound
-

 Cannabis1 week ago
Trulieve NYSE Listing Signals New Era for Global Cannabis Industry
-

 Africa2 weeks ago
Remote Work Reshapes Sales Management: Key Lessons for Moroccan Leaders