Featured
Markets Were Up this Past Week and the US$ Index Continued its Recent Fall
It was a shortened Thanksgiving week so it was no surprise that markets were for the most part lethargic this past week. Stock markets added to recent gains but it seemed grudgingly. Things might perk up this week as we head into the November job numbers due out Friday December 2 and the December FOMC Dec 13-14. Job numbers are expected to be lower.

The Guardian, a U.K. newspaper (www.theguardian.com), recently wrote in its economics section that the story of the economy at the end of 2022 could be summed up by “the four Ps”: Pandemic, Putin, Politics, and Price Inflation. The Guardian was referring to the U.K. and the problems it had, but it could have easily been applied anywhere in the developed world. No developed country is immune, it seems. The pandemic was handled differently from country to country, but the bottom line was that hundreds of thousands were infected by COVID, hospitals were overwhelmed, lockdowns were prevalent, protests against the lockdowns were also prevalent, and thousands died. For the G7 countries (U.S., U.K., France, Germany, Japan, Italy, Canada) they accounted for 39% of global COVID cases and almost 29% of global (COVID) deaths as reported by Worldometer (www.worldometer.info/coronavirus). The primary argument against these numbers was that, overall, as a percentage of the total population, it was worse than some pandemics but nowhere near as bad as others.
The pandemic sparked a brief but sharp recession where governments of all stripes threw billions of dollars to bail out the economy (with quantitative easing or QE, plus billions of dollars more for fiscal stimulation) and lowered interest rates to zero or below. The result was a disjointed world that sparked shortages, supply disruptions, and more that has been exacerbated further by the lockdowns in China, the world’s second-largest economy. With China continuing to experience what are probably the most stringent lockdowns compared to any seen in any of the G7 countries or even the broader G20 countries, the supply disruptions and more are sure to continue.
Politics, already becoming fractured, dysfunctional, and, polarized before the pandemic, became more fractured, dysfunctional, and polarized with protests, confrontations, election denial claims, urban/rural splits, media distrust, immigration, race, income and wealth inequality, liberal/conservative clashes, armed militias and more. Putin (Russia) invaded Ukraine after years of failed negotiations and threats that Ukraine would join NATO, a red line that Russia had said not to cross. That in turn sparked an energy crisis as oil and gas supplies from Russia to the EU were cut and a wide range of sanctions were placed on Russia. Sanctions are the equivalent of a trade war. That in turn sparked more supply disruptions and shortages as Russia is a global commodity powerhouse, home to many of the world’s crucial minerals and food stuffs. Russia is a major producer of oil (#2 in the world) and natural gas (NG) (#2 in the world).
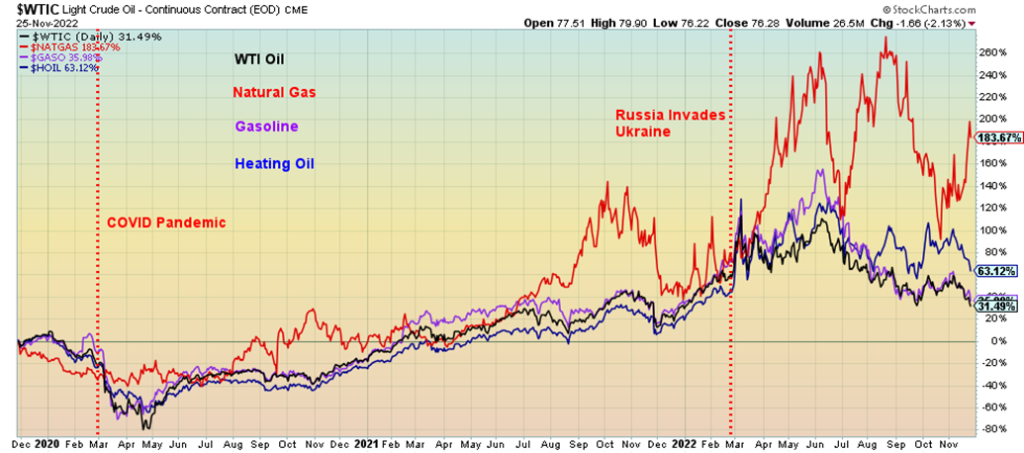
The rise of energy prices since the pandemic is depicted below. Since November 2019 WTI Oil is up 31.5%, natural gas (NG) up 183.7%, gasoline up 36.0%, and heating oil up 63.1%. In the same period, EU natural gas at the Dutch Hub has leaped an incredible 666%. No wonder it has helped spark inflation along with huge energy bills for many in the EU and UK. However, when one looks at the Consumer Price Index (CPI) alone, it has gone up only 15.5% in the same period.
The Rise of Energy Prices 2020–2022
Maybe there should be one more P: “Plunge”, as in crypto plunging and adding to that meme stocks, NFTs, and many high-tech stocks that made up the FAANGs. Tellingly, this year alone Meta is down 67%, Amazon down 44%, Netflix off 59%, and Tesla down 48%. All the other FAANGs are down as well, but those four were the worst. The collapse of the crypto platform FTX highlights the collapse of non-fungible tokens (NFTs) and the meme stocks. Bitcoin has fallen 66% thus far in 2022.
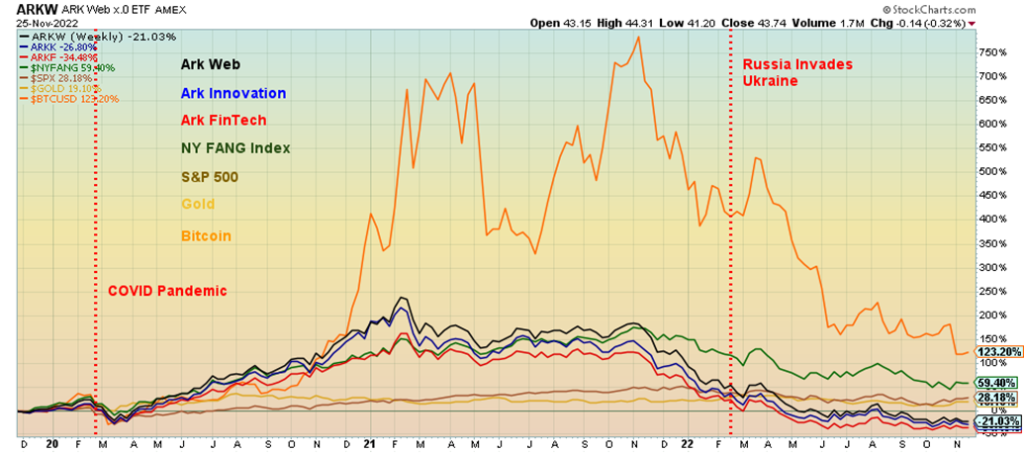
It is difficult trying to capture all the movements of meme stocks such GameStop (GME) and Bed Bath & Beyond (BBBY), as well as NFT stocks such as Coinbase (COIN) and Funko (FNKO). However, they are down 29%, 78%, 82%, and 51% respectively in 2022. While GME is down only 29% in 2022, it is down 78% from its all-time high. Bitcoin, the poster child for the cryptos, is down 76% from its all-time high, despite still being positive over the three-year period. The NY FANGS Index is positive over the three-year period by 59%, but it
has fallen 38% so far in 2022 and is down 43% from its all-time high in November 2021. Both gold and the S&P 500 are up over the three-year period by 19% and 28% respectively, but both are down by 4% and 15.5% so far in 2022. All three ARK Innovation ETFs shown are down over the three-year period and down in 2022 as well. The massive injection of monetary and fiscal stimuli, coupled with ultra-low interest rates helped shoot all of them higher from the lows of the pandemic in March 2020. However, once the peak came, coupled with the hiking of interest rates, withdrawal of monetary stimulus, and the onset of the Russia/Ukraine war, the fall has been dramatic.
Innovation, FAANGs, Crypto All Suffer 2020–2022
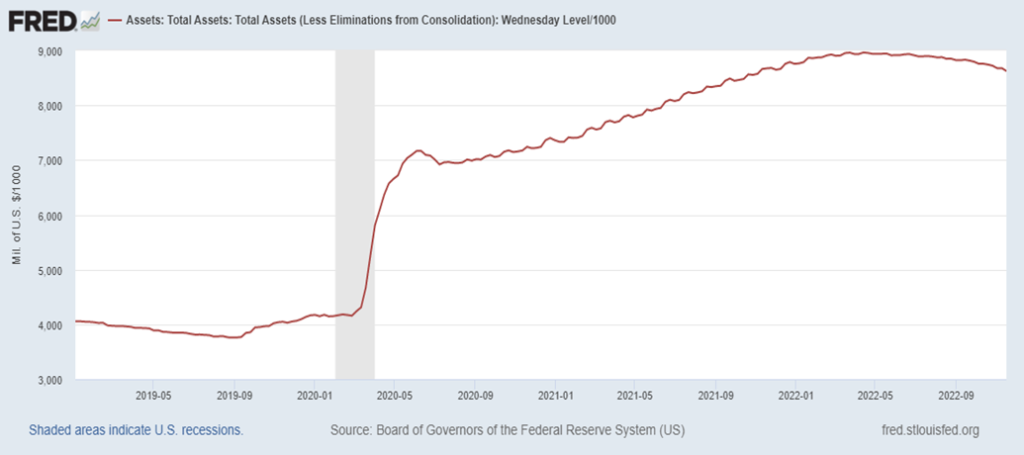
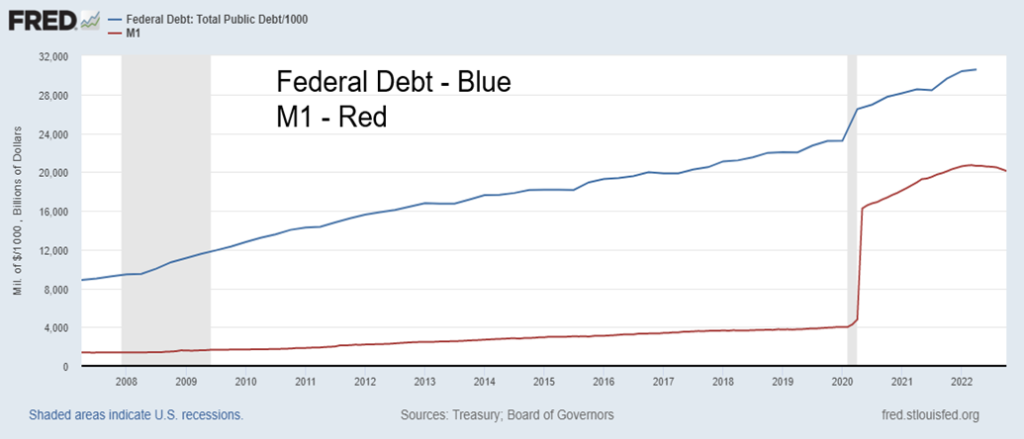
We have often noted the explosive growth of money and debt. While the charts below pertain to the U.S., the charts would look the same whether we were applying it to the EU, Japan, Australia, or Canada. The Fed’s balance sheet has exploded by $6.4 trillion or 294% since November 2008, federal government debt is up $20.4 trillion or 187%, total debt has increased $42.5 trillion or 84%, and M1 money supply is up $18.6 trillion or 1203%. It is noteworthy that both Fed assets and M1 have turned down since peaking in April 2022. That’s quantitative tightening at work.
Monetary growth, along with major supply disruptions and the war in Ukraine, has helped spark the highest inflation seen since the 1970s. This belatedly set in motion the central banks of the world to hike interest rates in order to slow the economy and bring the rate of inflation back down to more acceptable levels. The hope is that the central banks can engineer a soft landing. Many expect, however, that instead it will be a hard landing. The Fed Funds rate was hiked to 20% under former Fed Chair Paul Volcker back in 1980. The landing was anything but soft as U.S. unemployment soared to 10.8%, the highest seen since the Great Depression. That level was about equaled during the Great Recession of 2007–2009 and exceeded during the brief but steep pandemic recession of 2020. However, in the latter two cases, the economic contraction was above the contraction seen from 1980–1982.
The Explosive Growth of the Fed’s Balance Sheet 2018–2022
The Explosive Growth of Money and Debt 2007–2022
Inflation in the 1970’s vs. Inflation Today 1970–2022
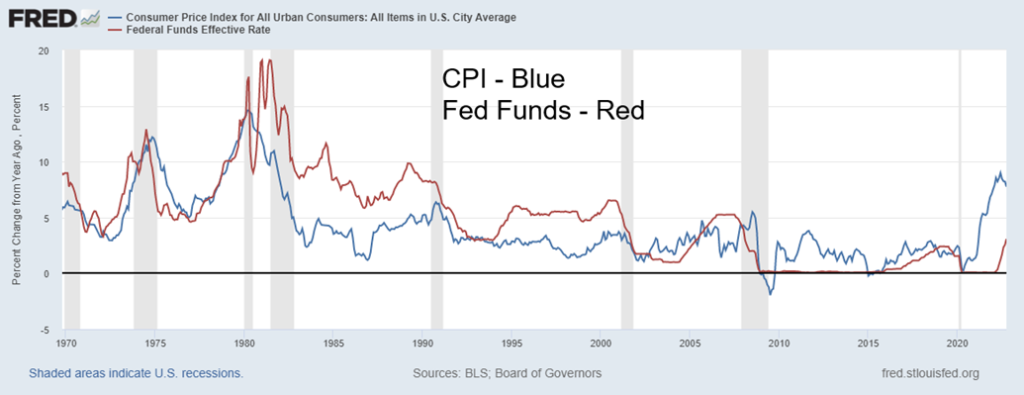
Once Volker hiked interest rates to 20%, the Fed Funds rate remained above the rate of inflation for the next twenty years 1980-2000. That ensured a positive return after inflation. But since the dot.com bust and subsequent recession of 2000–2002, the Fed Funds rate was lowered below the rate of inflation and, except for a brief period in 2006–2007, it has remained that way ever since. With inflation rising, the central banks of the world, whether they be the Fed, the ECB, the BOE, or the BofC, have all been forced to play catch-up to the inflation rate. They are still behind, raising the possibility that they might be forced to hike the central bank above the rate of inflation à la Volcker. The most recent Fed minutes have indicated that their rate of hikes is poised to slow. 50 bp is expected in December with possibly 25 bp hikes in January and March.
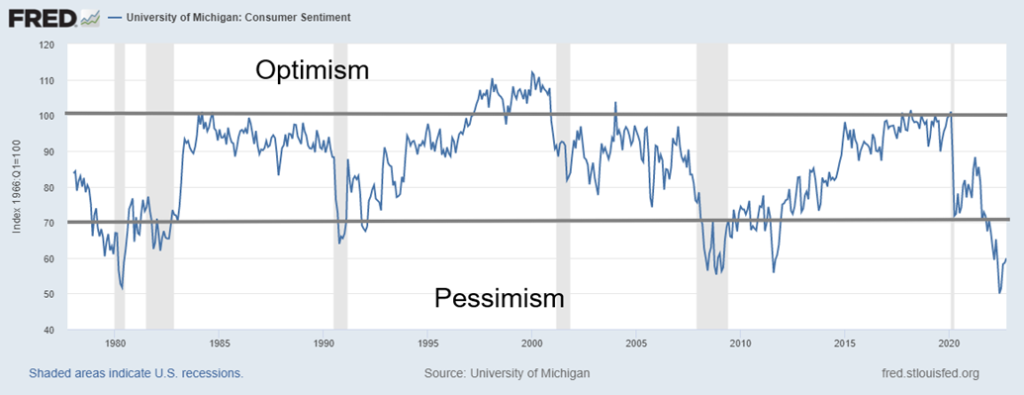
The result is stocks, gold, and the U.S. dollar are responding with both stocks and gold up and the US$ Index down. And it is spilling over into the economy but has yet to translate into any significant rise in unemployment. As well, many other economic numbers have remained positive. The major exception is the housing market as price reductions up to 25% are already being seen in both Canada and the U.S. Rising interest rates are having an impact there. Consumer sentiment has also fallen sharply from highs but has not negatively impacted employment or retail sales in a significant way—yet.
However, the question is not, will the economy slide into a recession, the question is when. We have often noted the huge inversion of the yield curve. Recently, both our two closely watched spreads, the 2-year–10-year spread and the 3-month–10-year spread, have reached the highest levels seen in forty years. In the past, the low in the spread has tended to precede the recession by at least six months. That suggests that, officially, the recession should be underway by May 2023. However, there is also a possibility the spreads have not as yet bottomed. Will that delay the recession? Not necessarily.
Optimism vs. Pessimism University of Michigan Consumer Sentiment 1977–2022
Many believe inflation has topped but, as we noted, in the 1970s inflation first peaked before the 1974–1975 recession and then pulled back. Interest rates were also lowered. Then inflation perked up again, thanks to rising oil prices due to the embargo, and followed by the Iranian revolution. Those events triggered a spike in oil prices and ultimately in inflation. The 1974–1975 recession was, at the time, the steepest since the Great Depression. The follow-up recession in 1980–1982 was even steeper.
We may have our first clues with the November job report, due out in both Canada and the U.S. on December 2. The FOMC meets on December 13-14 of the following week. So far, in the forecasts, we are not seeing a significant drop in job growth, but we are seeing a slowing in the rate of growth. Will it be enough to see unemployment rising? Probably not.
Unemployment Rate vs. Fed Funds 1954–2002
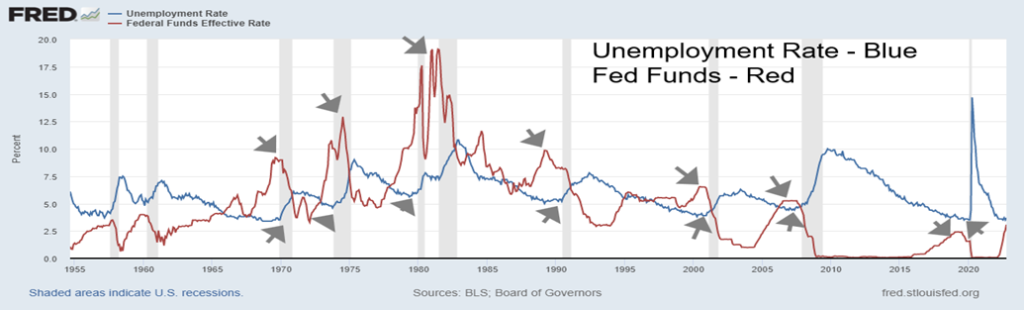
There does tend to be a lag between rising interest rates and rising unemployment. Hiking interest rates tends to start months before we start to see unemployment rise. However, not long after interest rates peak, unemployment is usually rising. Have interest rates peaked? Many believe the Fed will soften into 2023. But it’s not likely to happen until the Fed Funds rate reaches 5% up from 4% today. That fits with the thoughts of another 50 bp in December followed by 25 bp hikes in February and March. But where will inflation be? It is hoped it is lower. It is moderating, but it has some way to go to get back to 2%. Expect more pain into 2023.
Chart of the Week
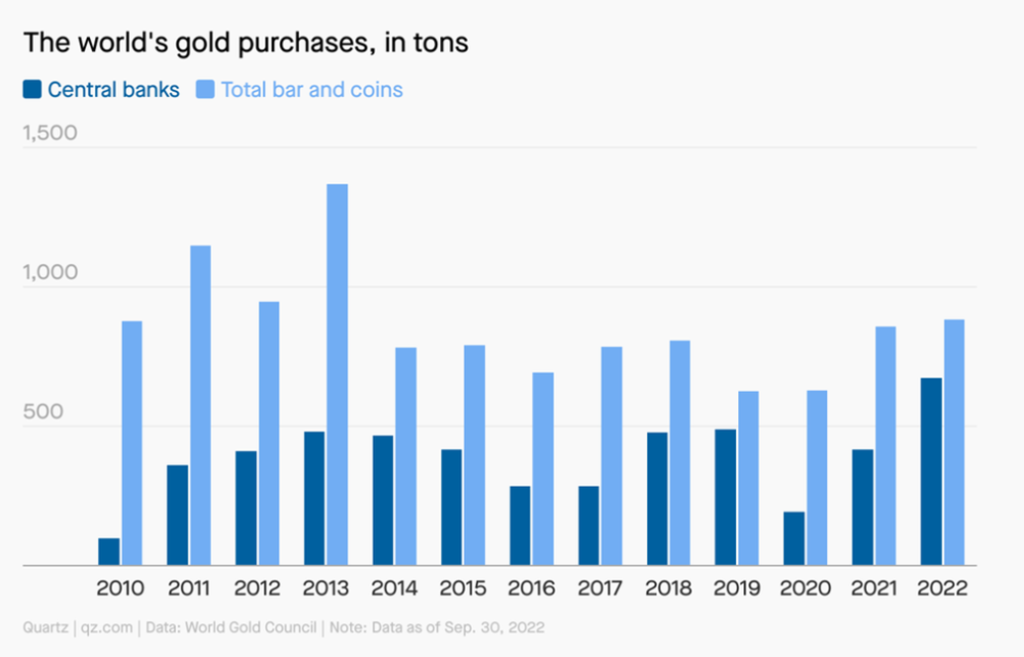
It’s been an interesting year in that central banks have made the largest purchases of gold to add to their reserves since 1967. On the other hand, we’ve noticed that foreign holdings of U.S. treasuries have been falling. Central banks have added 673 metric tonnes of gold (21,637,421 troy ounces = US$37.9 billion), while foreign holdings of U.S. treasuries have fallen by US$450.7 billion in 2022 to Q3. Are they connected, although they don’t equal each other? Naturally, we don’t know but it definitely raises some questions.
In adding 673 metric tonnes, some 400 metric tonnes of it were added in the third quarter alone. The biggest buyer was Turkey with 31.17 metric tonnes, followed by Uzbekistan with 26.13 metric tonnes. We also know India has been shoring up its gold reserves and both Russia and China have been building their gold reserves for years. India holds only roughly 785 metric tonnes but China holds (officially at least) 1,948 metric tonnes while Russia holds 2,298 metric tonnes. This is as of October 2022. The U.S. remains the largest holder of central bank gold reserves with 8,133 metric tonnes. Russia and China rank sixth and seventh respectively for gold holdings behind the U.S., Germany, the IMF, Italy, and France. Canada has none, having sold all its gold years ago in favor of holding U.S. treasuries instead.
U.S. Federal Debt held by Foreign and International Investors (i.e., central banks and others) 2000–2022
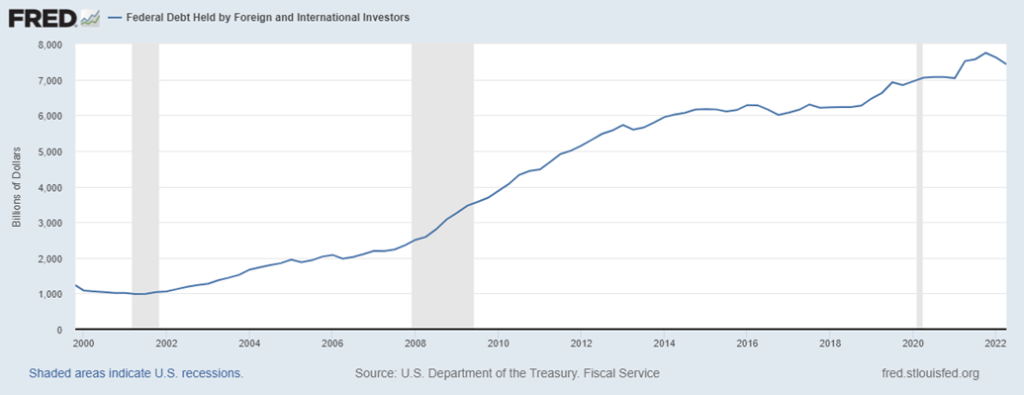
If the central banks around the world are bailing on U.S. treasuries, who’s replacing them? For years, Japan and China were two of the biggest buyers of U.S. treasuries. Not so much anymore. In the past year alone, Japan’s holdings are down $179 billion while China’s holdings have fallen $114 billion. Meanwhile, total U.S. debt has gone up $1,686 billion in 2022. Who’s buying it all? Even the Fed has been offloading their holdings of U.S. treasuries at the rate of $60 billion/month for quantitative tightening (QT).
Some other central banks have stepped up, notably the Bank of England (BOE) and the Bank of Canada (BofC). The BOE’s holdings are up $96.9 billion and the BofC’s holdings are up $31.7 billion in the past year. One of the biggest buyers has been intergovernmental holdings, led by the Social Security Trust. Social Security holdings are up $592 billion in the past year. In total, the federal government along with other government accounts has seen their holdings jump $1.18 trillion in the past year. That’s roughly 70% of the rise in total debt. Those government accounts include, besides the Social Security Trust, trusts for Retirement, Medicare, and Military Retirement Funds.
While intergovernmental holdings have filled a big hole, what if they were unable to maintain this pace? Purchases elsewhere—central banks, financial institutions, life insurers, pension funds—have been pulling back. No wonder the yield on the U.S. 10-year treasury note has jumped from 1.64% to 3.76% over the past year. And that’s down from the peak of 4.25%. Investors want a higher yield to hold U.S. treasuries.
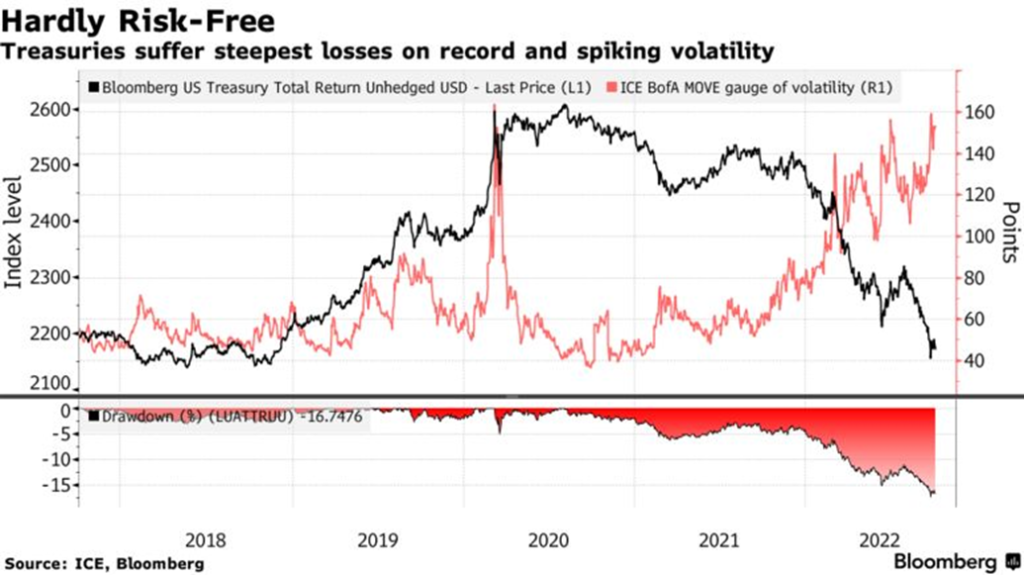
While yields are up, prices are down (yields move inversely to price), which has translated into losses for holders. As well, volatility in the bond market is up and, no surprise, there have been liquidity issues even in the U.S. treasury market, let alone in the corporate bond market. Spreads have widened. We show a chart from Bloomberg (www.bloomberg.com) that shows the losses in the treasury market and spiking volatility.
We can’t say it for sure just yet, but what we seem to be witnessing is some loss of confidence in holding U.S. treasuries vs. a preference or rising confidence in holding gold. Gold is considered a safe haven, particularly in times of financial stress as we have seen over the past year. Gold is also a hedge against inflation and against deflation. Gold, unlike U.S. treasuries and other debt and stock instruments, has no liability.
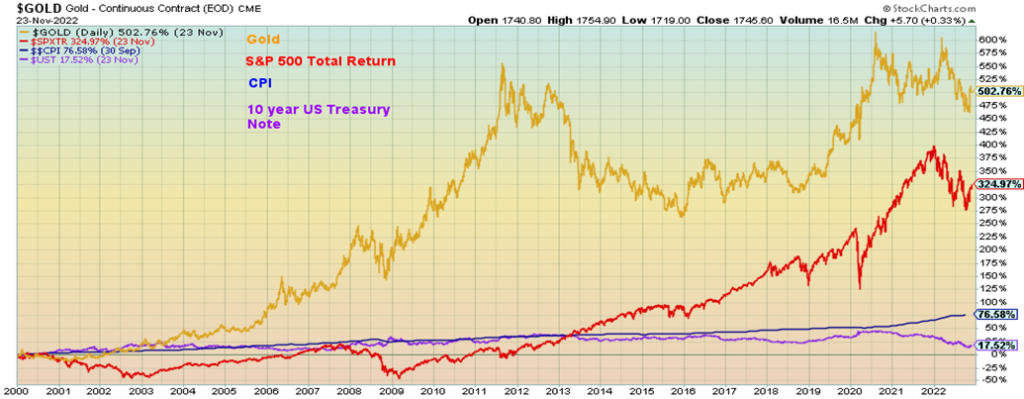
Our final chart above shows the return since 2000 for gold, the S&P 500 Total Return Index, the CPI, and the 10-year U.S. treasury note (before coupon). Gold has been the best performer by far, despite weakness during long periods. Gold has returned 502.8% vs. the S&P Total Return Index returning 325.0%. Gold should be an integral base in all portfolios.
Markets & Trends
| % Gains (Losses) Trends | ||||||||
| Close Dec 31/21 | Close Nov 25/22 | Week | YTD | Daily (Short Term) | Weekly (Intermediate) | Monthly (Long Term) | ||
| Stock Market Indices | ||||||||
| `S&P 500 | 4,766.18 | 4,026.20 | 1.5% | (15.5)% | up | neutral | neutral | |
| Dow Jones Industrials | 36,333.30 | 34,347.10 | 1.8% | (5.5)% | up | up | up | |
| Dow Jones Transport | 16,478.26 | 14,443.56 | 1.3% | (12.4)% | up | neutral | up (weak) | |
| NASDAQ | 15,644.97 | 11,226.36 | 0.7% | (28.2)% | up | down | down (weak) | |
| S&P/TSX Composite | 21,222.84 | 20,383.77 | 2.0% | (4.0)% | up | neutral | upl | |
| S&P/TSX Venture (CDNX) | 939.18 | 575.64 | flat | (38.7)% | down | down | down | |
| S&P 600 | 1,401.71 | 1,232.44 | 1.2% | (12.1)% | up | neutral | up (weak) | |
| MSCI World Index | 2,354.17 | 1,980.98 | 2.3% | (15.9)% | up | neutral | down | |
| Bitcoin | 47,907.71 | 16,496.51 (new lows) | (1.1)% | (65.6)% | down | down | down | |
| Gold Mining Stock Indices | ||||||||
| Gold Bugs Index (HUI) | 258.87 | 226.05 | 3.9% | (12.7)% | up | neutral | down | |
| TSX Gold Index (TGD) | 292.16 | 269.31 | 3.4% | (7.8)% | up | neutral | down | |
| % | ||||||||
| U.S. 10-Year Treasury Bond yield | 1.52% | 3.69% | (3.7)% | 142.8% | ||||
| Cdn. 10-Year Bond CGB yield | 1.43% | 2.93% | (6.4% | 104.9% | ||||
| Recession Watch Spreads | ||||||||
| U.S. 2-year 10-year Treasury spread | 0.79% | (0.78)% (new lows) | (11.4)% | (198.7)% | ||||
| Cdn 2-year 10-year CGB spread | 0.48% | (0.97)% (new lows) | (14.1)% | (302.1)% | ||||
| Currencies | ||||||||
| US$ Index | 95.59 | 105.92 | (0.9)% | 10.8% | down | neutral | up | |
| Canadian $ | .7905 | 0.7474 | flat | (5.3)% | up | down | down | |
| Euro | 113.74 | 104.04 | 0.8% | (8.5)% | up | neutral | down | |
| Swiss Franc | 109.77 | 105.74 | 0.9% | (3.7)% | up | up | down | |
| British Pound | 135.45 | 120.09 | 1.8% | (10.7)% | up | neutral | down | |
| Japanese Yen | 86.85 | 71.86 | 0.9% | (17.3)% | up | down | down | |
| Precious Metals | ||||||||
| Gold | 1,828.60 | 1,754.00 | flat | (4.1)% | up | down (weak) | neutral | |
| Silver | 23.35 | 21.43 | 2.1% | (8.2)% | up | neutral | neutral | |
| Platinum | 966.20 | 987.80 | 0.4% | 2.2% | up | up | up (weak) | |
| Base Metals | ||||||||
| Palladium | 1,912.10 | 1,821.50 | (6.1)% | (4.7)% | down | down | neutral | |
| Copper | 4.46 | 3.63 | flat | (18.7)% | up | down (weak) | neutral | |
| Energy | ||||||||
| WTI Oil | 75.21 | 76.28 | (4.8)% | 1.4% | down | down | up | |
| Nat Gas | 3.73 | 7.33 | 16.3% | 96.5% | up | neutral | up | |
New highs/lows refer to new 52-week highs/lows and, in some cases, all-time highs.
Markets continue to rise higher as our intermediate B wave takes shape. Gains were seen almost universally this past week. The S&P 500 gained 1.5%, the Dow Jones Industrials (DJI) was up 1.8%, the Dow Jones Transportations (DJT) gained 1.3%, but the NASDAQ was only up 0.7% as the FAANGs continued to drag it down. The NYSE FANG Index lost 0.2%. The S&P 400 Mid was up about 2.0% while the S&P 600 Small gained 1.2%. In Canada, the TSX Composite was up 2.0% but the TSX Venture Exchange (CDNX) was flat. Elsewhere in the EU the London FTSE was up 1.2%, the Paris CAC 40 +1.0%, and the German DAX +0.8%. In Asia, China’s Shanghai Index (SSEC) gained 0.1% and the Tokyo Nikkei Dow (TKN) was up 1.4%. The MSCI World Index was up 2.3%. However, problems continued for the cryptos as Bitcoin fell to 52-week lows, losing another 1.1%. Our target for Bitcoin remains down to $10,400.
The DJI has been the strongest. Seeking safety? The DJI has broken its downtrend from the January highs and is now down only 5.5% on the year. Could another push bring it back to at least break-even? If there is some cautionary note, we see the VIX Volatility Indicator is 20.50 which, while not near record lows of about 10, is nonetheless falling, reflecting some complacency on the part of the market. We never had a major spike this time when markets fell as we were nowhere near highs seen during the pandemic crash nor the 2008 financial crisis. The Fear and Greed Index is at 64, reflecting greed but not yet excessive greed. The CBOE put/call ratio at 0.63 is neutral. The S&P 500 Bullish Percent Index is at 72—that’s high, but it doesn’t become excessive until we are over 80. Only 33% of NASDAQ stocks are above their 200-day MA, but 63% of S&P 500 stocks are above the average. Again, that’s not excessive. No divergences with the advance-decline line are being seen.
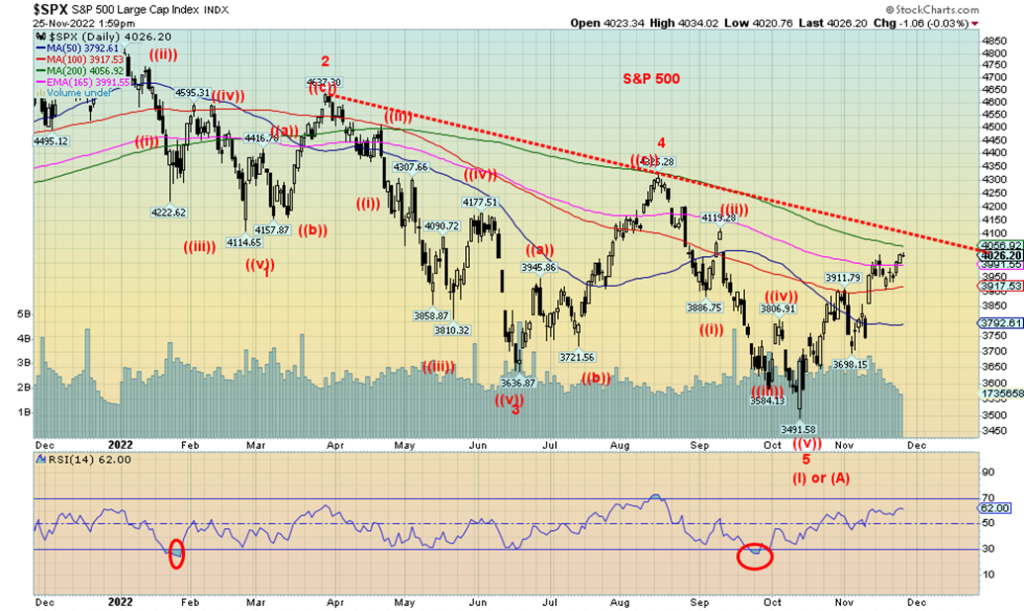
While the DJI has now easily cleared the 200-day MA and its downtrend line, the S&P 500 remains below both. The 200-day MA is at 4,056 while the trendline comes around 4,065. If we can break through that level, then we should move higher. But that zone can also be resistance and we could fall back. A move back under 3,900 would be negative, but a move back under 3,700 would be even more negative. Under 3,600 new lows are quite probable.
The market has become more bullish, but its not yet at levels that suggest extreme complacency. We are reminded that we believe the Fed put is gone. The Fed is hiking rates and while it doesn’t seem to have impacted employment yet it should going into 2023. The housing market is the most impacted and consumer sentiment is dragging near 40-year lows.
A pullback now into about mid-month could set the market up for the traditional year-end Santa Claus rally that usually extends into early January. A reminder that January 2022 was a down month, suggesting the January effect was for a down year. So far, it hasn’t disappointed.
December is normally a good month. It ranks number 3. The year 2018 was the worst December since 1931. But December 2018 also saw the Fed and Treasury come to the rescue by Christmas, resulting in the run-up to all-time highs by February 2020. Then everything came crashing down in March with the COVID pandemic. Decembers following mid-terms are not as bullish as the overall record suggests with the DJI falling to only #5. As the S&P 500 approaches the resistance zones, we could see the start of a pullback, but we’d still be looking for a year-end rally. We are on what we believe will prove to be an ABC-type correction that could carry us into January for a possible top.
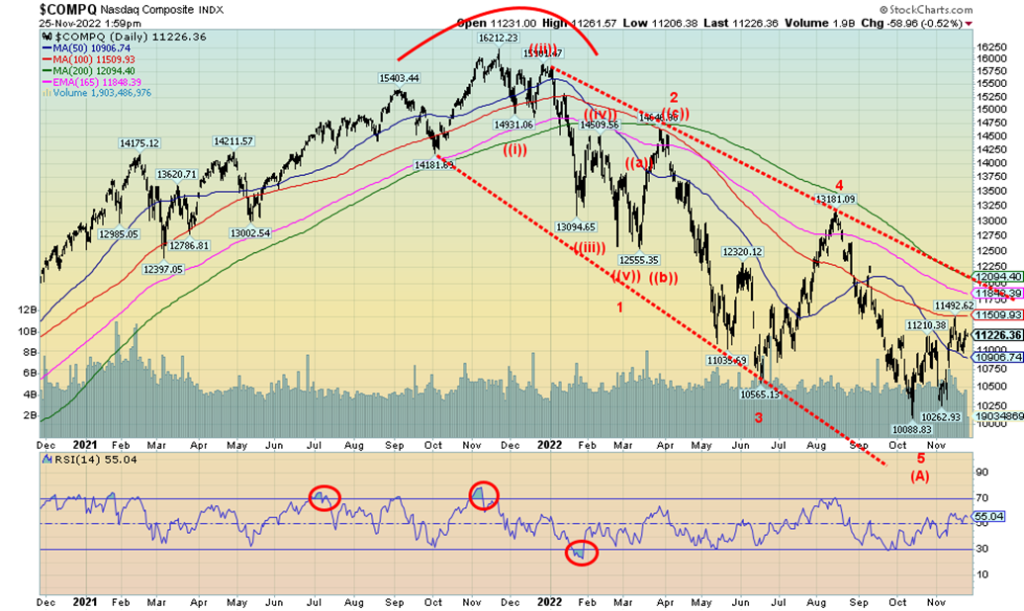
The NASDAQ was the weakest of the major indices this past week with a gain of only 0.7%. Dragging it down was the underperformance of the FAANG stocks. The NYSE FANG Index was down 0.2%. Of the components, the big loser was Netflix, hammered down 13.9%. On the year, the big loser has been Meta, down 66.9%. The only gainers for the FAANGs this past week were Microsoft up 2.8%, Tesla up 1.3%, and the winner Nvidia up 6.0%. The NASDAQ is struggling to gain a foothold as the other indices outperform. What it is telling us is that this rally is all about safety as the DJI has gained almost 20% off its lows, the S&P 500 is up 15%, and the DJT is also up about 21%. The NASDAQ by comparison is up only 11%. The S&P 400 (Mid) is up 17% and the S&P 600 (Small) is up 16%. The NASDAQ has thus far failed to take out its 100-day MA near 11,500. The 200-day MA and that downtrend line remain a way away at around 12,100. A break back under 10,900 would be negative and under 10,400 new lows are highly probable.
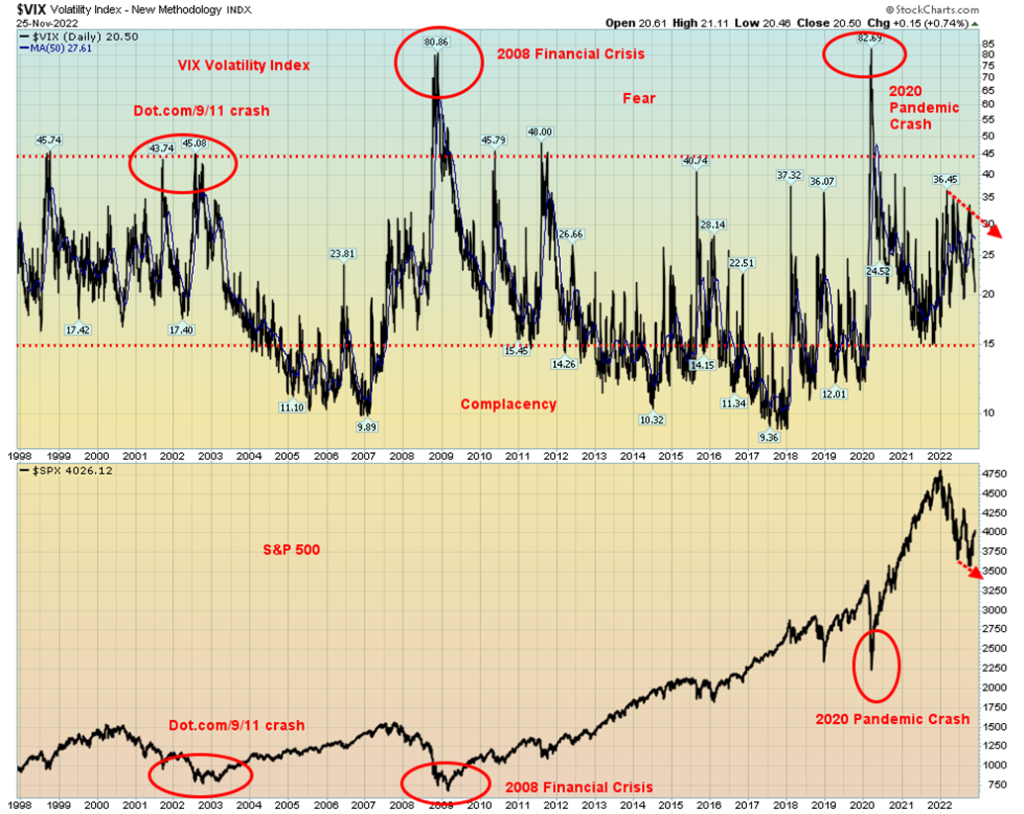
The VIX Volatility Index has been falling. However, it is still well above complacency. We note that while there were some divergences at the recent bottom in the stock market the VIX did not spike to levels seen in 2008 and 2020. The VIX didn’t even reach the levels seen at the time of the dot.com and 9/11 crash. What that suggests to us is more likely we have not seen the final low. Note as well, that despite the powerful rally that took place following the March 2020 pandemic crash the VIX never became complacent as it did from 2003-2007 and again 2016-2018. Maybe they were being more cautious during that final blowoff March 2020 to January 2022.
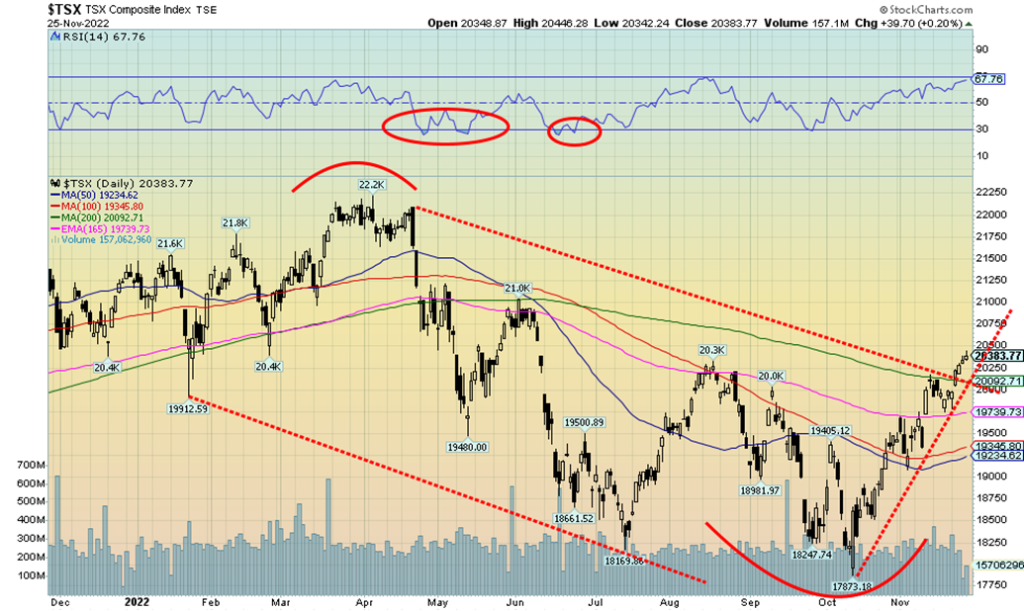
The TSX Composite enjoyed an up week, gaining 2.0%. The junior TSX Venture Exchange (CDNX) continues to struggle, although the index was flat this past week. Of the 14 sub-indices, only one was negative. Health Care (THC), which has struggled all year and is down 50% in 2022, fell 2.6%. Leading the gainers was Materials (TMT), up almost 4%, followed by Golds (TGD), up 3.4%. No other sub-index could garner over a 3% gain. The big question on our mind is, has the TSX broken out? We appear once again to have broken above a downtrend line from the March highs. We are also above the 200-day MA, currently at 20,092. Next resistance is seen near 21,000, but above that we could challenge March highs at 22,200. Through 21,150 would suggest new highs are probable. Support is now down near 20,000, then down to 19,700. The TSX looks higher here as we continue on what we believe is our B wave to the upside.
10-year Treasury Bond/Canadian 10-year Government Bond (CGB)
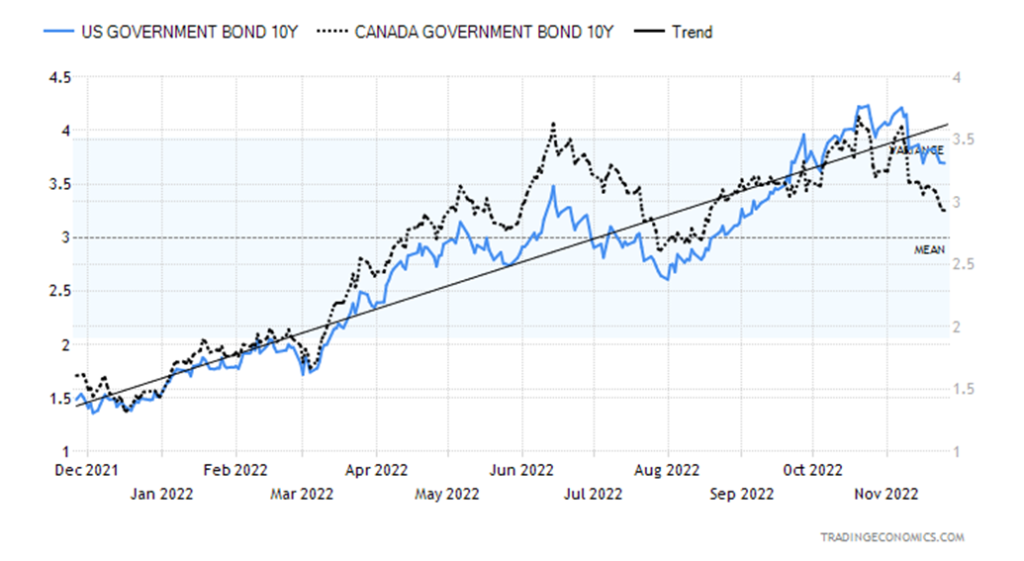
Bond yields continue to fall. Yes, the Fed is hinting at slowing the interest rate rise. Still 50 bp is expected at the December 13–14 FOMC. After that, the next one isn’t until January 25–26, then March 15–16. The hint is that we could only see a 25 bp hike at those meetings. That would bring the Fed rate to 5%. The rise in interest rates has been one of the steepest ever, considering they were near 0% when we started. That’s like the rate going from 5% to 25% in terms of a percentage move. The bond drawdown, because of rising rates, is the steepest in 40+ years. The Bloomberg Global Aggregate Index has fallen 21% from its highs and is down over 16% in 2022. That’s steeper than the drawdown seen during the 2008 financial crisis. With the Fed hiking interest rates and embarking on quantitative tightening (QT), the former Fed put for the market is gone. But what if a recession hits us as is expected in 2023? That will put the Fed between a rock and hard place as loose monetary policy (QE) and ultra-record-low interest rates created bubbles and got us in this mess in the first place. The result is, it will be very difficult to see the Fed lower rates to zero again and flood the financial system with QE once again.
This past week the 10-year U.S. treasury note fell to 3.69% from 3.83% and the Canadian 10-year Government of Canada bond (CGB) was down to 2.93% from 3.13%. The recession spreads (see next chart) widened further to fresh 52-week lows. The 2–10 spread fell to negative 78 bp and the Canada 2–10 spread was down to negative 97 bp. This past week there wasn’t much in numbers to drive the market. Initial jobless claims came in higher than expected at 240,000, above the expected 228,000. Could that mean anything for the upcoming nonfarm payrolls and unemployment numbers due out next Friday, December 2? The expectation is for nonfarm payrolls to come in at 200,000 vs. 261,000 in October and the unemployment rate to remain steady at 3.7%. Canada also reports that they expect employment to fall 20,000 jobs and the unemployment rate to rise to 5.4% from 5.2%.
Yields appear to be headed lower. Concerns that we are headed to a recession are driving yields lower at the moment. But the U.S. treasury market, as we noted, is in some disarray as foreign buyers step away, leaving intergovernmental departments to pick up the slack. A problem in the bond market could translate once again into higher yields. Expect at least a near-term bounce back in yields before another attempt at lower yields gets underway.
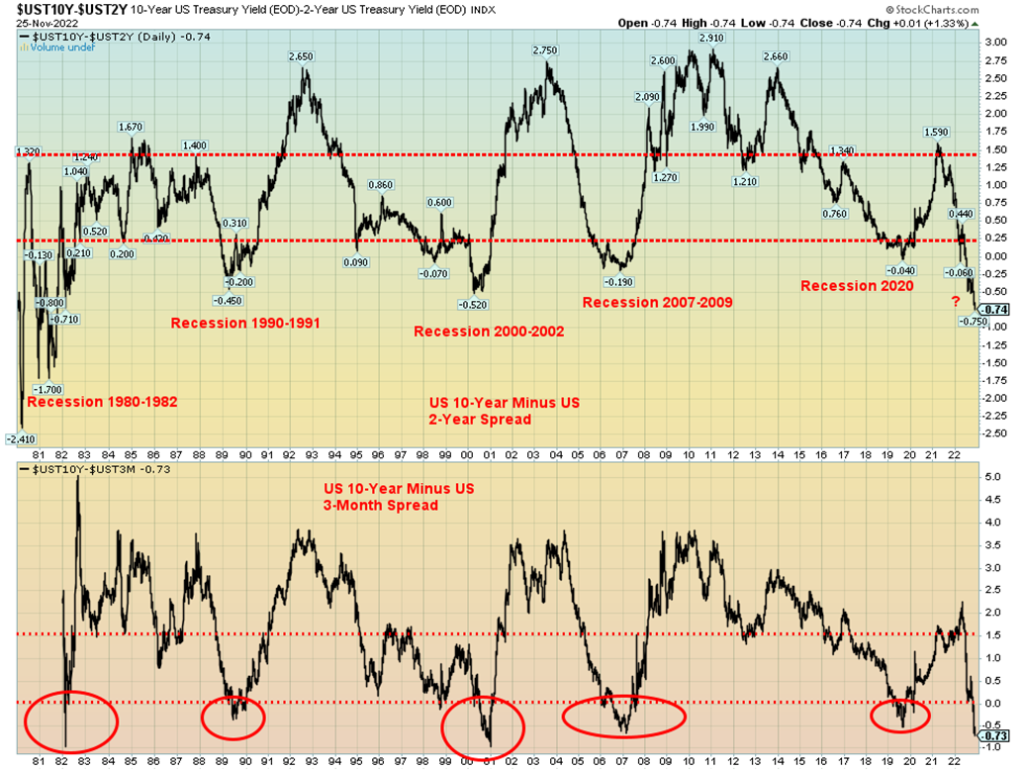
The closely watched recession yield spreads continue to point to a recession in 2023. Both the 2–10 spread and the 3m–10 spread hit fresh 52-week lows this past week. The 2–10 spread is the lowest seen since the 1980–1982 period that resulted in the Fed rate hitting 20% and the steepest recession since the Great Depression. The 3m–10 spread also hit new 52-week lows and is almost where it was in 2001 before that recession and also where it hit in 1982. These negative spreads are a warning of a pending recession. It neither guarantees a recession nor does it tell us how steep the recession could be. But, given we are also at or near record lows, we wouldn’t be surprised if the recession is steeper than many are suspecting.
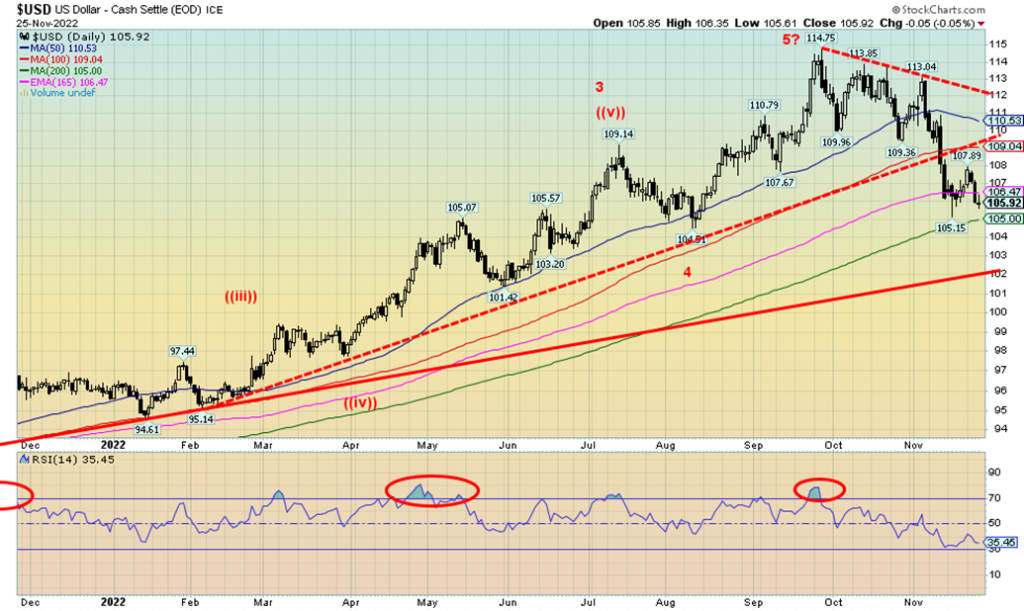
The US$ Index (USDX) appears to be embarking on another downward trend. After hitting near 105, USDX rebounded to almost 108 before failing again. Now we are back under 106 with long-term support looming at 105. A firm breakdown under 105 could take USDX to major support near 102. USDX fell 0.9% this past week. That means that the currencies rose as the euro gained 0.8%, the Swiss franc was up 0.9%, the pound sterling gained 1.8%, and the Japanese yen was up about 0.1%. The Canadian dollar was flat, thanks to the weakness in oil prices. We can see now that there is resistance up to that old trendline near 109. But over that level and definitely over 110.50, USDX could be poised to move higher. Above 112.50 new highs become probable. USDX achieved numerous targets when it hit 114.75, even as it was just short of 115 a preferred target. We believe the high at 114.75 also completed a five-wave up pattern and we are now embarking on a corrective down wave. New highs above 108 would start to change our minds. A good break under 105 could set up further losses.
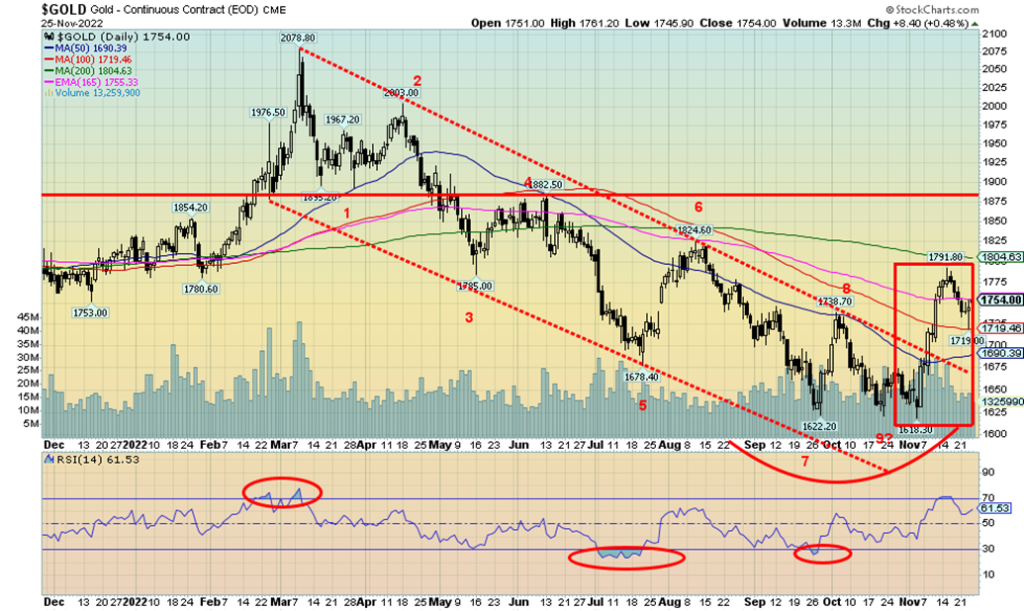
Gold was boringly flat this past week. With not much in the way of drivers for the price, no wonder it just meandered. Yes, the falling US$ Index should have helped, but gold didn’t respond. That might turn out to be a negative sign going forward. Gold was also helped by talk that the Fed might ease up on its rate hikes. But again, if that is correct, then gold should have responded more robustly. Otherwise, maybe the lethargic trading was just the result of the holiday week.
We noted that gold completed what looks like a nine-wave down pattern. But sometimes these can turn into 13-wave declines. The question is whether gold’s current rally is about to be aborted. Silver and gold stocks leading may be positive, but could also be a head fake. While we broke above some key points, more important points to break loom above. The 200-day MA is $1,804 so we must take that out, also take out $1,825, and more importantly $1,875 to tell us we are going higher. While demand has been good and central banks have been buyers, the COVID lockdowns in China are hurting gold there as demand falls. Also, high-interest rates are negative for non-yielding gold. Gold rose 10.7% from that low of $1,618 to the recent high of $1,791. Noticeably, it failed just $1,800, a key point we noted.
Support is down $1,720 (low this week was $1,719), but under that level, we could fall to $1,690/$1,700. Under $1,660 new lows could be seen under $1,618. We still have potentially unfilled targets down to around $1,500. Silver gained 2.1% this past week, and platinum was up 0.4%, but of the near precious metals, palladium fell 6.1% and copper was flat. The gold stock indices rose with the Gold Bugs Index (HUI) up 3.9% and the TSX Gold Index (TGD) up 3.4%.
Given the holiday week, the CBOE does not release its COT report until Monday.
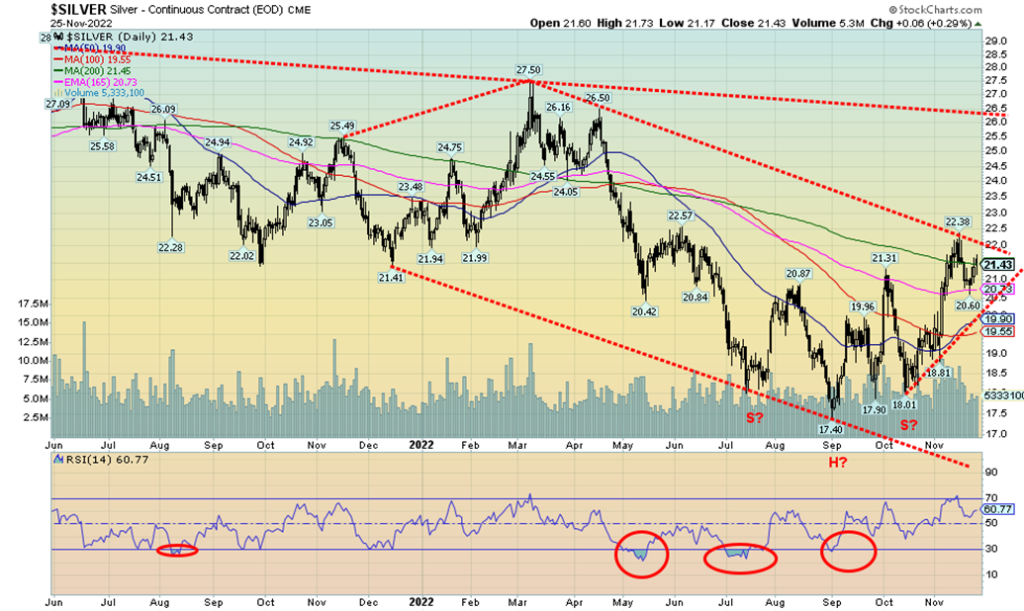
Silver prices rose 0.4% this past week, outpacing gold. If precious metals prices are to go higher, we need to see silver leading the way. Silver is still down 8.2% on the year vs. gold down 4.1%. That gap has narrowed considerably over the past few weeks as silver prices outpace gold prices. The gold/silver ratio has fallen to 81.4 down from a high of 98.3 seen in August 2022. That is still well off the low of 64.3 seen in May 2021. Silver has a way to go. New lows for the gold/silver ratio under 75 could send the ratio down towards 70. Silver has been very choppy the past few months and appears to have possibly formed a head and shoulders bottom pattern. If the pattern is correct, then we have broken out and the potential target is up to $26/$26.50. That would coincide with that major resistance line seen on the charts that comes off the March 2022 high of $27.50.
What’s key for the current pattern is we take out that recent high of $22.38 seen on November 15. If that failed and we broke back under $20.60, we could see a decline instead that re-test the lows. Below $18.80 the H&S pattern is busted and below $18.55 new lows are probable. We note that Elliott Wave International is bearish on silver and they expect to see new lows and a test of the March 2020 low of $11.62. Is it possible?
Yes, given our thoughts on longer-term cycle lows we have often noted. Right now, we need to see a break over $22 and, as noted, new highs above $22.38 to keep alive thoughts we are breaking out.
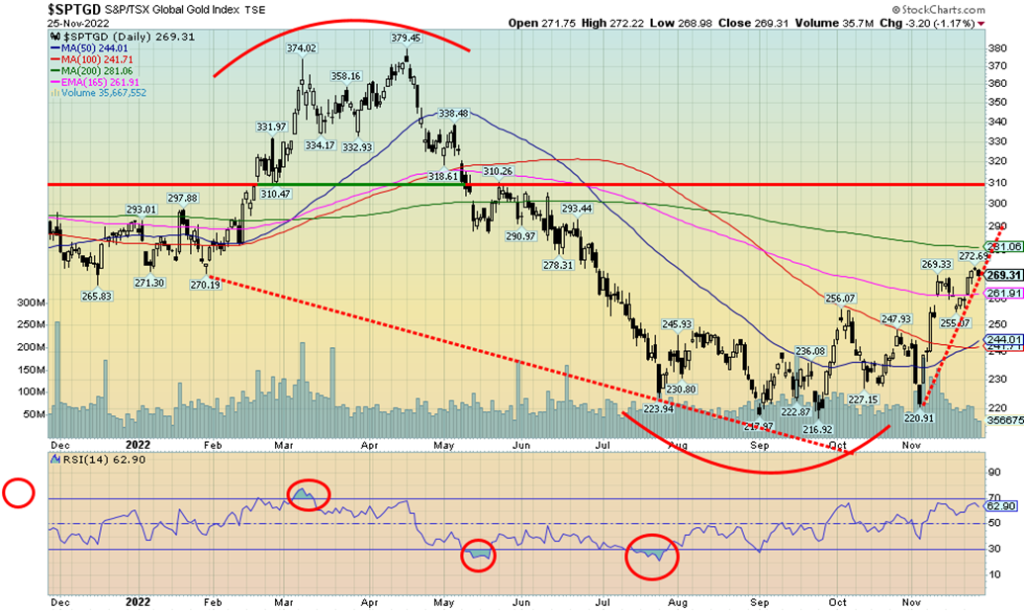
Despite a week in which gold prices were sluggish and flat, gold stocks rose once again. Could the gold stocks be leading? The Gold Bugs Index (HUI) rose 3.9% this past week while the TSX Gold Index (TGD) was up 3.4%. Gold was flat but silver was up 2.1%. While the climb thus far has been steep, when one looks at it in terms of past rebounds it is not unusual. The TGD is up 23.5% since a low on November 3. That’s only slightly faster than the 18.7% rise seen from a low in January 2021 to a comparable date as today in February 2022. Ultimately the January/March rally saw the TGD gain over 40%. A comparable rise today could take the TGD to about 310 on the index. Note that is roughly where that red resistance line is. A firm breakout over 310 could see the TGD challenge the March 2022 high of 379. The all-time high for the TGD was seen back in 2011 at 445.
The TGD is also approaching resistance at the 200-day MA currently at 281. A firm move above that level sets our sites on 310. A move above 340 could suggest new highs above 379. Support is now at 260 and down to 255. Below 255 we could fall to stronger support near 240/245.
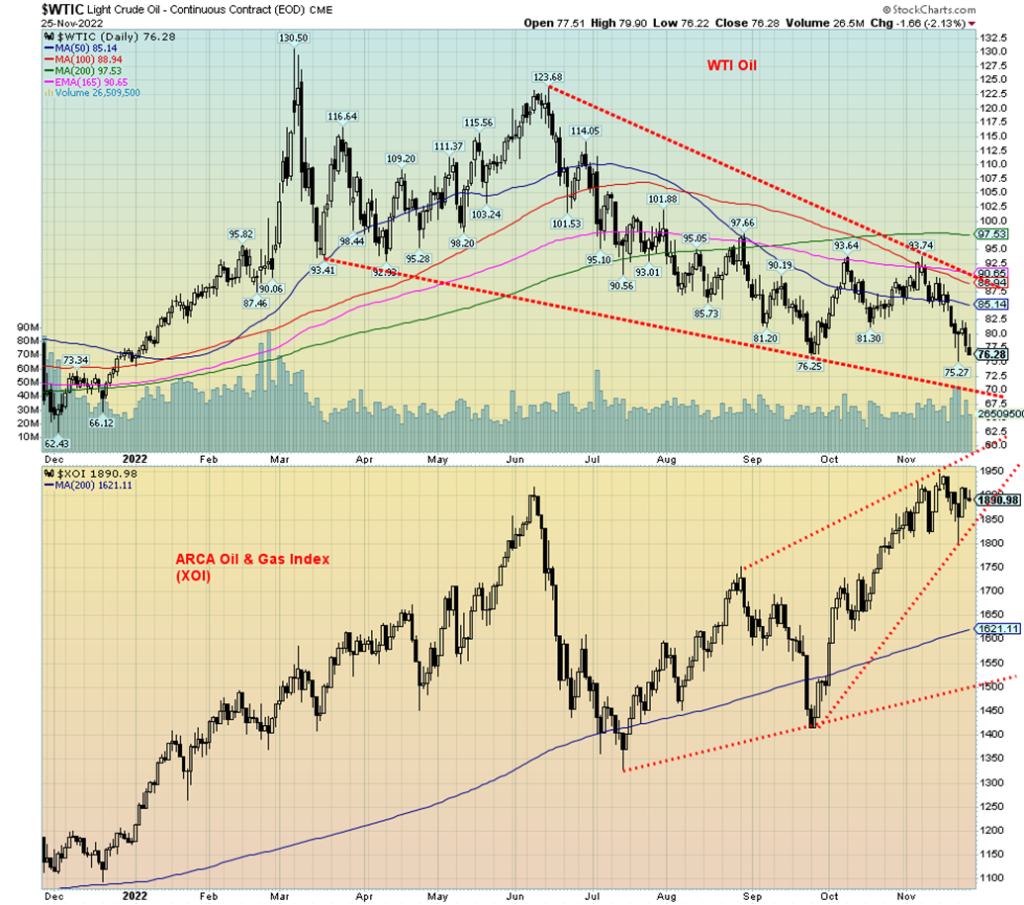
Oil is becoming bearish. It seems a long way now from February when the Russian invasion of Ukraine helped push WTI oil to $130. Now it’s $76 and falling. Why the sudden change? COVID infections have climbed in China and China doesn’t waste time with niceties of mandates and asking nicely. They shut down and clamp down and woe to anyone who steps out of line. The result is people in China are not driving much. However, could things change in China given the mini-revolts that are now taking place as a protest against the lockdowns? Still, with the current lockdowns, demand for oil falls.
The G7 is trying to slap a price-cap on Russian oil which in essence could slap a price cap on all oil. But no one is sure what it actually means. Oil is a weapon. It could translate into shortages even as the price is lower or is falling as production grinds to a halt because of artificially suppressed prices. Russia is the world’s second-largest producer of oil with some 11% of the global market of about 90 million BPD. The intention is to hit Russia in the pocketbook, but the reality is that Russia could just yank the oil off the market, leaving everyone scrambling. Yes, it would hurt them but everyone else could suffer as well because of artificially low prices and developing shortages. Add in the potential for things to still blow up in the Middle East with Iran. Iran’s unrest continues, but so does their enrichment of uranium for the potential production of nuclear weapons. Could the U.S. or Israel hit them to stop them? How would line-ups at the gas pumps be received in North America?
Also hitting was an unexpected build-up in U.S. oil inventories. Put them all together and we have falling prices. The price-cap talk is for oil prices to be in a range of $65–$70/barrel. That’s not much below where we currently are. We noted in earlier reports we have a potential downside target of $69. We’re not that far away.
WTI oil fell almost $4 this past week or 4.8%. But natural gas (NG) is once again being pressured to the upside because of low inventories and soaring demand. NG production is also high, but clearly not high enough. NG rose 16.3% this past week while NG in the EU at the Dutch Hub was up 7.7%. The EU and the UK are facing extremely high energy bills because of the rise in NG prices in particular but also oil prices. The energy stocks were lethargic in face of the shortened week, with the ARCA Oil & Gas Index (XOI) up 0.4% and the TSX Energy Index (TEN) up 0.1%.
Oil prices are falling. But that may only be temporary as the winter season gets underway. If the price-cap fails, it could also have a negative impact. We note that not all EU countries are onside with this price-cap. Oil’s seasonal strength is seen between December and June.
The current down wave for WTI oil has always appeared to us as a B wave correction to the long rise from March 2020 at $6.50 to the high of $130.50 in March 2022. Once this wave is complete, another wave to the upside should get underway that could see new highs. $69 remains are target, but we could dip as low as $65 before stability sets in. NG prices are rising, but we need to rise above $8.80 to suggest to us that new highs could be seen. EU NG is well off its high of €339 vs. today’s price of €124.
Copyright David Chapman, 2022
__
(Featured image by Nicholas Cappello via Unsplash)
DISCLAIMER: This article was written by a third party contributor and does not reflect the opinion of Born2Invest, its management, staff or its associates. Please review our disclaimer for more information.
This article may include forward-looking statements. These forward-looking statements generally are identified by the words “believe,” “project,” “estimate,” “become,” “plan,” “will,” and similar expressions. These forward-looking statements involve known and unknown risks as well as uncertainties, including those discussed in the following cautionary statements and elsewhere in this article and on this site. Although the Company may believe that its expectations are based on reasonable assumptions, the actual results that the Company may achieve may differ materially from any forward-looking statements, which reflect the opinions of the management of the Company only as of the date hereof. Additionally, please make sure to read these important disclosures.
David Chapman is not a registered advisory service and is not an exempt market dealer (EMD) nor a licensed financial advisor. He does not and cannot give individualised market advice. David Chapman has worked in the financial industry for over 40 years including large financial corporations, banks, and investment dealers. The information in this newsletter is intended only for informational and educational purposes. It should not be construed as an offer, a solicitation of an offer or sale of any security. Every effort is made to provide accurate and complete information. However, we cannot guarantee that there will be no errors. We make no claims, promises or guarantees about the accuracy, completeness, or adequacy of the contents of this commentary and expressly disclaim liability for errors and omissions in the contents of this commentary. David Chapman will always use his best efforts to ensure the accuracy and timeliness of all information. The reader assumes all risk when trading in securities and David Chapman advises consulting a licensed professional financial advisor or portfolio manager such as Enriched Investing Incorporated before proceeding with any trade or idea presented in this newsletter. David Chapman may own shares in companies mentioned in this newsletter. Before making an investment, prospective investors should review each security’s offering documents which summarize the objectives, fees, expenses and associated risks. David Chapman shares his ideas and opinions for informational and educational purposes only and expects the reader to perform due diligence before considering a position in any security. That includes consulting with your own licensed professional financial advisor such as Enriched Investing Incorporated. Performance is not guaranteed, values change frequently, and past performance may not be repeated.


Switzerland’s Medical Cannabis Reform Advances Access, But Barriers Remain
Switzerland’s 2022 medical cannabis reform improved patient access by removing federal approval requirements, but challenges remain. MEDCAN highlights barriers including...


Swisscanto Launches Catastrophe Bond Fund for Portfolio Diversification
Swisscanto launches a Luxembourg UCITS catastrophe bond fund, giving qualified investors access to insurance-linked securities tied to extreme natural events....


AI Agents Transform Payments as Visa, Mastercard, and Qonto Tackle Trust, Liability, and Regulation
Visa and Mastercard are advancing AI-driven autonomous payments, shifting focus to trust, liability, and regulation when agents act without real-time...

Bitcoin ETFs Lead as German Stock Exchange Debuts Mining ETF
Bitcoin and Ethereum remain largely flat, with BTC near 66,600 and ETH around 1,920, while ETFs see steady inflows. A...


Ali G Makes Surprise Wimbledon Appearance with Cannabis-Themed Satire
Sacha Baron Cohen revived his iconic Ali G character at Wimbledon’s men’s final, blending satire with British high society. Dressed...
 |
|
 |  |
 |
|
-

 Biotech1 week ago
Emily.AI: Personalized Oxygen Therapy Earns Global AI Recognition
-

 Fintech2 weeks ago
Revolut Updates Crypto Rules for Deposits and System Errors
-
 Business3 days ago
The $40 Trillion Trap: Disinflation Is Not Deliverance
-

 Cannabis2 weeks ago
Germany Tightens Cannabis Reimbursement Rules: Approved Medicines Must Come First