Markets
From Euphoria to Uncertainty: Markets Wobble Amid Trump’s Return, Geopolitical Strains, and Gold’s Ascent
Three weeks after Trump’s re-election, markets shifted from initial euphoria to caution. Overvalued stocks, escalating geopolitical tensions (e.g., Russia/Ukraine), and rising gold prices signal instability. Gold nears all-time highs, while silver lags. Oil surged on war fears, and Trump’s controversial cabinet picks add uncertainty. Sustained stock recovery remains doubtful amid negative indicators.

It’s been three weeks since the election of Donald Trump as president of the U.S. The initial reaction of the stock markets was to shoot up roughly 5.3%, topping on November 11, 2024. Since then, however, the stock market has come off about 1%. Not a serious break by any means but nonetheless a surprise for many who expected the stock market to keep on rising. Instead, it looks wobbly but has not as yet given any sell signal. Currently, we are working on a bounce-back from the initial small drop of about 3%. Any new highs would accentuate the growing negative divergences.
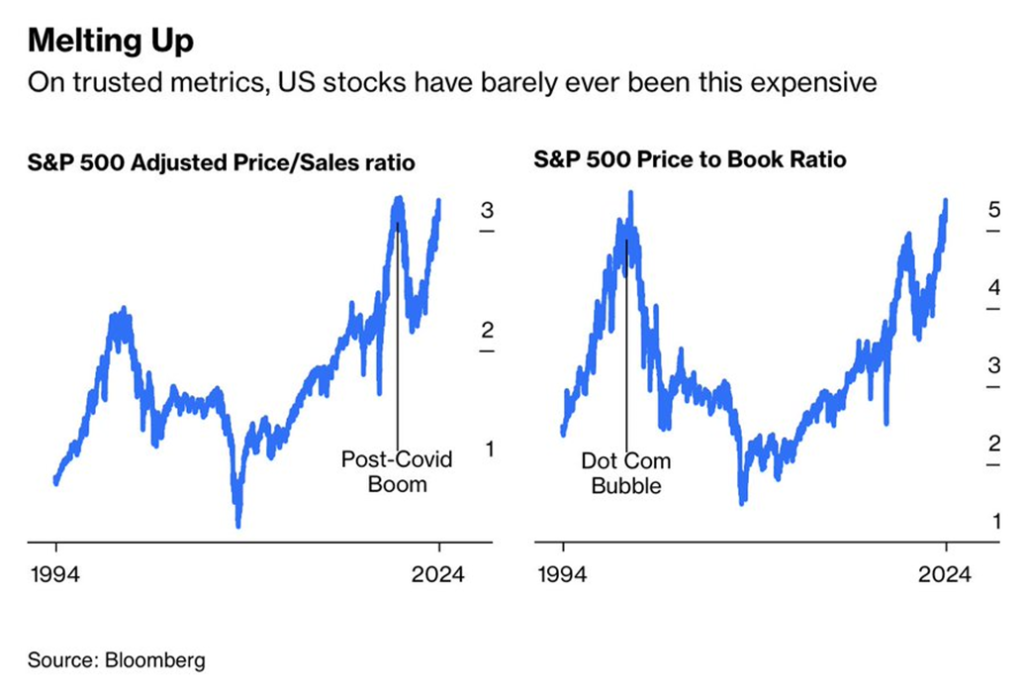
For months we have been noting growing negative divergences, with the price on the stock market as it makes new highs not being confirmed by indicators that make lower highs. As well, valuations have shot through the roof and, for most, are as high as they have ever been. By numerous methods, the stock market is considerably overvalued. One good example is the chart on the next page that shows the S&P Adjusted Price/Sales Ratio and the S&P Price to Book Ratio at levels associated with previous major tops.
Normally, everyone looks at the P/E ratio, which is at 30.25. That’s below levels seen previously, especially in 2009 at the peak of the 2008 financial crisis, but also below the peak in 2001 during the dot.com crisis and the level seen in 2020 during the pandemic. It is the fourth highest level in 153 years. The mean is 16.10.
Similarly, the Shiller PE Ratio is at 37.7, the third highest level ever, surpassed only by the 2000 peak during the dot.com crisis and in 2021 while the pandemic was still present. The mean over 153 years is 17.2. PE is popular and widely followed. Analysts tend to put more emphasis on it then other value indicators. But the others are worth looking at as well.
Overvaluation is just part of it. Wall Street has done an about turn. It realizes that Trump’s proposals, particularly those related to the debt, tariffs, and immigration, could be quite inflationary and add considerably to the debt, which is the highest government debt in the world, representing some 11% of global debt. Supply disruptions could result, considering proposed mass layoffs (firings?) and the deportation of immigrants, many of whom are employed, especially in construction and agriculture.
There is also growing concern about a number of Trump’s appointees to cabinet, especially in Justice (now resolved), Defence, Security, Health Care, and Medicare/Medicaid. No cabinet appointee has yet to be vetted by the Senate, and many of them could face tough questioning and even rejection. This is irrespective of the desire to use recess appointments, which would require the Senate to adjourn for at least 10 days.
At maximum, recess appointments can serve for only two years. But the odds of an adjournment are slim. Currently, the Democrats control the Senate, but even after January 20, 2025 Republican senators have already expressed reservations concerning a few appointees. It would only take three Republican senators flipping their vote for the appointees to lose.
Add in the elevation of the war between Ukraine/Russia where the injection of North Korean troops and the authorization by the U.S. and U.K. to Ukraine to use long-range U.S./U.K. missiles to be used deep inside Russia has sparked sharp responses from Russia. They have threatened to lower their nuclear alert, plus using ICBM missiles to attack Ukraine. Some NATO countries have already indicated support for invoking Article 5. Word has come that upwards of 800,000 NATO troops are to be deployed in Germany. As well, the Israel/Hamas/Hezbollah war is still nowhere near resolution, with calls in Israel to annex the West Bank and Northern Gaza. Lurking in the background is Iran, which could still help elevate this war.
Debt, tariffs, supply disruptions, and war all are inflationary. That also doesn’t take into consideration potential Chinese retaliation, which could range from devaluing the yuan, to imposing tariffs, to changes that would negatively impact U.S. companies operating in China. It could then force the Fed to hike rates instead of lowering them. As we have noted, bond yields are already up 79 bp as measured by the U.S. 10-year treasury note since the Fed cut in September, and are up 12 bp since November 5, 2024. Short rates down, long rates up. The bond market, because of its sheer size, is far more important than the stock market but few pay enough attention to it.
Jobs Quits Rate vs. Unemployment Rate 2000–2024
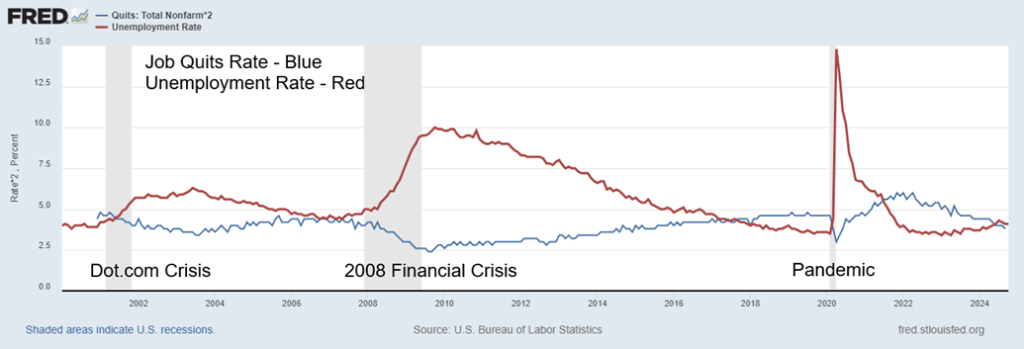
Other things have caught our attention that point to things getting worse, not better. Job quits have fallen to their lowest level since the pandemic in 2020–2021. This reflects growing concern about the economy as job layoffs rise, with the potential for further rises. It’s safer to stay where one is rather than gamble on finding something else elsewhere. At the same time, unemployment is rising. We note that during the dot.com crisis, the 2008 financial crisis, and the pandemic (although more difficult to discern) job quits fell while unemployment rose. Will it be different time? Not likely.
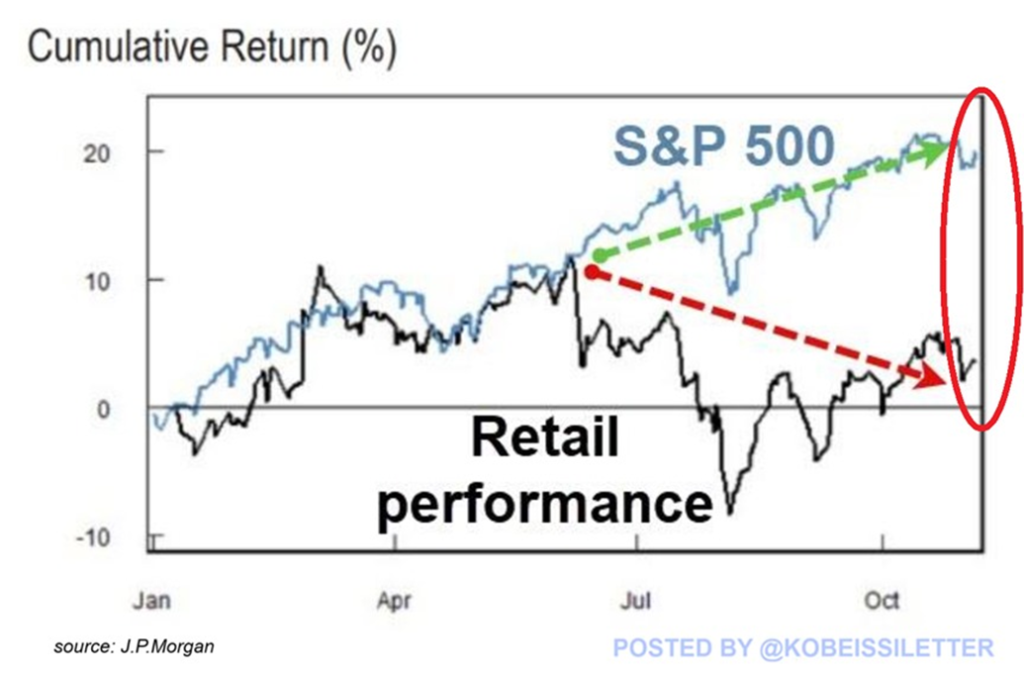
The next chart is interesting as it shows the S&P 500 returns on the upper line while the lower line shows actual returns in retail brokerage accounts. What that means is that small investors, through funds, etc., are underperforming the stock market with about a 4% gain for investors vs. about 25% for the stock market. An interesting divergence. What is really interesting is that the two largely tracked each other through to June–July 2024 but have since diverged widely. There are many theories, but most we read pointed to political concerns.
Another interesting chart is the share of quarterly treasury issuance to GDP. It has been mostly steady through the 2000s, but during the pandemic it leaped. It came down afterward, but has been rising steadily again. This is gross issuance, not net of repayments. The reality is that it is settling in to around 25% of GDP. We’ve said the size of the U.S. debt is unsustainable. Obviously, so is this. It puts a lot of pressure on funds and others stepping up at treasury auctions. That’s difficult when they are saturated with the stuff and even foreigners (i.e. central banks, pension funds) are balking at adding new U.S. debt securities.
Our final chart is interesting as it shows how the number of global armed conflicts has been steadily rising since the 2008 financial crisis and the EU debt crisis. As climate change ravages the world, creating droughts, floods, and severe storms, more conflicts are sure to rise as there is a fight for arable land. In 2011, Gwynne Dyer, a military historian and journalist, published a book titled Climate Wars. In it, he outlined how waves of refugees, failed states, and pandemics could trigger a sharp rise in conflicts globally. As it turns out, his book is prescient. Instead of going down, wars are rising and appear destined to get worse.
As we have noted, this is 2024, not 2016. The world is in a very different place and much more dangerous. Eventually, that could have an impact on the stock market and people’s wealth.
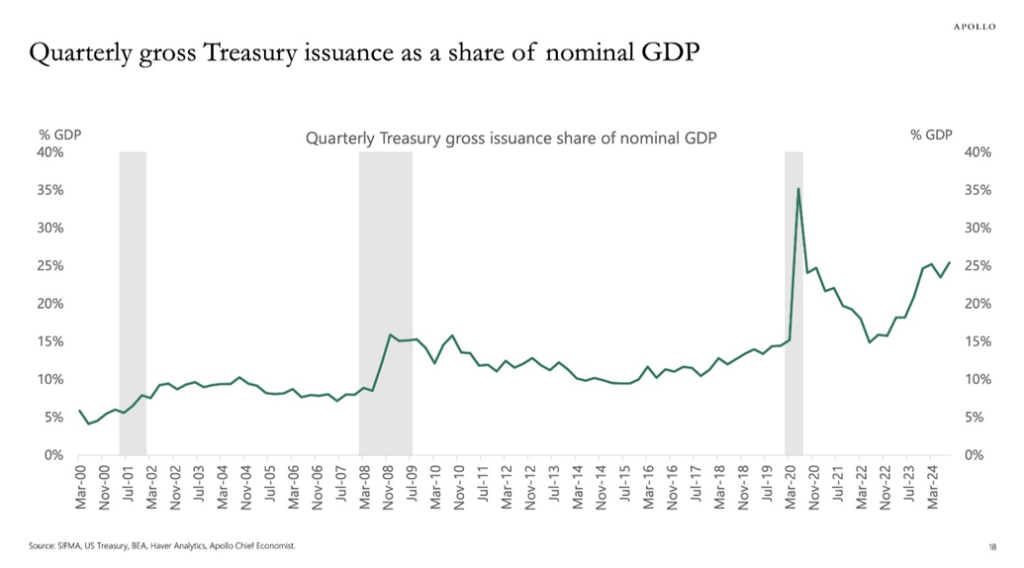
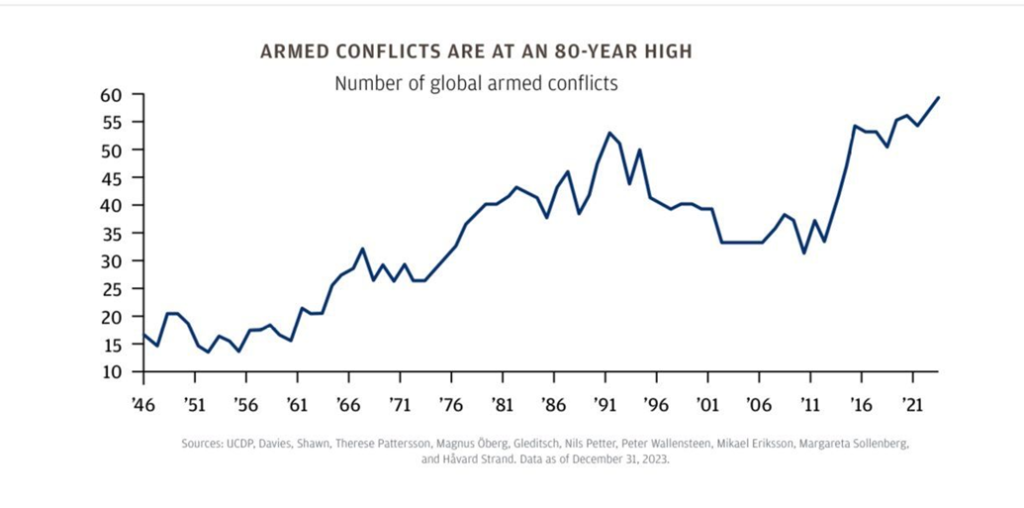
Chart of the week
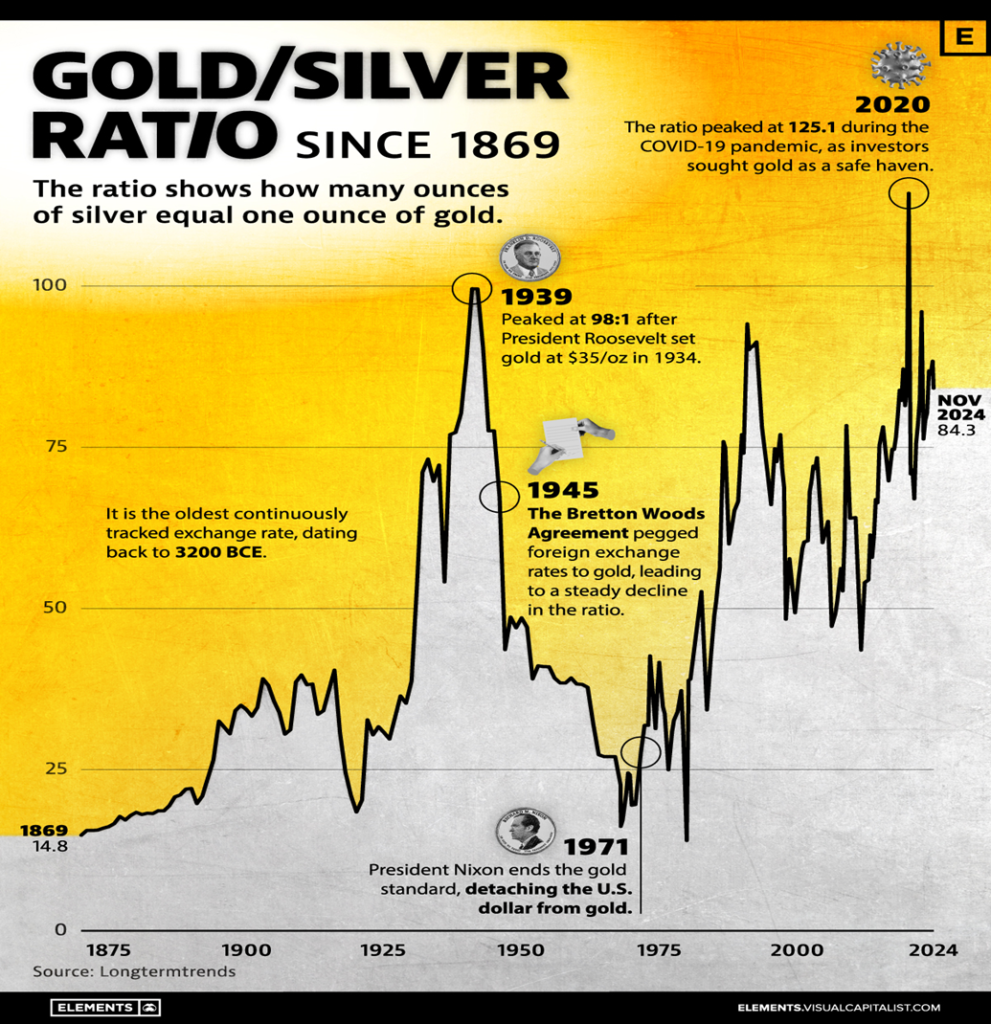
The visuals on this chart are far better than what we could produce. We have shown other versions of the gold/silver ratio before. However, it’s worth showing as, once again, it shows how undervalued silver is compared to gold. The ratio has been around since 3200 BC. It was created to ensure that coins had consistent value. Menes, the first King of Ancient Egypt, set the ratio at 2.5:1. That might have been a bit low. Some studies have shown that the ratio of silver in the ground to gold is around 15:1 or up to 18:1. The Romans were the first ancient civilization to set a ratio, first at 8:1 around 210 BC, then up to 11:5 under Julius Ceasar. Augustus bumped it to 11.75:1.
The ratio varied over the years. It was officially set at 12:1, but by 1350 it fell back to 9.4:1. In 1450, it was back to 12:1. In the Coinage Act of 1792, the U.S. set it at 15:1. When Franklin Roosevelt revalued gold at $35, the ratio peaked at 98:1 in 1939. The Bretton Woods agreement helped the ratio fall over the years. But then it started rising again, peaking first at 97.5:1 in 1999 and finally, at the time of COVID, rising to 125:1. Today it sits around 84:1, still way too high. During the silver melt-up in 1979–1980 the ratio fell to around 17.5:1.
The ratio has been making what appears to be topping action for years now, but hasn’t broken under 75:1. In 2021, it did fall to 63:1 but then rose again. It would take a firm break under 70:1 to suggest to us that we are really going lower. Initially, a break under 80:1 would be a positive development.
A long history, but at current levels silver remains cheap relative to gold.
Markets & Trends
| % Gains (Losses) Trends | ||||||||
| Close Dec 31/23 | Close Nov 22, 2024 | Week | YTD | Daily (Short Term) | Weekly (Intermediate) | Monthly (Long Term) | ||
| Stock Market Indices | ||||||||
| S&P 500 | 4,769.83 | 5,969.34 | 1.7% | 25.2% | up | up | up | |
| Dow Jones Industrials | 37,689.54 | 44,296.51 | 2.0% | 17.5% | up | up | up | |
| Dow Jones Transport | 15,898.85 | 17,366.87 | 0.8% | 9.2% | up | up | up | |
| NASDAQ | 15,011.35 | 19,003.65 | 1.7% | 26.6% | up | up | up | |
| S&P/TSX Composite | 20,958.54 | 25,444.28 (new highs)* | 2.2% | 21.4% | up | up | up | |
| S&P/TSX Venture (CDNX) | 552.90 | 606.17 | 2.5% | 9.6% | neutral | up | down (weak) | |
| S&P 600 (small) | 1,318.26 | 1,517.34 | 3.7% | 15.1% | up | up | up | |
| MSCI World | 2,260.96 | 2,327.14 | flat | 2.9% | down | up | up | |
| Bitcoin | 41,987.29 | 99,002.07 (new highs)* | 8.5% | 135.8% | up | up | up | |
| Gold Mining Stock Indices | ||||||||
| Gold Bugs Index (HUI) | 243.31 | 308.33 | 8.1% | 26.7% | down (weak) | up | up | |
| TSX Gold Index (TGD) | 284.56 | 365.98 | 7.8% | 28.6% | down (weak) | up | up | |
| % | ||||||||
| U.S. 10-Year Treasury Bond yield | 3.87% | 4.42% | (0.7)% | 14.2% | ||||
| Cdn. 10-Year Bond CGB yield | 3.11% | 3.46% | 4.9% | 11.3% | ||||
| Recession Watch Spreads | ||||||||
| U.S. 2-year 10-year Treasury spread | (0.38)% | 0.03 | (76.9)% | 107.9% | ||||
| Cdn 2-year 10-year CGB spread | (0.78)% | 0.07% | (30.0)% | 109.0% | ||||
| Currencies | ||||||||
| US$ Index | 101.03 | 107.53 (new highs) | 0.8% | 6.4% | up | up | up | |
| Canadian $ | 75.60 | 71.53 | 0.8% | (5.4)% | down | down | down | |
| Euro | 110.36 | 104.17 (new lows) | (1.1)% | (5.6)% | down | down | down (weak) | |
| Swiss Franc | 118.84 | 111.81 | (0.7)% | (5.9)% | down | neutral | up | |
| British Pound | 127.31 | 126.32 | (0.6)% | (1.6)% | down | down (weak) | neutral | |
| Japanese Yen | 70.91 | 64.58 | (0.3)% | (8.9)% | down | down | down | |
| Precious Metals | ||||||||
| Gold | 2,071.80 | 2,712.20 | 5.5% | 30.9% | neutral | up | up | |
| Silver | 24.09 | 31.34 | 3.0% | 30.1% | down (weak) | up (weak) | up | |
| Platinum | 1,023.20 | 975.10 | 3.2% | (4.7)% | down | down | down (weak) | |
| Base Metals | ||||||||
| Palladium | 1,140.20 | 1,019.30 | 8.1% | (10.6)% | neutral | up | down | |
| Copper | 3.89 | 4.09 | 0.7% | 5.1% | down | down | up (weak) | |
| Energy | ||||||||
| WTI Oil | 71.70 | 71.24 | 6.5% | (0.7)% | neutral | down | down | |
| Nat Gas | 2.56 | 3.29 | 16.7% | 28.5% | up | up | down (weak) | |
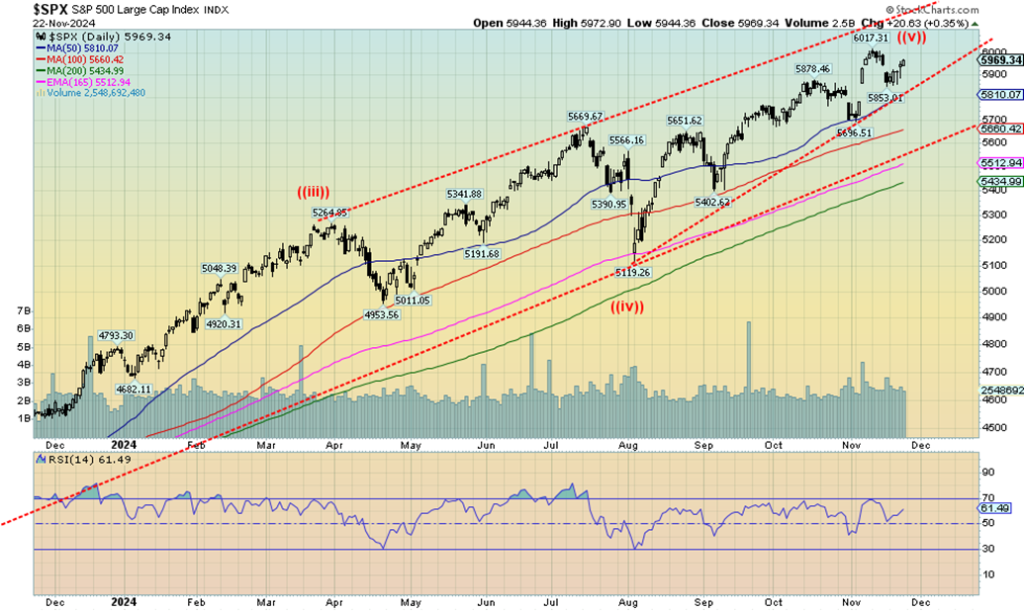
Which way will the market go as Trump prepares to take over? So far, the response has been lukewarm. We topped, then fell, and now are regaining but so far have fallen short of new highs. On the week, the S&P 500 (SPX) gained 1.7% and for a change did not make new all-time highs. It doesn’t yet negate the previous week’s loss. Only new highs above 6,017 could do that. A break under 5,800 could spell trouble and begin to confirm a top.
Under 5,700, a top could be confirmed and under 5,400 further drops could be in store. The 200-day MA is at 5,435. We also appear to be forming a rising wedge triangle which is bearish if broken. That breaks at the previously mentioned 5,800 and potentially targets all the way back to 5,100.
On the week, the Dow Jones Industrials (DJI) gained 2.0%, the Dow Jones Transportations (DJT) was up 0.8%, the NASDAQ was up 1.7%, while of the junior indices the S&P 400 (Mid) was up 4.2% to new all-time highs (the only one) while the S&P 600 (Small) gained 3.7%. The latter two gaining suggests the market is broadening out, which could be bullish. But a reminder that the market is also grossly overvalued and the backdrop is anything but positive, with threats of war rising.
The big winner on the week was Bitcoin, up 8.5% to new all-time highs and on the verge of breaking $100,000. That level could prove to be a euphoric top. The S&P 500 Equal Weight Index gained 2.6% while the NY FANG Index was up 2.3%.
In Canada, the TSX Composite hit new all-time highs, again up 2.2% while the TSX Venture Exchange (CDNX) was up 2.5%. In the EU, the London FTSE was up 2.3%, the EuroNext was up 0.3%, the Paris CAC 40 fell 0.2%, while the German DAX was up 0.6%. Still, the EU is nervous about the escalation in the Russia/Ukraine war. In Asia, China’s Shanghai Index (SSEC) was down 1.9%, the Tokyo Nikkei Dow (TKN) was off 0.9%, and Hong Kong’s Hang Seng (HSI) fell 1.0%. Overall, the U.S. is up, the EU is generally flat, and Asia is down.
This week is Thanksgiving so it could be a quiet market. Markets are closed Thursday and Friday is Black Friday, the big shopping day, with markets closing early. Typically, the market gains on the day before Thanksgiving. But the record of the Wednesday to Friday Thanksgiving period is only 19 up out of 35 observations. It’s more like, beware the following Monday as big drops have been seen, particularly in 2008 and 2022. The killer was the 680-point drop for the DJI in 2008. The stock markets have fallen 42 times out of 70 since 1952 on the Monday following Thanksgiving. The so-called Santa Claus rally doesn’t come until late December/early January.
There is negativity in the background with a grossly overvalued market and wars escalating. It’s an overbought market and Buffett has cashed out with a $325 billion cash pile. Caution is warranted.
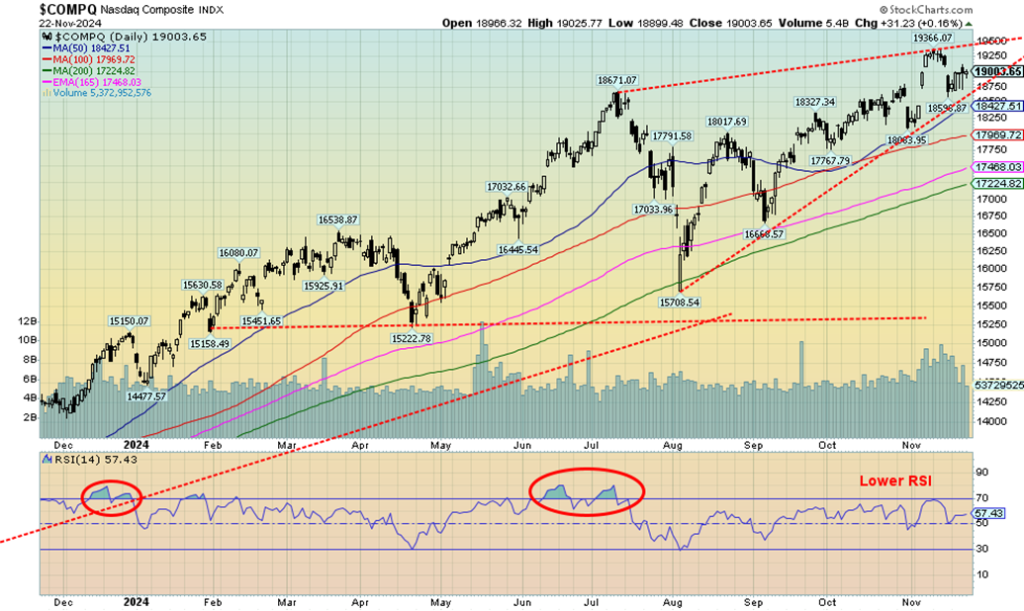
The NASDAQ gained 1.7% this past week but remains short of new all-time highs. The NY FANG Index was up 2.3% so, as usual, gains for the MAG7 helped. Of the MAG7, Netflix hit new all-time highs, up 9.0% while Tesla also hit new all-time highs, up 9.9%. Tesla continues to climb in the global largest corporations, now at #8 with a market cap of $1.6 trillion. Nvidia is the largest, now at $4.9 trillion. Nvidia is now larger than Japan (GDP $4.2 trillion), so that would make Nvidia the third largest economy in the world if it were a country.
Tesla would come in now just ahead of number 14, Mexico. With corporations that large, they have influence far greater than any country. The biggest gainer on the week was Snowflake, up 32.9%. Were there any losers? Yes, Google fell 4.2%, while Amazon was off 2.7%. The biggest losers were the Chinese techs Baidu and Alibaba, down 5.0% and 6.2%. That the NASDAQ was not making new highs has set up a potential wedge triangle pattern. A break now under 18,550 could trigger a potential drop back to around 15,700 and major support. The 200-day MA is at 17,225. The NASDAQ has room to rise to 19,500 and stay within the wedge triangle. That would also make new all-time highs.
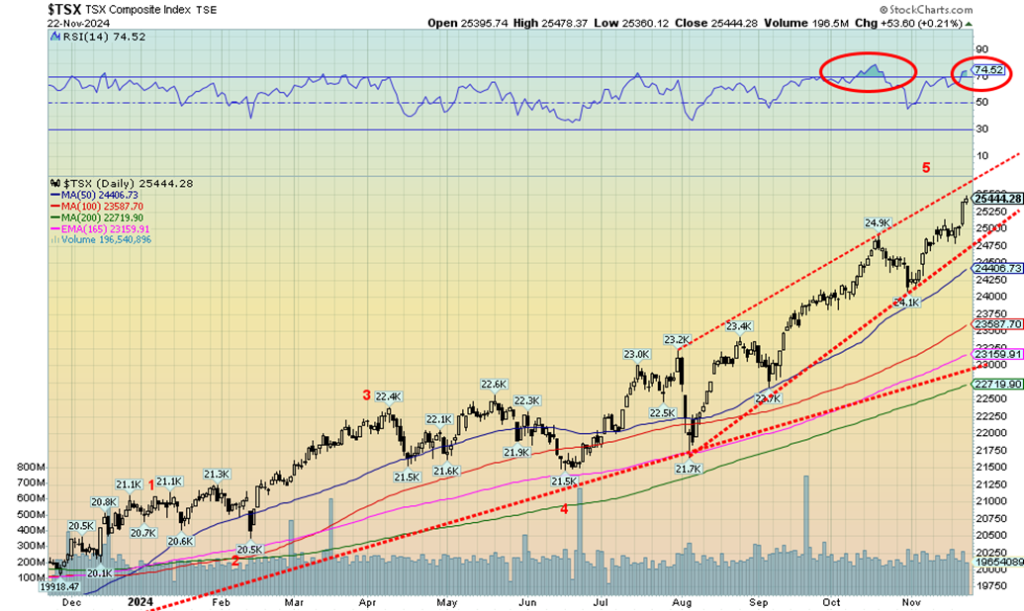
Once again, the TSX Composite made all-time highs this week, thanks to the performance of Materials (Golds, Metals) plus Energy. The TSX gained 2.2% on the week. The junior TSX Venture Exchange (CDNX) also gained, up 2.5%, while the TSX 60 also made fresh all-time highs, up 2.2%. Despite new all-time highs, the TSX lags some of the of the U.S. indices; however, it is up 20.1% on the year. The CDNX is up a more modest 9.6% in 2024. Of the 14 sub-indices, four were down with 10 up. Financials TFS made fresh all-time highs, gaining 1.5%.
The leader this past week was Golds TGD, up 7.8% followed by Materials TMT, up 6.6%, and Energy TEN gaining 4.0%. There were no significant losses for the losers, but Telecommunications TTS fell 0.9%. Telecommunications has been a weak link all year, down 13.5%, the only sub-index in negative territory. It’s all thanks to BCE Inc. falling 23.6% so far in 2024. BCE is the largest corporation in the sub-index.
The TSX has been rising steadily, but the pattern still suggests this is a fifth wave up. We are approaching the top of the bull channel, so we could still have room to move higher. The channel breaks under 24,750 and a confirmed break would occur under 24,100. Much further down at 21,700 a bigger break could occur. We are currently in overbought territory with an RSI of 74.52. Note that overbought is a state that can remain around for some time. It is, however, a warning.
U.S. 10-year Treasury Note, Canada 10-year Bond CGB
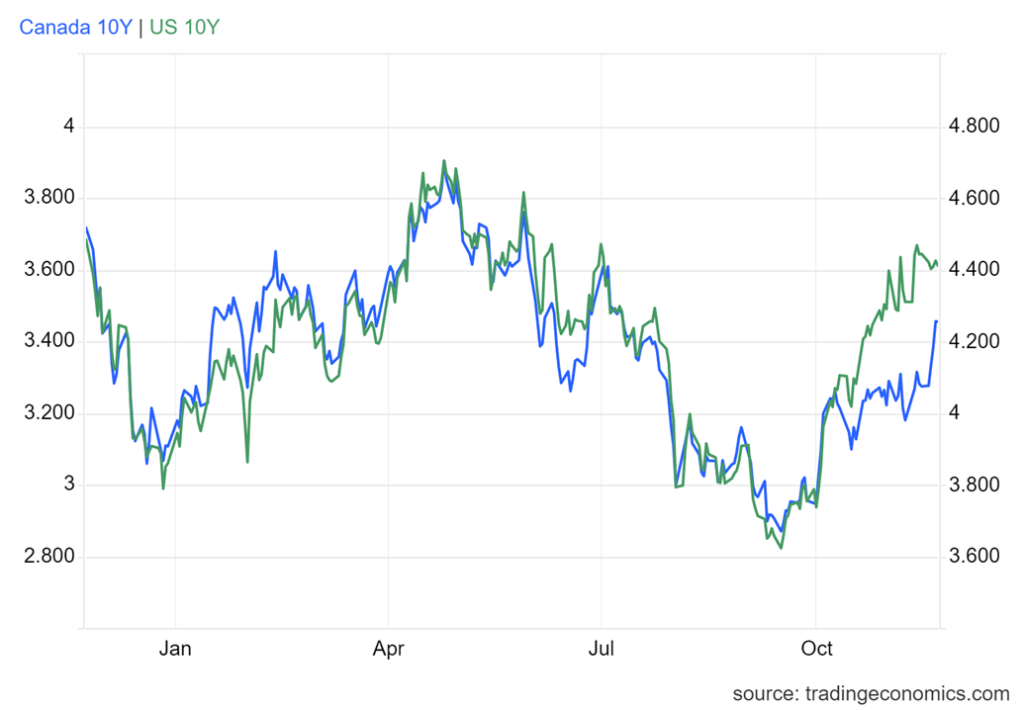
There wasn’t much movement for the U.S. 10-year treasury note this past week as it fell 3 bp or 0.7%. Canada did see a rise for the 10-year Government of Canada bond (CGB) that was up 16 bp to 3.46% or 4.9%. The Canada bond rose because of an uptick in inflation as the October CPI rose 2.6%, up from 2.4% in September and above consensus at 2.4%. Canada housing starts were also better than expected at 240,800 vs. the expected 226,000 and the previous month’s 223,400. The Canada PPI was more modest, up 1.1%, but still well above the expected 0.1%. Finally, Canada retail sales were up 0.8% year over year (y-o-y), just under the expected 0.9%. The gain was modest at best, weak at worst. The 2–10 spread fell to 0.07 from 0.10. Still positive.
There wasn’t a lot to trade off for the U.S. except for a stronger than expected reading of 55.3 for the S&P Global PMI when all they expected was 54.3. It was the strongest reading since April 2022. It helped add fuel to the notion that the Fed may cut only 25 bp at the December FOMC. Short rates backed up a bit as the 2-year treasury note rose 7 bp as the 10-year fell 3 bp. As a result, the 2–10 spread narrowed to 3 bp from 13 bp.
Initial jobless claims continued to fall, this time at 213,000 vs. last week’s 219,000 and the expected 224,000. Labour markets are still good. But remember, unemployment is a lagging indicator.
This week is Thanksgiving week with markets closed Thursday and sluggish with early closings on Friday. Numbers to watch this week are home price indices, PCE prices, the Chicago PMI, and the second estimate for GDP growth Q3. It is expected to be 2.8% vs. 3% in the last reading. Still good growth. We’re not expecting any big moves in bond yields this coming week.
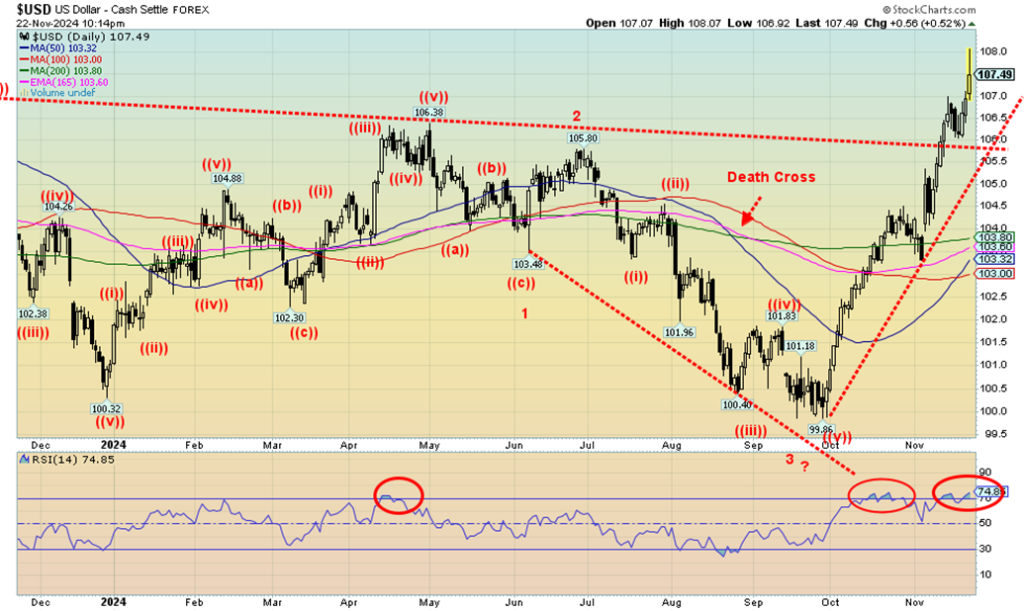
Up, up, and away in our flying US$ Index. Once again, the US$ Index leaped up 0.8% to fresh 52-week highs. Overbought conditions that have largely prevailed since early October continue. If the US$ Index is making new highs, someone else might be making new lows. The winner (or loser in this case) is the euro that fell to 52-week lows, down 1.1% on the week and 5.6% in 2024 vs. the US$ Index up 6.4% in 2024. Other currencies didn’t fare well this past week either, as the Swiss franc fell 0.7%, the pound sterling was down 0.6%, while the Japanese yen dropped 0.3%.
Was there a winner? Yes, the Cdn$ gained 0.8%. The Cdn$ seemed to gain as it was a secondary receiver of funds as a safe haven behind the U.S. dollar, given the escalating Russia/Ukraine war. As well, Canada’s inflation rose slightly but unemployment remains low and Canada’s PMI remains positive. Our concern with the US$ Index is that the its rise has been almost non-stop since that low in September at 99.86.
It has made new highs above the high of April 2024 at 106.38 and it has broken out of a resistance zone up to 107.00. False breakout? Can’t tell yet. But straight-up moves like this are usually not sustainable. However, it is difficult to tell when it could break. The RSI is overbought at 74.85. Break points come first at 106.00, and then again at 103.00. Below 103 the rally is over. We are entering a resistance zone that ranges from 107 to 110.
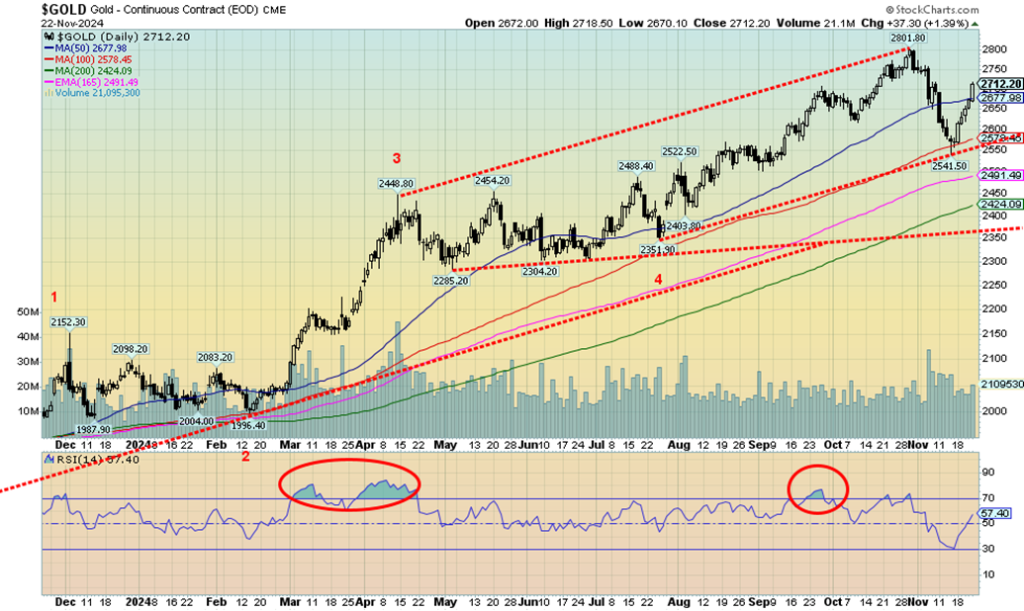
Gold had a good week on safe haven demand because of the uptick in the Russia/Ukraine war. Over the week, gold leaped 5.5% but silver lagged, gaining only 3.0%. As we note in our silver commentary, this is a concern. We want silver to lead, not lag. Elsewhere, platinum gained 3.2% but remains down 4.7% on the year. Of the near precious metals, palladium gained 8.1% on signs of supply shortages but is still down 10.6% in 2024. Copper was up 0.7% and 5.1% on the year. On the year, gold is up 30.9% while silver has gained 30.1%. A stellar year. The gold stocks loved it as the Gold Bugs Index (HUI) rose 8.1% and the TSX Gold Index (TGD) was up 7.8%.
As noted, the biggest catalyst for gold was the seeming expansion of the Russia/Ukraine war. Other concerns are that the Fed now won’t cut much in December, maybe 25 bp only. Gold shines during periods of geopolitical risk, economic risks, and low interest rates. Gold also rises on loss of confidence in government. Trump’s proposed cabinet picks are also generating concern, including any move to try and control the Fed which may be happening with whomever Trump picks as the new Fed chair.
The gain this week for gold came against the backdrop a sharply rising US$ Index that was up 0.8% to new 52-week highs, closing around 107.50. Usually when the US$ Index rises, gold falls. However, Fed officials voiced some reservations this week, suggesting inflation may have stalled. They may support further rate cuts but are cautious now on what inflation might do. As well, Trump’s proposed policies for tax cuts, tariffs, deportations, and firings would have an impact as these are inflationary. Deportations and firings could create labour shortages, driving up wages.
Then there is Bitcoin vs. gold, especially given Bitcoin’s spectacular gains. Bitcoin has been a clear winner against gold. Yet, unlike gold you can’t touch it, feel it, or hold it.
With gold now through $2,700, it’s important that level holds. We need to rise above $2,750 to suggest new highs ahead. There’s still a chance we could hit $3,000 by year end, but we wouldn’t want to guarantee that. New lows below $2,540 would suggest even further declines ahead, possibly down to $2,350.
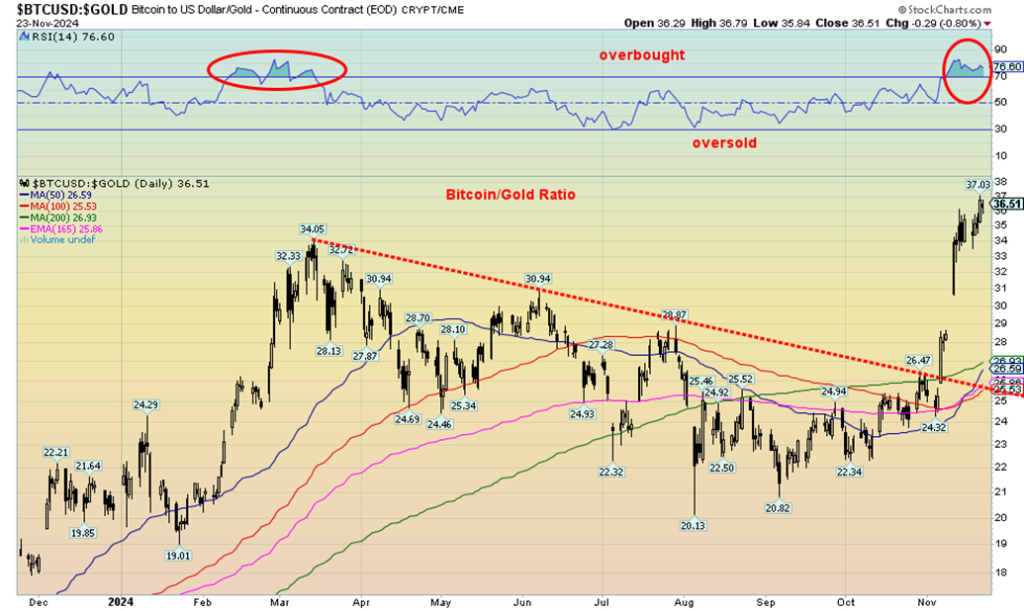
A remarkable run for the ratio, up 9,512% since the low in 2015 in favour of Bitcoin over gold. Up 96% in the past year in favour of Bitcoin. Crypto’s rise is giving a false sense of security. One is speculative. The other is real. Speculation (fantasy?) is winning out over reality.
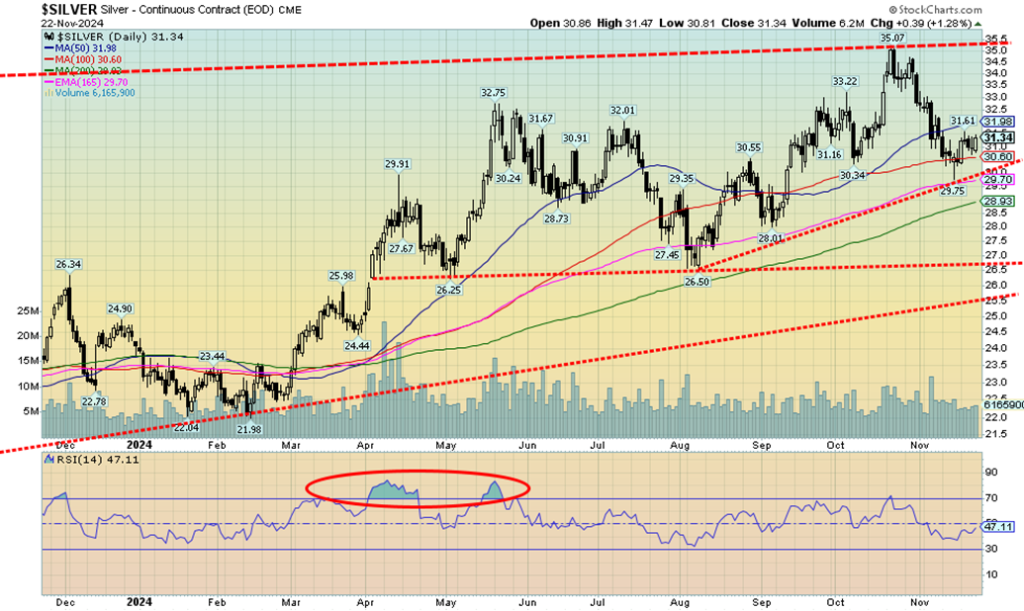
Gold accelerated this past week due to safe haven demand, but silver lagged, which is concerning. We prefer silver to lead. Silver gained only 3.0% on the week to gold’s 5.5%. The cheaper priced silver should have been an attraction as gold’s little companion. Silver did bounce off of support near $29.75 and we did close over $31 for the first time since early November, but its failure to at least match gold’s rise is a concern. That concern includes the entire rally, suggesting that all this action might be corrective only to the downdraft from the high of $35.07 to the recent low at $29.75 a drop of 15%+.
Corrections like this are not unusual, but the reality is we must regain back above $33.80 to suggest new highs ahead. We continue to maintain targets of $39/$40 but the struggle to get there is concerning. Arguably, we could say we are not making a new leg up but instead a topping pattern. Getting back above $33.25 would go a long way to lose the idea that this just a larger topping pattern. Volume has not been impressive on this upswing. All this keeps us cautious for the near term, even as we expect much higher levels for the longer term.
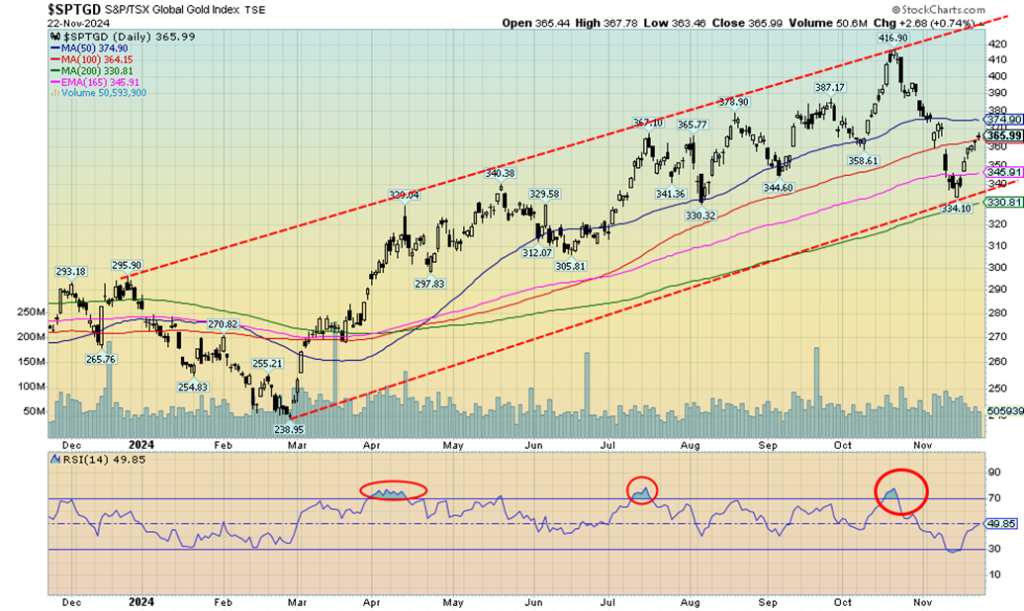
The gold stocks recovered nicely this past week with the TSX Gold Index (TGD) gaining 7.8% while the Gold Bugs Index (HUI) gained 8.1%. However, we remain far from the October high by just over 12% for the TGD. The RSI is entering neutral territory, just over 40. We did briefly dip under 30 RSI, a sign of being oversold. We note a couple of points above that need to be taken out to suggest higher prices. First, we must get over 375, then next 390. Above 400, new highs become probable.
As with gold itself, we can’t quite tell if this is just a corrective wave to the October/November drop (which was 20%) or the start of a new leg to the upside. Breaking above 400 would strongly suggest that a new up leg is underway. However, we can’t rule out that this up wave is just a corrective one. Volume has not as yet noticeably turned higher, suggesting this is just a corrective wave. From the February 2024 low we are up 53% so it has been a good run. We are also up 28.6% for the TGD and 26.7% for the HUI so far in 2024. It’s been a good year with a month to go.
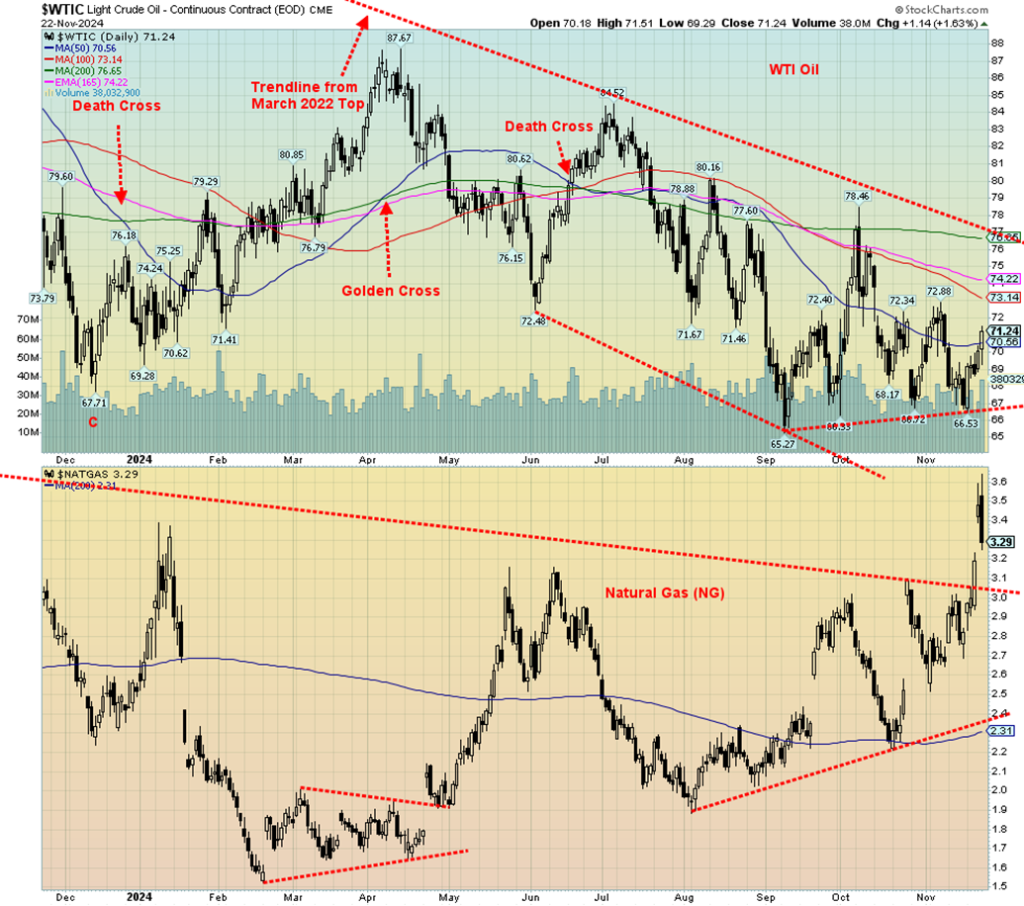
Once again, geopolitical tensions have pushed oil prices up. The upping of the Russia/Ukraine war has ensured this with the use of long-range missiles that need the help of U.S. and U.K. personnel being fired into Russia. Russia has responded with the use of a hypersonic missile, designed to carry nuclear warheads, fired at Ukraine. NATO has announced the deployment of up to 800,000 thousand troops in Germany. Also happening this week are the OPEC+ meetings. As we go into the meetings, speculation is sure to rise as to what they might or might not do.
Natural gas (NG) perked up because of forecasts for cold weather, particularly on the West coast but also broadly across the U.S. NG prices gapped higher but then came back down on Friday. There are also supply concerns in the EU, even as LNG flows are rising. On the week, WTI oil rose 6.5%, Brent crude was up 5.2%, NG gained 16.7%, while NG at the EU Dutch Hub was up 2.6%. The energy stocks responded and the ARCA Oil & Gas Index (XOI) rose 1.8%, but Canada’s TSX Energy Index (TEN) did better, up 4.0%. All in all, a good week for energy.
The gap up for NG must now hold if it is to go higher. While the gap might get filled (it mostly filled on Friday), the breakout line near $3 needs to hold if we are to go higher. A drop back under $2.90 might suggest it is failing. Under $2.70 it has failed and most likely we’d head lower. For NG, we are at the highest level since early 2023. But we’d need to get up through $4 if we are to suggest higher levels.
We tested what looks like a head and shoulders (H&S) topping pattern on WTI oil, but we didn’t break down—yet. We’ve bounced back nicely, but we need to break back above $73 to suggest the H&S pattern is defunct. Support goes down to $67, but under that level the H&S pattern could become reality with targets of $54. Seasonally, December is the start of a positive period for energy prices that extends into June of the next year. It’s not guaranteed, of course, but with both NG and oil showing signs of going higher, the seasonals might just be working.
__
(Featured image by Erol Ahmed via Unsplash)
DISCLAIMER: This article was written by a third party contributor and does not reflect the opinion of Born2Invest, its management, staff or its associates. Please review our disclaimer for more information.
This article may include forward-looking statements. These forward-looking statements generally are identified by the words “believe,” “project,” “estimate,” “become,” “plan,” “will,” and similar expressions, including with regards to potential earnings in the Empire Flippers affiliate program. These forward-looking statements involve known and unknown risks as well as uncertainties, including those discussed in the following cautionary statements and elsewhere in this article and on this site. Although the Company may believe that its expectations are based on reasonable assumptions, the actual results that the Company may achieve may differ materially from any forward-looking statements, which reflect the opinions of the management of the Company only as of the date hereof. Additionally, please make sure to read these important disclosures.
Copyright David Chapman 2024
David Chapman is not a registered advisory service and is not an exempt market dealer (EMD) nor a licensed financial advisor. He does not and cannot give individualised market advice. David Chapman has worked in the financial industry for over 40 years including large financial corporations, banks, and investment dealers. The information in this newsletter is intended only for informational and educational purposes. It should not be construed as an offer, a solicitation of an offer or sale of any security.
Every effort is made to provide accurate and complete information. However, we cannot guarantee that there will be no errors. We make no claims, promises or guarantees about the accuracy, completeness, or adequacy of the contents of this commentary and expressly disclaim liability for errors and omissions in the contents of this commentary. David Chapman will always use his best efforts to ensure the accuracy and timeliness of all information. The reader assumes all risk when trading in securities and David Chapman advises consulting a licensed professional financial advisor or portfolio manager such as Enriched Investing Incorporated before proceeding with any trade or idea presented in this newsletter.
David Chapman may own shares in companies mentioned in this newsletter. Before making an investment, prospective investors should review each security’s offering documents which summarize the objectives, fees, expenses and associated risks. David Chapman shares his ideas and opinions for informational and educational purposes only and expects the reader to perform due diligence before considering a position in any security. That includes consulting with your own licensed professional financial advisor such as Enriched Investing Incorporated. Performance is not guaranteed, values change frequently, and past performance may not be repeated.

-

 Crowdfunding2 weeks ago
Driebes Launches Crowdfunding to Preserve Roman City of Caraca
-

 Crowdfunding1 day ago
Newcleo Raises $85 Million to Advance Fourth-Generation Nuclear Reactors
-

 Fintech1 week ago
Swipay Brings Transparency and Fair Fees to Swiss Retail Payments
-

 Markets3 days ago
Gold’s Historic Surge and Sudden Crash Signal Volatility, Not Defeat


