Featured
How would the mid-term election affect stocks and gold markets?
Gold rose for the third consecutive week while oil prices fell. Markets are expected to remain volatile as the mid-term election is fast approaching.

Q: Mr. President, the Democrats say that it’s your economic policies that caused that downturn on Wall Street yesterday.
The President: “Yes, it’s funny, Bill [Bill Plante, CBS News], that I couldn’t understand, at the beginning, that creating 14 million new jobs, eliminating inflation – or virtually eliminating it, bringing it down-lowering interest rates, increasing the prosperity of the people – I just wouldn’t understand that that could hurt the stock market.”
Q: What word will you have for investors today, Mr. President?
The President: “Well, we’re in constant consultations. I think everyone has been caught by surprise in this. And it is true that at this point of the day the market is in a far better situation than it was yesterday at this time, with about the same number of sales of stock – trading of stock. But I’m very pleased and gratified with the action that has been taken so far by the Federal Reserve Board and the fact that two of the major banks have lowered their interest rates.”—President Ronald Reagan, October 20, 1987, the day after Black Monday, October 19, 1987
“It may be disappointing, but I think it is neither prudent nor appropriate for any president to comment on the hour-by-hour or the day-by-day movements of the market.”—President Bill Clinton, October 28, 1997
“What I’m looking at is not the day-to-day gyrations of the stock market, but the long-term ability for the United States and the entire world economy to regain its footing. And, you know, the stock market is sort of like a tracking poll in politics. It bobs up and down day to day, and if you spend all your time worrying about that, then you’re probably going to get the long-term strategy wrong. On the other hand, what you’re now seeing is profit and earning ratios are starting to get to the point where buying stocks is a potentially good deal if you’ve got a long-term perspective on it.”—President Barack Obama, March 3, 2009
“In the “old days,” when good news was reported, the Stock Market would go up. Today, when good news is reported, the Stock Market goes down. Big mistake, and we have so much good (great) news about the economy!”—President Donald Trump, February 7, 2018, in a tweet
Politicians, especially presidents (and prime ministers), should probably never talk about markets. Former Canadian Prime Minister Stephen Harper once said, “My own belief is if we were going to have some kind of crash or recession, we probably would have had it by now.”
He said that on September 15, 2008, as Lehman Brothers came crashing down. By November 20, 2008, the TSX Composite was down 36 percent. He even declared famously on October 7, 2008, that “I think there are probably some great buying opportunities emerging in the stock market as a consequence of all this panic.” The TSX fell another 21.5 percent into the November low and the final low did not come until March 6, 2009.
Tens of thousands of jobs were lost and governments were forced to rush in with bail-out plans for the banking system in the U.S., the EU, and even in Canada. Government deficits soared to record levels and while the world fell into a steep recession, another Great Depression was probably avoided. Still, the Canadian and U.S. economies shrunk by 2.8 percent in 2009.
While not to pick on former PM Stephen Harper, it is a prime example of why presidents and prime ministers should not talk about markets or become involved in the markets. The quote from Barack Obama above actually created a storm of criticism and he was dubbed “the Stockpicker in Chief” and the “First Stockbroker.” Prime Minister Harper faced similar criticism when he recommended buying stocks.
But here once again we have a president who can’t seem to stop talking about the Fed. Once again, President Trump has weighed in on the Fed, calling it the “biggest threat”—that “The Fed is raising rates too fast and it’s independent so I don’t speak to [him],” “I’m not happy with what he is doing,” and, “the Fed is raising rates too fast.”
While the Fed and the Bank of Canada (BofC) are instruments of the governments of Canada and the U.S., they are independent bodies because their monetary policy decisions do not have to be approved by the president, the prime minister, or the executive (cabinet) or legislative branches of government (congress, parliament), they are also not approved by Canada’s Department of Finance nor the U.S. Treasury Department. The heads of the BofC and the Fed are appointed by Canada’s cabinet and in the U.S. by the president. The head of the Fed serves four-year terms while the head of the BofC is there for a term of seven years.
We note all this as elections are coming up in the U.S., and what happens in mid-terms and what politicians, especially presidents (and prime ministers) say can influence markets. The U.S. mid-term elections are being held against the backdrop of a deeply divided country, a division as deep as what was seen before the U.S. Civil War 1861–1865. Polls show that some 31 percent of Americans believe a civil war is possible. Currently, Republicans control the house, the Senate, and governorships. But will they change? Mid-terms have considerable history.
Typically, the president’s party loses the house and even Senate seats. But not always. Over the past 25 mid-terms, the president’s party gained seats only three times—in 1934, 1938, and 2002. But there are interesting observations about the 22 losing years. And no, the performance of the stock market does not appear to be a major factor. What is important, according to Yale & Jeffery Hirsch, authors of the annual Stock Trader’s Almanac, is that no wars or recessions are present. In 2018 there are no wars or recessions. That being the case, and despite the deep divisions, the odds would appear to favor only small losses for the president’s party. Historically, the biggest losses for the president’s party occurred in years when there were major economic concerns.
Large losses of 18 percent or more seats for the president’s party occurred in 1930 (Great Depression), 1994 (botched health care), 1938 (Great Depression), 1946 (postwar recession), 1958 (1957 recession), 2010 (Great Recession), 1974 (Watergate and recession), and 1922 (recession and Tea Pot Dome scandal).
The other interesting observation is that, of the 25 mid-terms, the stock market was higher by year-end on 18 occasions. Of 26 mid-terms since 1914, there were only nine occasions where no market bottom was seen during the year of the mid-terms. The message seems to be unless we are engulfed by war and recession—especially the latter—then the president’s party is not likely to fare poorly at the mid-terms and the market should rally following the mid-terms into year-end.
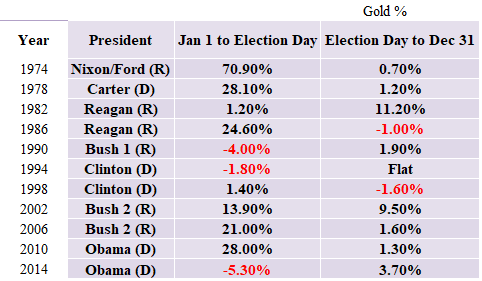
The Hirsch’s did not cover gold, but we decided to take a look at it dating from 1970 when gold became free trading. There have been 11 mid-terms past 1970. The record for gold has been as follows:
© David Chapman
One thing that does stand out is that, for the most part, gold does well in mid-term years. There were only three times out of 11 where gold was down before the mid-term election date. Given where gold is trading in 2018, it appears this year might make for a fourth down year before the election.
There were also only two times that gold was down after the mid-term election (and one flat). The largest gain was in 1974, the year of Watergate and a recession. The worst year was 1994, a year with no recession despite about a 10 percent drop in the markets earlier in the year. Strong gains for gold were seen in 1974, 1978, 1986, 2006, and 2010. Those were years that also saw large increases in government debt. The huge tax cuts enacted by the current administration are estimated to add $1.5 trillion to the debt over the next decade.
While gold is down so far in 2018, there is mounting concern about the growing U.S. debt where the biggest budget deficit since 2012 has been reported. Could debt once again play a key role in determining the price of gold? Around the world, debt has hit astronomical levels, estimated now at up to $245 trillion. There are debt problems being reported in China’s corporate sector, where some $5.8 trillion of loans are in doubt. We are seeing major problems with the Italian banking system so that if a default occurred it could negatively impact EU banks. And elsewhere, sovereign debt problems exist in Argentina, Venezuela, Turkey, Ukraine, with problems cropping up even in India and Brazil.
There are dire warnings about the state of debt emanating from the IMF. At recent meetings in Bali, Indonesia the IMF warned that 10 years out from the financial disaster of 2008, the world has created the conditions for another economic and financial disaster. This is from the IMF, not doom-and-gloom purveyors like Nouriel Roubini and Marc Faber. They cited the huge growth in social and financial inequality, and even cited the impact of natural disasters on how both can leave the world vulnerable to disasters of all kinds.
Since the beginning of the year, the stock markets have become more volatile. The IMF has had to come to the rescue with bailouts in 2018 to Argentina (a record $57 billion), but they have also held discussions with Pakistan, India, Turkey, Indonesia, and South Africa. The meeting centered on the debt stress that emerging economies are facing, given that their loans are largely denominated in U.S. dollars while their revenue comes from devaluing local currencies. The fear is that investors suddenly start to pull out capital from these countries. The result could be a currency crisis along the lines of what was seen in 1997 and 1998. Those crises were largely contained. However, because the Western central banks (Fed, ECB, BOJ) are in no position to come to the rescue now—as burdened as they are from the bailouts from the 2008 crisis—the potential is for a more devastating collapse without the safety nets.
The other major issue at the IMF meetings was the trade war between China and the U.S. The IMF has warned that this economic war has potentially negative repercussions for the entire world. They have expressed concern that the U.S.’s attack on the WTO could leave global trade rules in a shambles. Washington has stated that one of their goals is to break up global supply chains so that manufacturing could be brought back to the U.S. to enhance its military capacity for war. This was outlined in a document released by the Pentagon on October 5, 2018, “Assessing and Strengthening the Manufacturing and Defense Industrial Base and Supply Chain Resiliency of the United States.”
While the Pentagon paper was not noted by the IMF, it is worth mentioning as rebuilding the U.S.’s manufacturing capacity is one of President Trump’s goals. On October 3, 2018, the U.S. threatened Russia with a direct attack over the violation of the Intermediate Range Nuclear Forces Treaty (INF). The U.S. has also said that Russia is threatening NATO by building up troop forces in Kaliningrad—which is Russia’s access to the Baltic Sea but flanked by NATO countries Poland and Lithuania where NATO troops are stationed. The statement came only three days after a Chinese and a U.S. warship almost collided in the South China Sea, with each accusing the other of deliberately setting a course for the other. Subsequently, President Trump has announced the cancellation of a long-standing nuclear treaty with Russia.
So, this is the current landscape—trade tensions, war tensions, economic tensions, and in the U.S. a deeply divided country heading into to potentially the most important mid-term elections ever. We have noted the potential impact on markets from previous mid-terms. Given the upcoming mid-terms, we thought it appropriate to look once again at the presidential cycle and how things fared under previous presidents. We went back to the election of Harry Truman in 1948 and who served from 1949 to 1952 and looked at debt growth, GDP growth, the stock market (Dow Jones Industrials (DJI)), gold, the U.S. dollar, and the range of Fed funds. Were there any trends or conclusions that one could discern? (See the table Presidential Cycle below.)
Since 1948, there have been 18 elections. Eight Democratic presidents have served while there have been ten Republican presidents. Six presidents served two terms—Eisenhower, Nixon, Reagan, Clinton, Bush 2, and Obama. The U.S. national debt grew under every president. On average, the debt expanded 22.9 percent per year under Democratic presidents and 35.4 percent under Republican presidents. Debt increased the highest by percentage under Reagan, although in dollars the biggest growth was under Obama who faced the fallout from the 2008 financial crisis. Carter, a Democrat, had the highest percentage increase in GDP while Obama posted the lowest percentage increase in GDP during his first term in 2009–2012. In terms of percentage GDP growth, there was little to choose from, between either Democratic or Republican presidents.
Democrat Bill Clinton was president for the biggest percentage gain in the DJI while Republican George W. Bush was president during the lowest DJI increase, a loss of 18.6 percent during his term in 2005–2008. Overall, Democratic presidents saw the DJI increase some 45.1 percent vs. a gain of 26.9 percent under Republican presidents. Gold performed the best under Democrat Jimmy Carter but he was fortunate to be president during gold’s spectacular blow-off in 1977–1980 when it gained 337 percent. Overall, gold performed best under Democratic presidents, gaining 50.8 percent on average vs. a gain of 31.5 percent on average under Republican presidents. But the Democratic gain was skewed by the huge blow-off of gold in the late 1970s. The U.S. dollar fared the worst under Republican presidents, losing on average 3.4 percent vs. a gain of 4.6 percent on average with Democratic presidents. A falling U.S. dollar would be friendlier for gold.
A general conclusion from the study suggests that debt increases the most under Republicans. GDP is about even, the stock market performs best under Democratic presidents, and, after adjusting for the huge blow-off in gold in the late 1970s, gold actually performs best under Republican presidents. It was under Republican presidents that the U.S. dollar took its biggest hits.
Election season is fast approaching and markets have been volatile. Expect the volatility to continue. If Republicans don’t fare as poorly as some expect the market should rise. But if they hold on to Congress, then the market could rise sharply. Irrespective of this, time is ticking on this market—even if we agree we could hang on into 2019—and the warnings of the IMF should be heeded.
The table is on the next page.
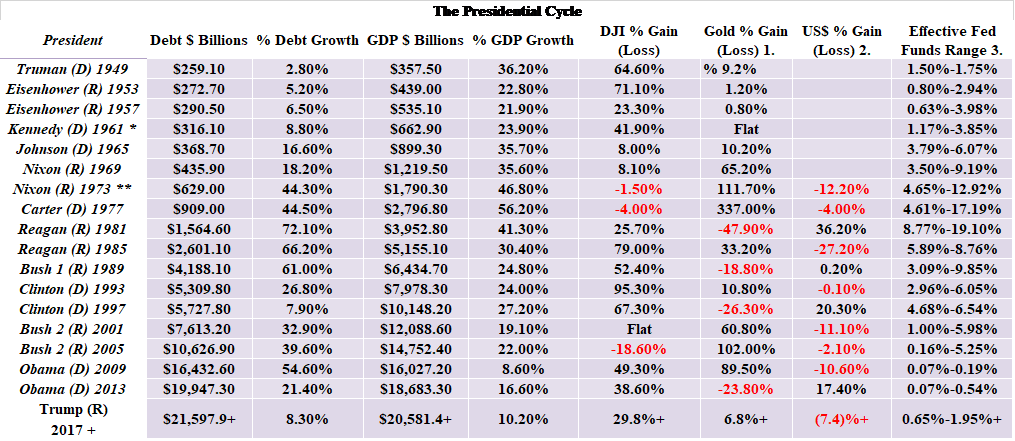
* Died in Office Replaced by Johnson ** Resigned Replaced by Ford + To date. © David ChapmanNote 1: Gold prices were pegged at $35/ounce under Bretton Woods until August 1971. Before August 1971, gold prices were under pressure due to the high volume of US$ floating around the world. There were more US$ then there was gold and there was pressure for gold prices to rise. Gold prices were suppressed for a period under the London Gold Pool that existed from 1961 to 1968. A two-tier system existed from 1968 to 1971 until it too collapsed.
Note 2: The US$ was fixed to gold under Bretton Woods. Other currencies were fixed to the US$. Under the Smithsonian Agreement of December 1971, it effectively ended the fixed exchange system. By February 1973, the world switched to a floating rate currency exchange system and Bretton Woods was dead.
Note 3: Before 1954, there was no effective Fed Funds rate as they used the Discount Rate.
Bitcoin watch
© David Chapman
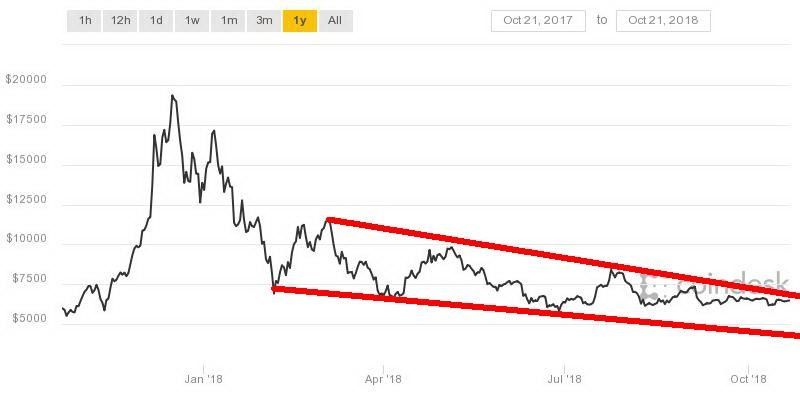
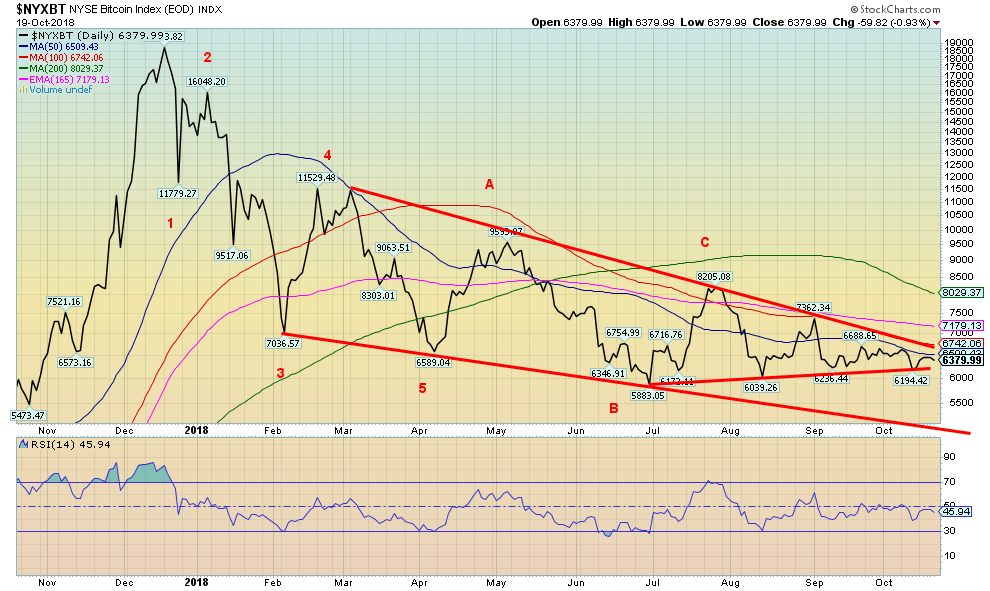
Yawn. We guess that is probably the best we can say these days about the cryptocurrency market. Trading continues roughly between $6,200 to $6,800. That was largely the range over the past week. Indeed, it shot from $6,200 to $6,800, and then promptly pulled back to the $6,400 range where it has spent the rest of the week. No wonder there are yawns. But it keeps the bulls alive that Bitcoin and the cryptos are about to take off into the stratosphere. However, the sinking series of lower highs suggests to us the break is liable to be to the downside rather than the upside.
We suppose the most interesting story we saw this week on cryptos was one on how a North Korea hacking group called Lazarus stole $571 million in cryptos. It wasn’t just one hack—it was a series of attacks, carried out mostly on South Korean exchanges. As part of the story, it was indicated that another group called Group-IB hacked away over $800 million in cryptos. Elsewhere, the famous Mt. Gox exchange is still trying to revive itself or, at least, clients are still trying to get money out there, money that has been effectively trapped. Another story told how crypto traders gamed Coinbase for a large payday.
Hacks, thefts, frauds, money laundering—they are all a part of the crypto world. This begs the question: why does anyone want to be involved in it? No wonder the regulators are still trying to get a handle on the universe.
The market cap of all of the cryptos listed at Coin Market Cap stands this week at $207.7 billion. That’s up slightly from last week’s $201.6 billion. The number of cryptos listed stands at 2,105 and, amazingly, that is up from the 2,071 listed the previous week. Again, the question begs, why? Surprisingly, the number of dead coins listed at Dead Coins holds steady at 929. We suspect there are at least 2,100 coins listed that probably deserve to be at Dead Coins. The number of cryptos with a market cap of $1 billion or more rose by one to 16 from the previous week. 423 cryptos have a market cap of under $10,000, of which 395 of them show no discernible assets.
The coiling continues. The good news on that is we should soon see some resolution with a breakout one way or the other. We wouldn’t be surprised at an upside breakout to suck in a lot of people. The only thing that would surprise us on an upside breakout is that it goes higher than expected.
© David Chapman
Markets and trends
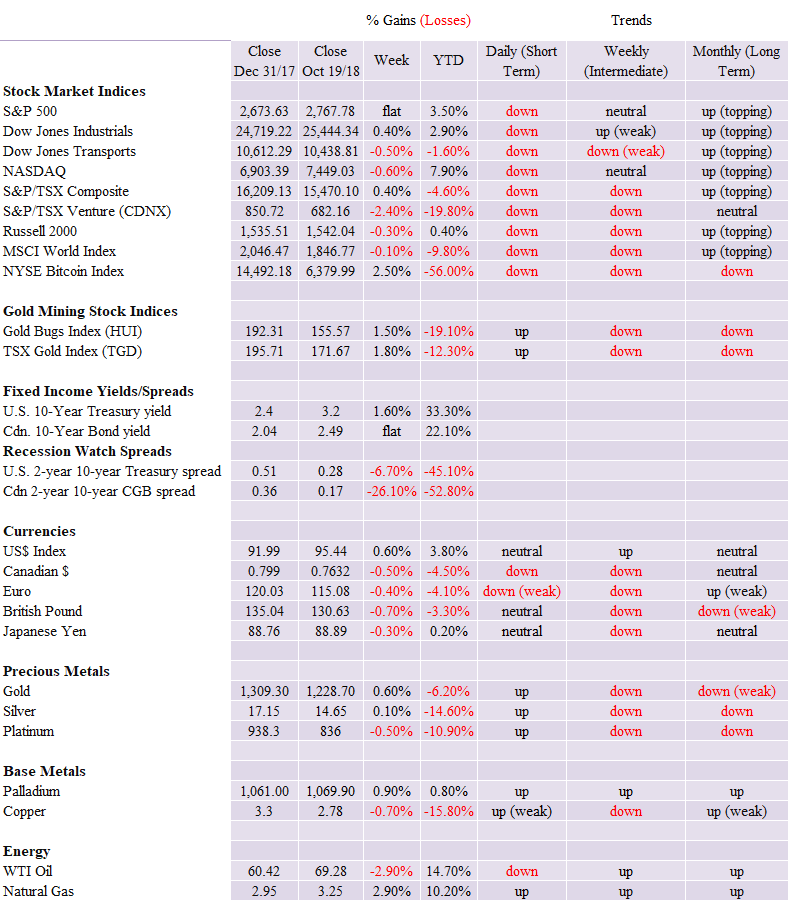
New highs/lows refer to new 52-week highs/lows. © David Chapman
© David Chapman
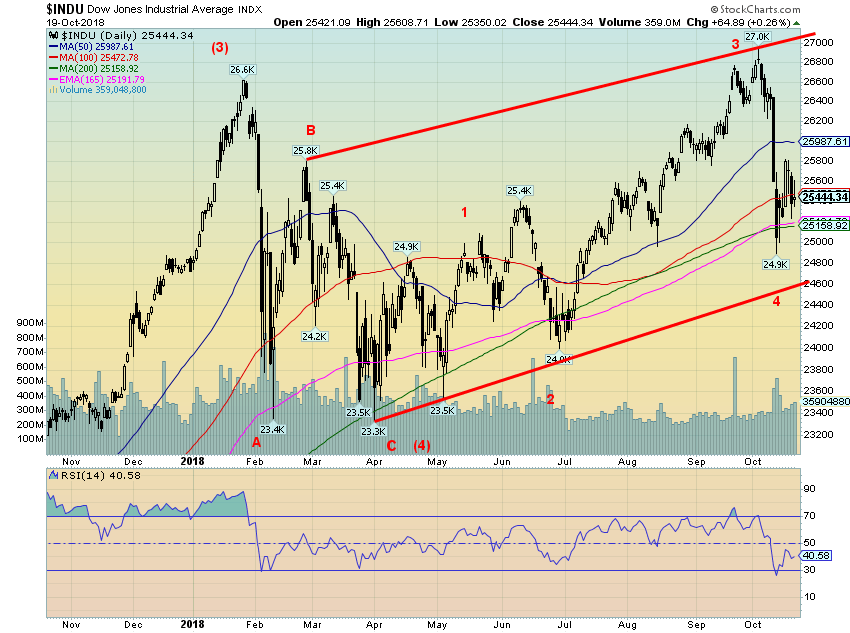
The Dow Jones Industrials (DJI) fell hard with a spike in volatility, but, we note, not any great spike in volume as we saw in the January to March trade war mini-panic. Yes, volume jumped, but it is below the levels seen January/March. We believe this is was a fourth wave decline from the bottom seen in early April (C wave). If that is the case, then the DJI should enjoy another run to the upside and possible new highs once again. The run-up would take us into year-end and even into 2019. Note that so far, the 200-day MA is holding. We are also above the up-trend line from the early April low. All of this fits our thoughts from our essay on the mid-terms. As well markets tend to do well after Thanksgiving, giving rise to the traditional Santa Claus rally. While new lows remain possible, we’d be more concerned if the DJI broke down under the uptrend line currently near 24,600. Regaining above 26,000 would be positive. There were a lot of instant bears out there on this drop that the end of the world is coming. More likely, this is another hook to destroy the bears before the real bear gets underway.
© David Chapman
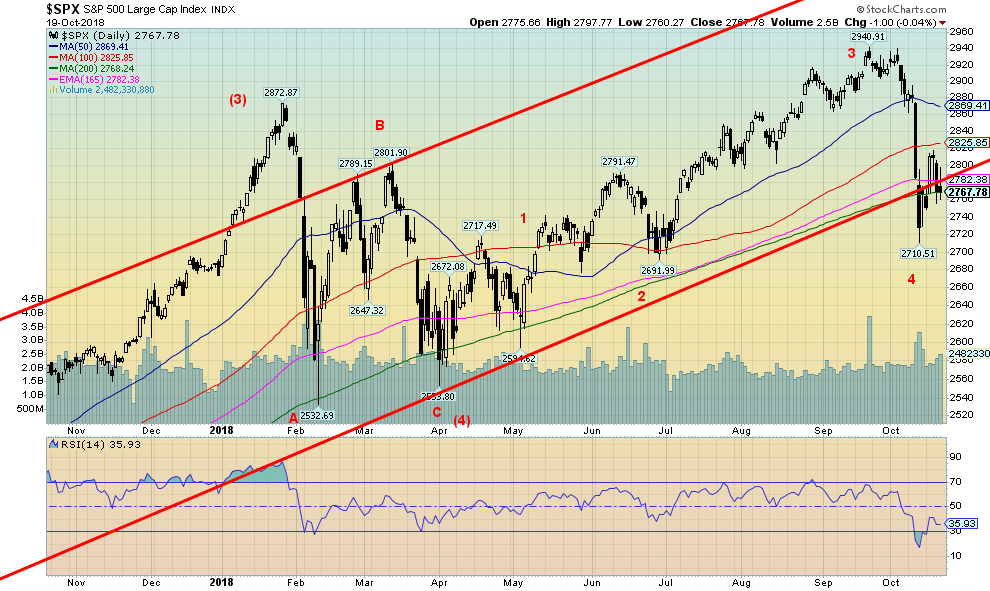
Here is the S&P 500 and it does appear to have broken down under the uptrend line from the February 2016 low. However, it is also holding the 200-day MA and that, at least for the moment, is positive. As with the DJI we believe this was a wave 4 down with a 5th wave up to come. We could be wrong, of course, so the caveat points are a breakdown under 2,700 (the lows seen in June) and under 2,600 (the lows seen in May). There was an uptick in volatility and volume but the volume levels were nowhere near what was seen in January during the trade war mini-panic drop. The S&P 500 needs to regain above 2,800 and especially above 2,900 to suggest to us that higher prices are probable.
© David Chapman
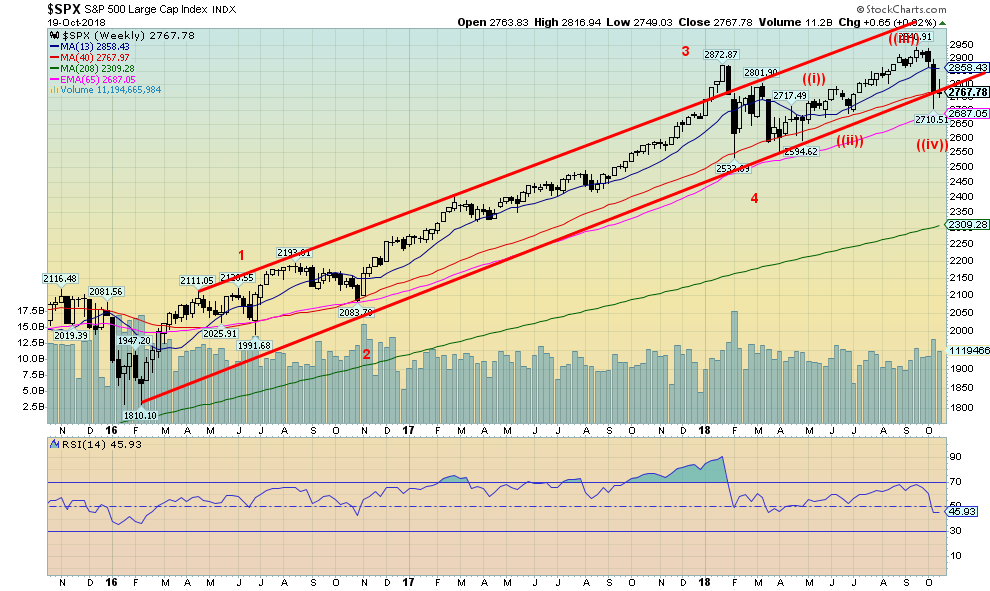
The daily chart of the S&P 500 shows that the index penetrated its uptrend line from the 2016 low. The weekly chart lessens that break, showing that the S&P 500 is testing the line but has not as yet firmly broken under it. As well, the index appears to be testing its 40-week MA. This fits with our thoughts that we could still see another rise in the markets into year-end or even into 2019. The caveat is that if the S&P 500 were to break that March low just under 2,600, then all bets are off and a bear market is probably underway. As we noted earlier, the next wave up could be the final one as we work on the 5th of a 5th.
© David Chapman
Hats off to Tom McClellan of McClellan Financial Publications. He does come up with some interesting things. Naturally, past performance is no guarantee of future performance; however, what this chart tells us is the market appears to be following much the same path it did from 2011 to 2014. In technical analysis, patterns repeat themselves. And patterns of bull and bear markets can sometimes line up nicely as well. In the chart above, sometimes the depth of a plunge isn’t as deep but the bump is there and lines up well. If the chart is correct, then the market should rally out of the current hole and possibly see new highs by year end. That also fits with our own thoughts that the November U.S. election could see the markets take off to the upside and rally into year end and possibly into 2019 as well. Of course, that is barring the unexpected. But the fact that we are reading so many bearish stories out there suggests to us there is yet another hook to make the bears look silly. The bear market will come. Just not yet.
© David Chapman
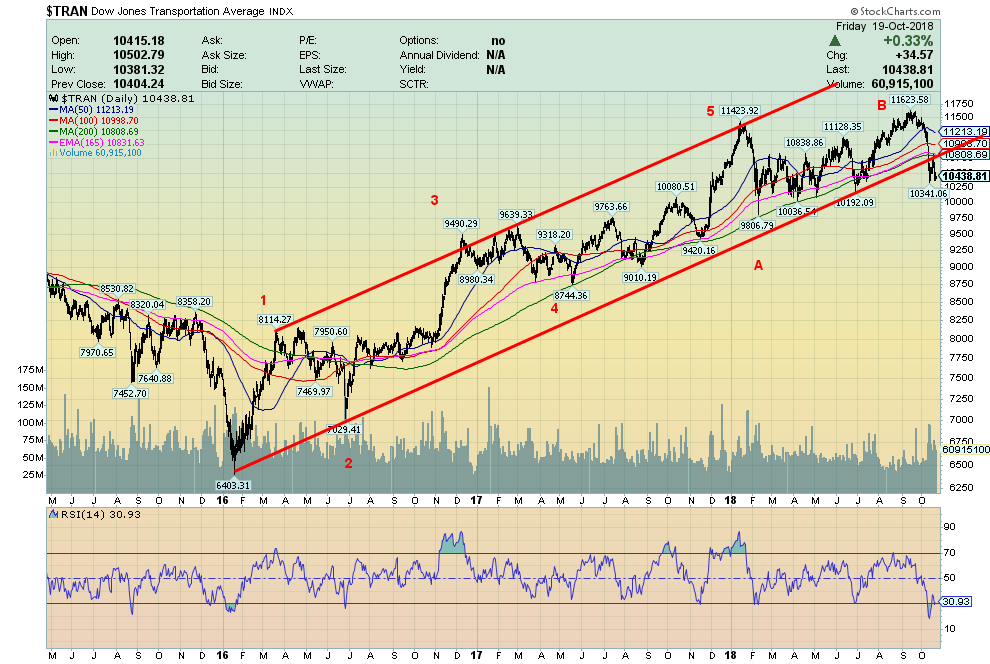
The Dow Jones Transportations (DJT) have fallen below the 200-day MA and also below the uptrend line from the 2016 low. The wave count from the 2016 appears to have completed as a five-wave up topping in January 2016. The DJT is quite oversold right now so a rebound is probable. However, we doubt we will see new highs on any rebound. Breaking under 10,000 and particularly under 9,800 could be a death knell for the DJT as it would take out those series of lows that were seen in February through June of this year. Despite the Dow Jones Industrials (DJI) being up this past week, the DJT failed to follow, losing 0.5 percent. The index is now down on the year. The DJT is also down, just over 10 percent from its all-time highs set in September 2018.
© David Chapman
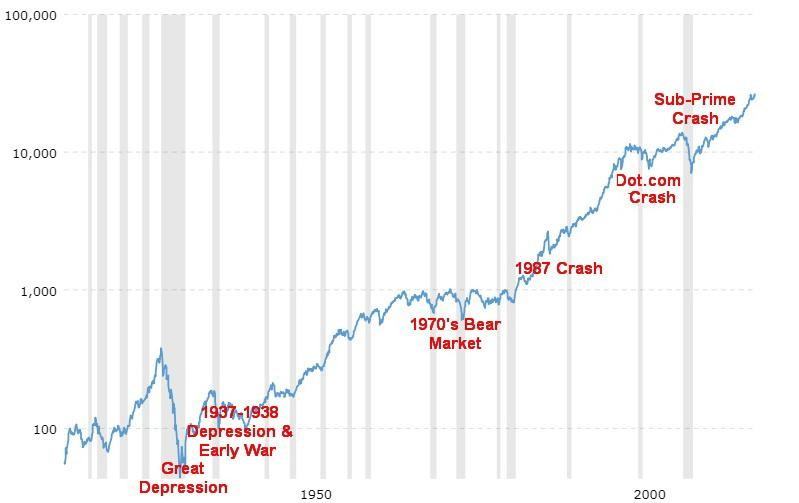
Thanks, Mike, for the suggestion. A reminder that Friday, October 19 was the 31st anniversary of the October 19, 1987 stock market crash. I remember being a little shaky that day. No, not because the stock market collapsed but that I couldn’t get into the London futures market to cover a short position in Eurodollars even though I was at my dealing desk at roughly 4 in the morning. While October 19 saw the stock market crash there was a reverse crash in interest rates the next day as the Fed flooded the market with liquidity to stem a bigger collapse, thus causing short rates to collapse almost 200 basis points overnight. Despite that hiccup, our Eurodollar portfolio did very well but the futures position stunk, offsetting gains elsewhere. Such was life on the trading desks of the banks and dealers in October 1987. But looking at that infamous day on a long-term chart, it is merely a blip. The lesson and the lesson ever since is that one can always count on the Fed in times of trouble. But what about the next time? And it is not a question of will there be a next time, but it is when. On October 19, 1987, they thought the world was coming to an end and the next Great Depression was just around the corner. Never happened.
© David Chapman
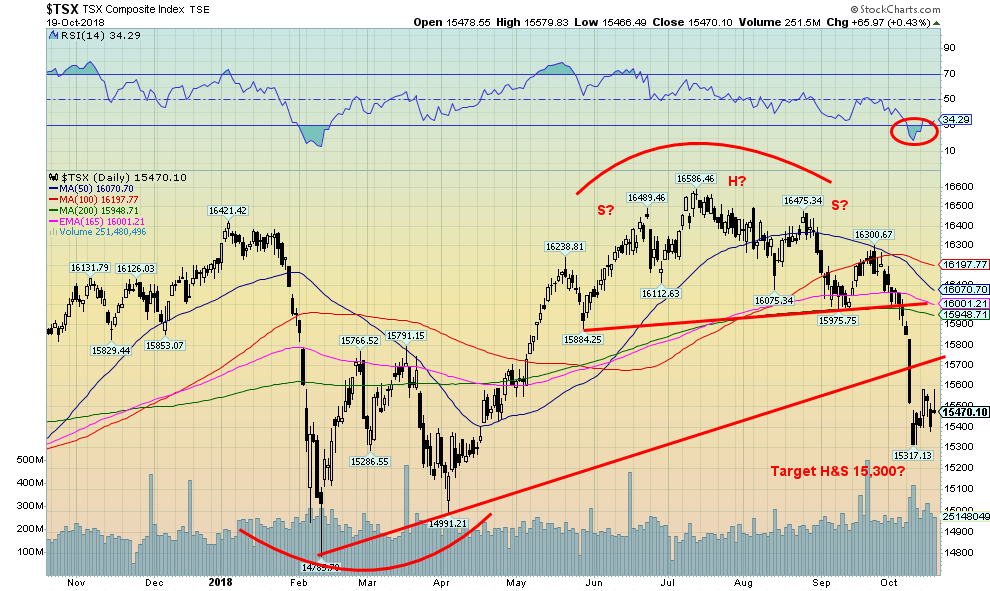
Nothing has changed for the TSX Composite since last week. The index tried to rally but pulled back. The TSX Composite gained 0.4 percent this past week. There is clear resistance up to around 15,700 and further resistance up to the 200-day MA near 15,950. Our sense here is that the TSX has probably seen its high. The possible head and shoulders largely met its objectives at the 15,317 low. A breakdown under 15,300 would, however, lead to the next objective near 14,860. That roughly coincides with the February/April lows. The RSI for the TSX fell under 30, which often indicates a potential low. Some consolidation or even a short-term rally to shed the index of its oversold nature is in order. But we doubt we will see new highs again. The caveat is a return back over 16,000 and especially over 16,200.
© David Chapman
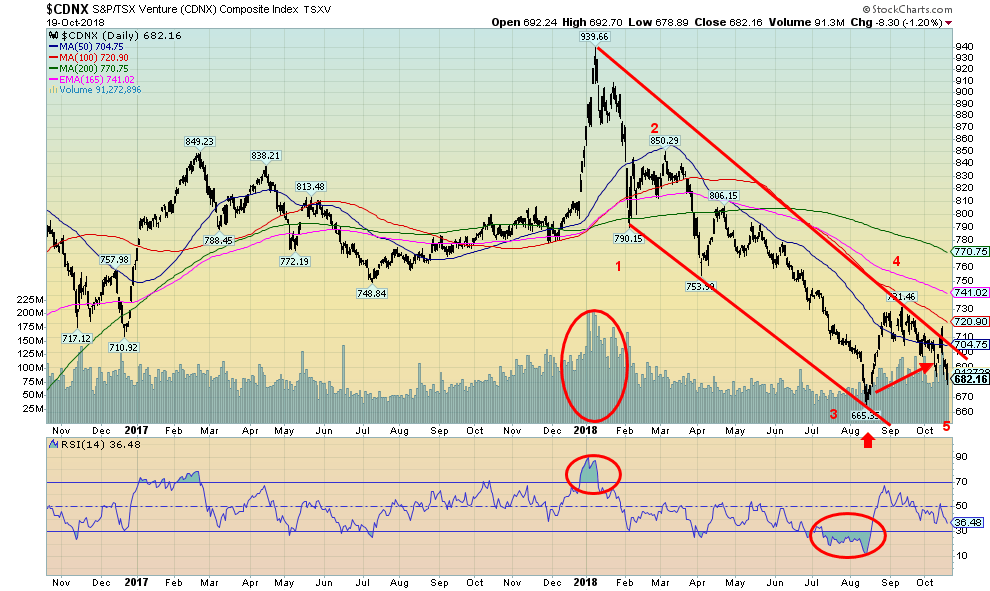
We haven’t shown the TSX Venture Exchange (CDNX) for a few weeks and thought it appropriate to show it once again. The index is falling and could be in the process of completing a fifth wave to the downside from the top seen in January 2018. The index is down 27 percent from that high, but many individual stocks are down 50 percent or more. This is the wave that could see a double bottom made or even a small new low. We don’t get the sense that we are poised for another major breakdown. The CDNX is made up of at least 50 percent junior mining stocks, mostly of the exploration variety. The extremes for the CDNX appear to have been made in August and this drop could just be a test of those lows. We won’t rule out new lows, but the worst for this index is very likely over.
© David Chapman
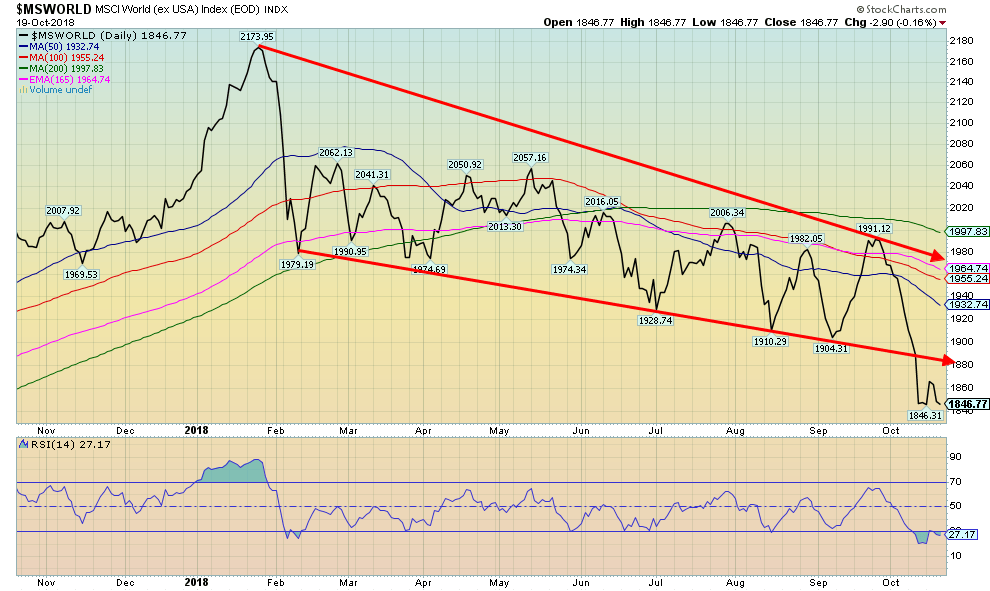
The growing trouble in emerging markets is best exemplified by the sinking MSCI World Index. The MSCI World Index covers a number of countries, excluding the U.S. With 1,640 constituents it covers roughly 85 percent of the free float-adjusted capitalization in each country. The index has been falling since early in the new year and there is no sign of a bottom. It recently broke down out of a bear channel, thus steepening the drop. Targets could be down under 1,700.
© David Chapman
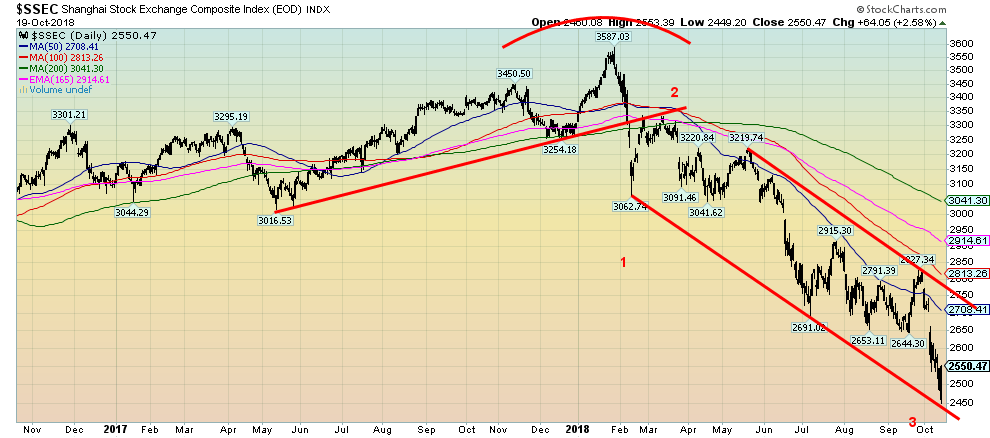
Down, down, down she goes. China’s Shanghai index (SSEC) continued its losing ways this past week, making new 52-week lows. Over the past year, some $3 trillion has been wiped off of the SSEC. The SSEC is down roughly 50 percent from the highs of 2015 and down 29 percent since the highs earlier this year. The Chinese stock market has fallen to number 3 in size behind Japan. China’s growth is slowing and the corporate sector is burdened with debt. Some believe the Chinese are letting the air out of the markets now so they can be in better shape further down the road. But China’s main problem is debt and they need to let the air out of that and may even have to put up with some collapses in the corporate sector, particularly the real estate sector. China, unlike the U.S., has considerable room to borrow as their debt to GDP is only around 47 percent as opposed to the U.S.’s 106 percent. China is also facing a worsening trade dispute with the U.S., as well the U.S. and China confronting each other militarily in South China and East China Seas. The front cover of The Economist this coming week highlights China vs. America, a dangerous rivalry. Indeed, it is. The IMF has also warned about the dangerous conflict between the U.S. and China.
© David Chapman
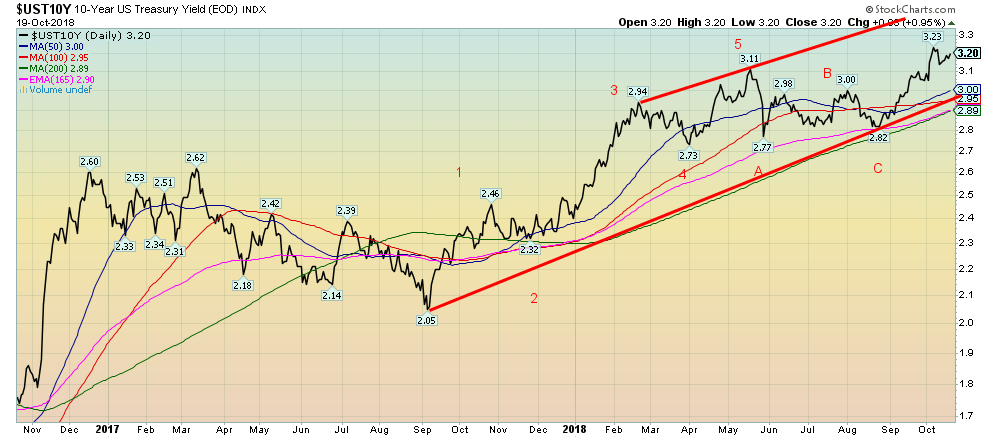
The 10-year U.S. Treasury note continued its upward march this past week, closing at 3.20 percent. It is just short of the previous high of 3.23 percent. Our target for the 10-year remains up to 3.45 percent. The only caveat to that scenario is that the U.S. economy begins to show signs of trouble. And while things may waver, there remain no strong signs that the U.S. economy is slowing. The problems all remain elsewhere where China’s growth is slowing and they are burdened with massive debts in the corporate sector primarily in US$. Italy remains a major problem and Moody’s dropped their credit rating to one notch above junk this past week. We have noted in the past the presence of a potential 6-year cycle in bonds. The last major low in prices (high in yields as yields move inversely to prices) was seen in 2013. However, when that high was taken out in late 2017-early 2018 the odds favored that the bond market would make a higher high (yield) as the six-year cycle came to the forefront. It is due by 2019. That is one reason we are sticking (for now) to our forecast that the 10-year could hit as high as 3.45 percent. A drop back below 3 percent could change that scenario.
Recession watch spread
© David Chapman
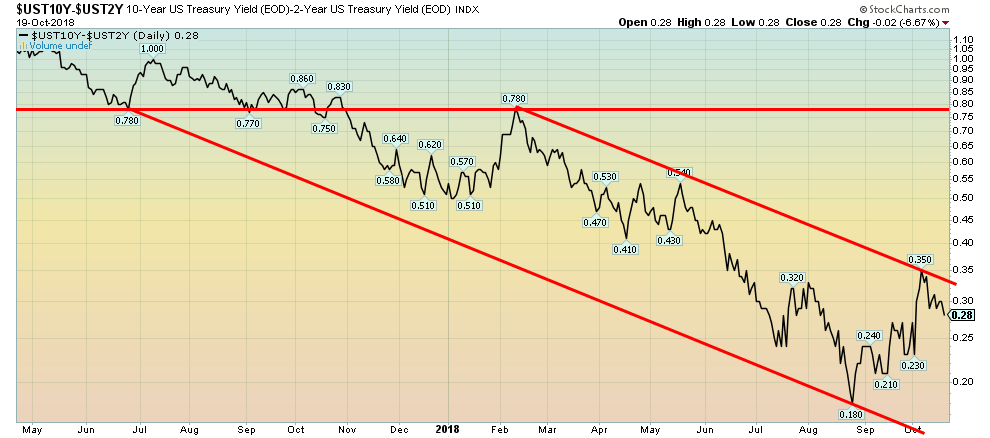
Our recession watch spread fell to 0.28 percent this past week from 0.30 percent the previous week. That came despite an uptick in the 10-year U.S. Treasury note. Once again, the 2–10 spread is nowhere near negative, thus hinting at a potential recession. But the trend remains down. We suspect that in this next move down we test the bottom of the channel again which could take us down to around 0.15 percent. The Fed is committed to hiking rates again at the December FOMC.
© David Chapman
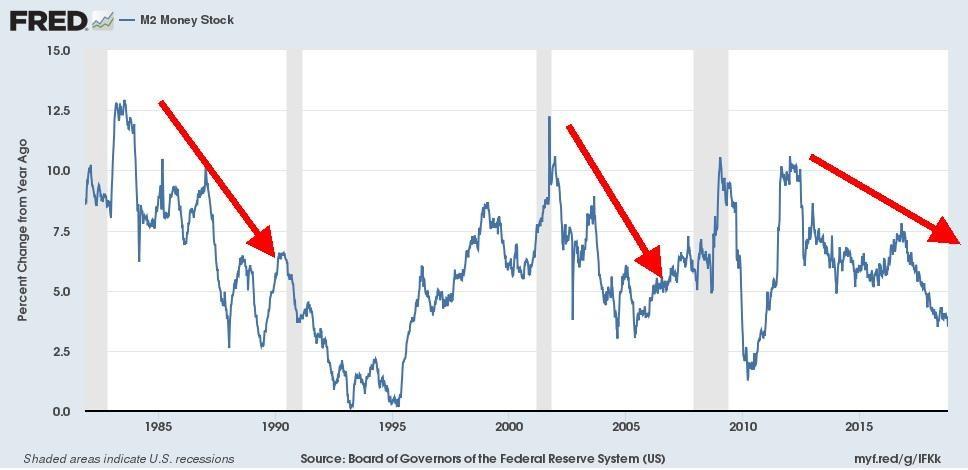
A reminder that monetary growth is slowing. M2’s growth has been in decline since 2011. We note that previous declines in the annual growth of M2 led eventually to the early 1990s recession, and the 2007–2009 recession. We note that monetary growth was slowing in the late 1990s, but it doesn’t appear to have been a major factor in the 2000–2002 high-tech/dot.com crash and recession. Slowing monetary growth is not quite the same as the Fed taking liquidity out of the system. It does mean that liquidity is not flowing into the system as well as it did after the 2008 crash.
© David Chapman
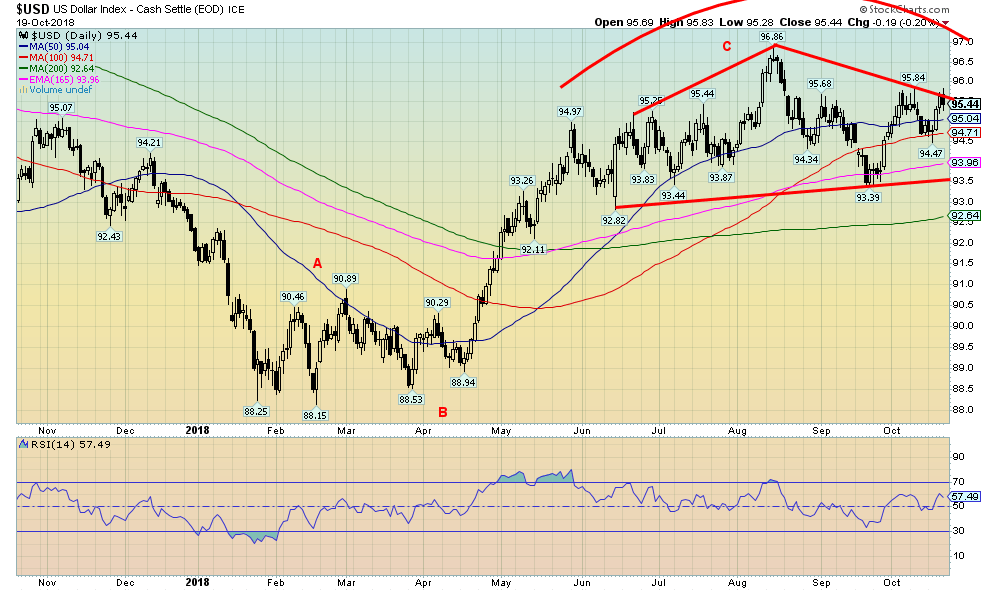
The US$ Index put in a mixed week, gaining almost 0.6 percent. The losers were everyone else as the euro fell 0.4 percent, the Japanese yen was down almost 0.3 percent, while the British pound was off 0.7 percent. The Cdn$ fell 0.5 percent. The US$ Index appears to staying under the downtrend line from the high of 96.86. It is, however, challenging the line and a break above 95.85 could set a test of the high underway. Under 95 a move towards 97 loses likelihood and under 94.50 the US$ Index should start a move to the downside once again. The US$ continues to buoyed by the Fed hiking interest rates (despite the carping of Trump on the sidelines—which the Fed will ignore) and continued strength in the U.S. economy even if there are some signs of wavering. No one is talking recession. At least, not officially. It’s odd then that both the IMF and The Economist have expressed concern about the global economy. The US$ continues to make what we believe is a topping pattern. The breakdown comes at 93.50 and once through that level a decline to 89.50 is probable. As noted, the caveat is a move above 95.85 that could begin to bust the bearish scenario.
© David Chapman
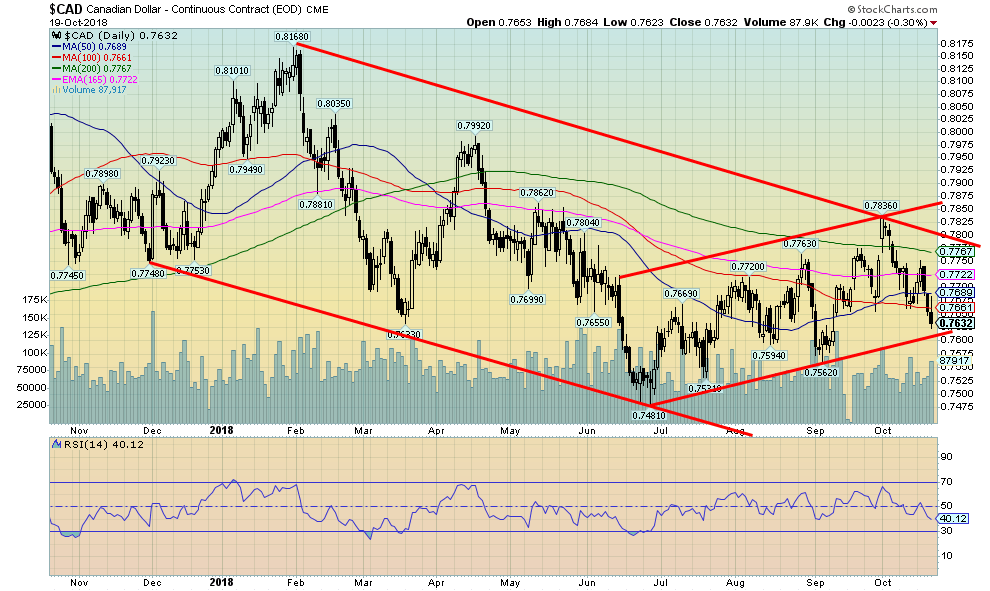
The Cdn$ fell this past week, losing 0.5 percent. It is, however, approaching rising trendline support. We suspect it should hold. We suspect a jagged uptrend for the Cdn$ is underway, but it met initial resistance at the 200-day MA currently near 77.70. We believe the 74.81 low seen in June is an important one. As long as the Cdn$ can hold above 76 it should regroup and start another irregular rise once again. In all likelihood the BofC will hike rates once again and that will help stabilize the Cdn$. Higher oil prices would help even more. If the Cdn$ were to break under 76 then it is likely to retest the 74.81 low and even see new lows.
© David Chapman
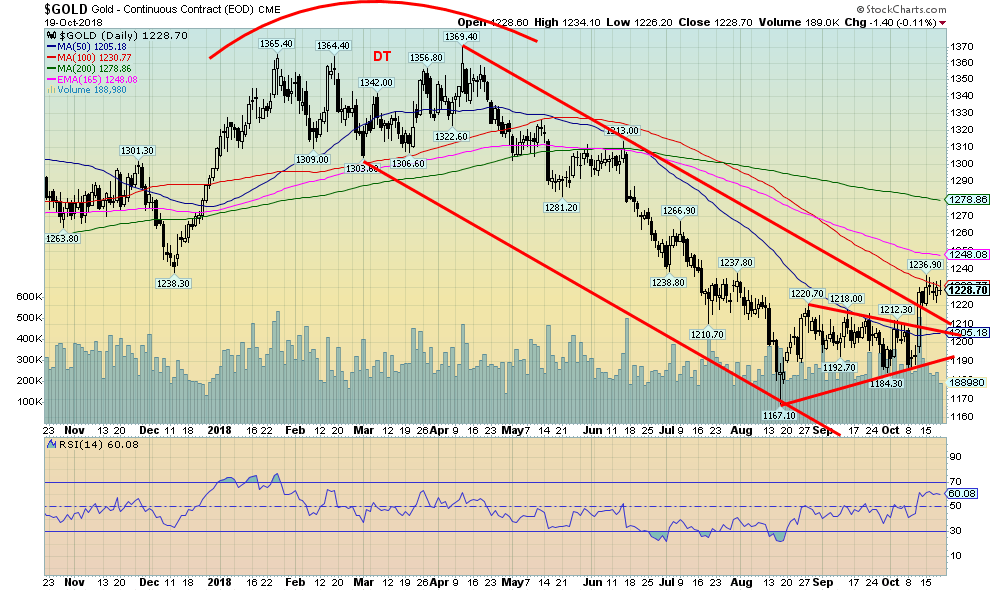
Gold appears to be consolidating above $1,220 following the huge $35 up day seen on October 11. The resistance is now at our next level ranging from $1,230 to $1,250. Once above $1,250 the next level or resistance is up at $1,280 to $1,300. Once over $1,300 gold should start a move to retest the major resistance zone up to $1,370. Major support is now seen down to $1,190. Below $1,180 a test of $1,167 and probable new lows would most likely take place. We believe gold made an important low in August. However, we cannot rule out another retest of the lows following a test to the upside to at least $1,250 and possible to $1,280. Overall sentiment remains low and that is still a bullish factor going forward.
© David Chapman
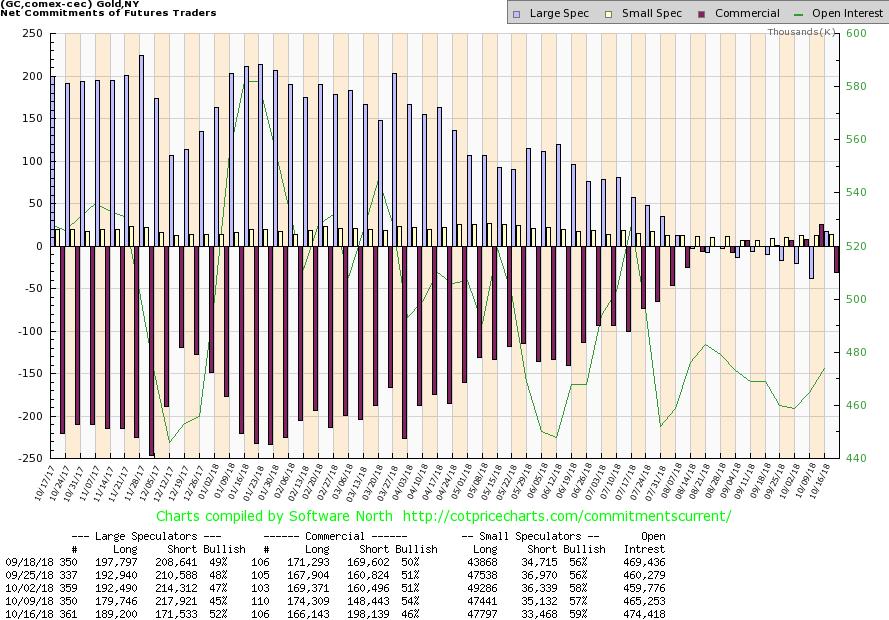
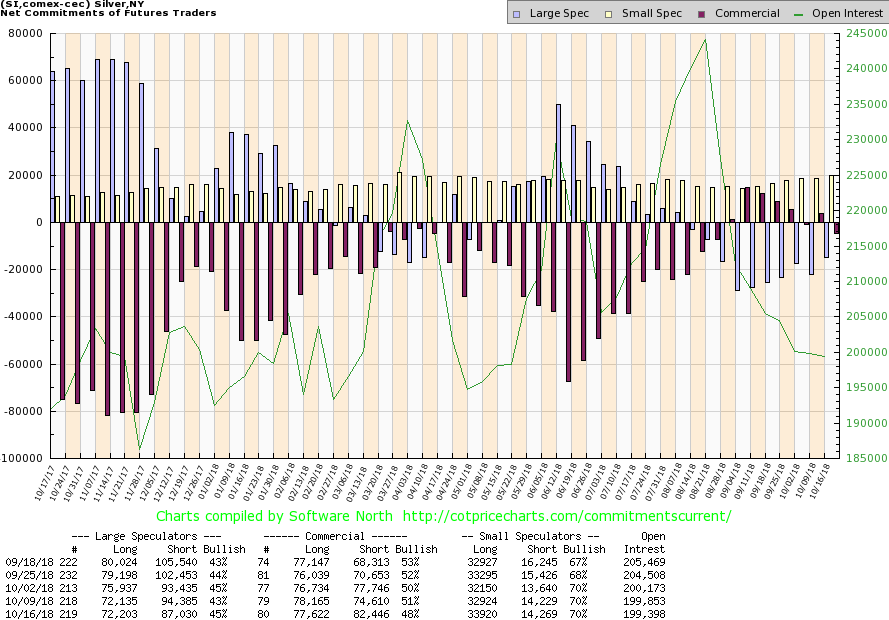
The commercial COT for gold pulled back this past week falling to 46 percent from 54 percent. It’s the first time back under 50 percent in several weeks. We assume the large speculators were forced to cover on that big up day on October 11. The move from low to high was some $35. Long open interest for the commercials fell some 8,000 contracts this past week while short open interest jumped almost 50,000 contracts. The large speculators saw their COT rise to 52 percent from 45 percent as they added just under 10,000 contracts to long open interest and dropped their short open interest by almost 47,000 contracts. Quite a shift. But in many respects, it may just represent a return to what has been normal over the past 20 plus years. The report is still quite bullish.
© David Chapman
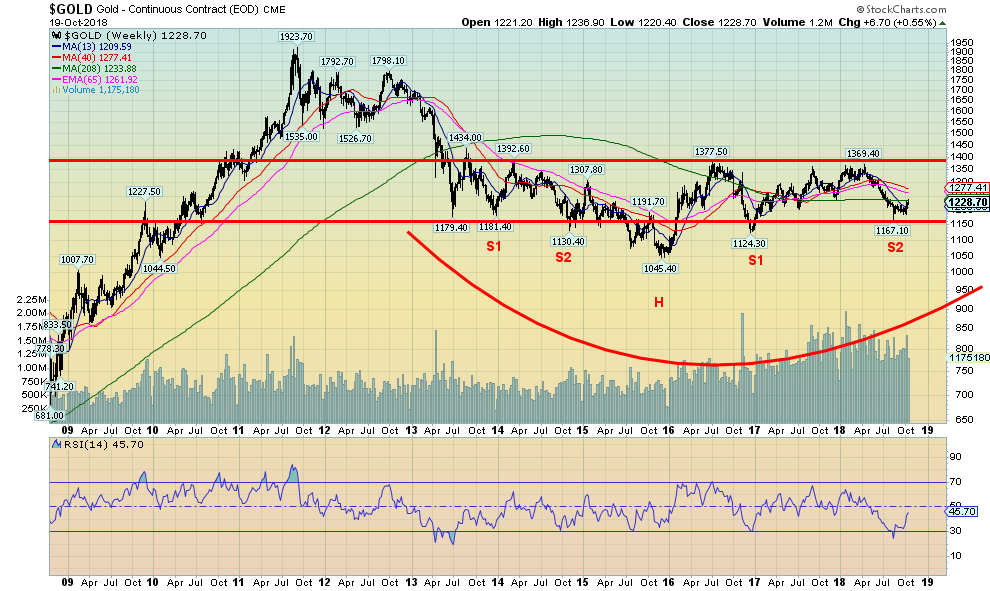
We continue to be encouraged by the longer-term chart of gold. As we have noted before, gold appears to be making a potential multi-year head and shoulders bottom—or, should we say, a potential multi-shouldered and heads bottom. This entire scenario would, however, be negated if gold were to plunge under $1,124 he December 2017 low. We have talked before about the potential 34-month cycle in gold with a range of 28–40 months (and possibly 42 months). The best starting point for that cycle is the October 2008 low at $681. The next recorded low that makes sense to us is the May 2012 low at $1,526. That came 43 months after the October 2008 low. That was followed by the December 2015 low at $1,045 that also came 43 months after the 2012 low. This is tricky because both lows appear to have come in outside of the longest period for the 34-month cycle. But they are the lows that stand out following the October 2008 low. Potential better fits are the December 2011 low at $1,523 and the November 2014 low at $1,130. They came 38 months and 35 months apart respectively. This puts the current low either 32 months from the December 2015 low or 45 months from the 2014 low. Using the December 2015 low is a much better fit. Gold’s next longer cycle of 7.83 years (range 6–9 years) most likely bottomed in December 2015, coming some 7 years after the October 2008 low. If correct, the next one is not due until 2023–2024, and gold is in the early stages of a new 7.83 cycle and entering the second phase of the 34-month cycle. Confirmation would come when gold takes out the long resistance at $1,360/$1,375. The caveat is that we see no new lows below $1,124. The potential head and double shoulders bottom has potential, measuring targets to $1,700 once gold clears $1,370 and preferably above $1,400. The caveat is that gold must stay above $1,124.
© David Chapman
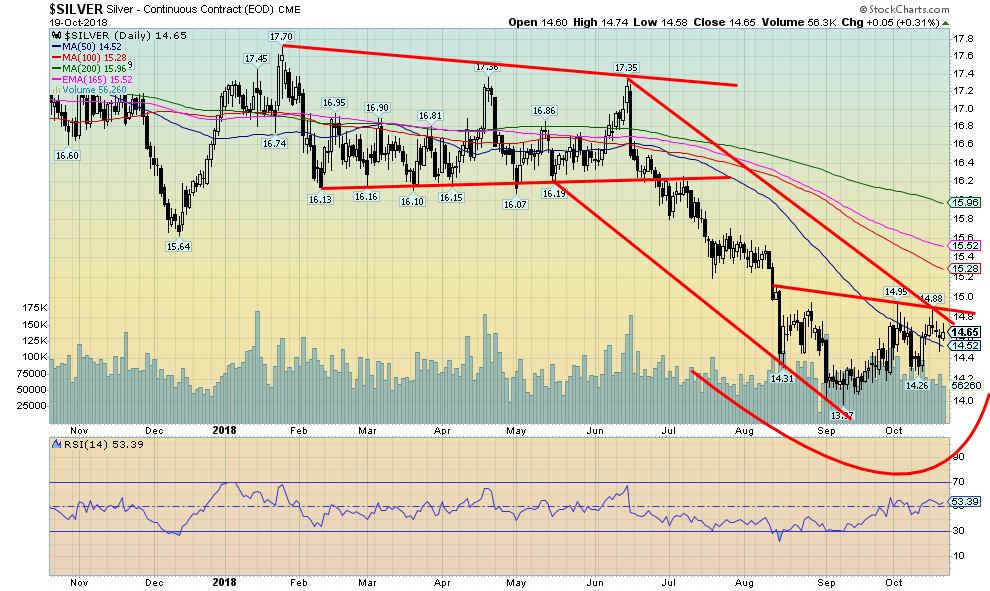
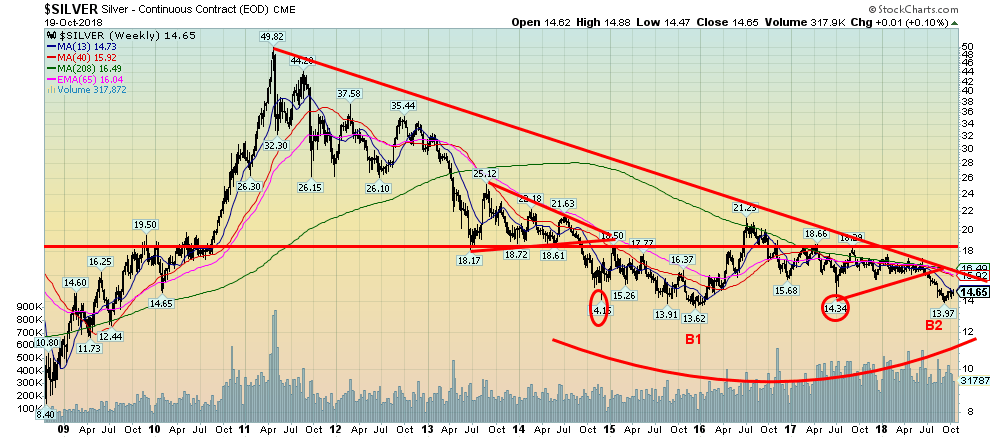
For the second week in a row silver was largely unchanged, gaining a tiny 0.1 percent on the week. Silver continues to trace out what appears to us as a bottom pattern, even an awkward looking head and shoulders bottom. If correct, then the breakout should come over $14.90 and project up to around $16. Coincidently, the 200-day MA comes in currently at $15.96. Following that, silver could pull back once again to test the break-out line near $15 and even dip lower once again. We’ll have to see, but we are encouraged by the positive look of the silver chart. This scenario is negated if silver were to plunge once again under $14.25.
© David Chapman
Like the gold commercial COT, the silver commercial COT pulled back this past week, back below 50 percent. It came in at 48 percent vs. 51 percent a week earlier. Long open interest barely budged, but short open interest did jump roughly 8,000 contracts. The large speculators still hold a large short position even as their COT improved to 45 percent from 43 percent. Again, long open interest barely budged but short open interest fell roughly 7,000 contracts. It is as if the large speculators covered their shorts, buying them from the commercials.
© David Chapman
The longer-term chart of silver appears to suggest it is trying to make a very broad-based double bottom. Raymond Merriman of MMA Cycles outlines how silver’s long-term cycle is 18.5 years with a range of 15–22 years. Silver made a very distinct double bottom way back in 1991–1993. The 2008 low at $8.40 came 15 years after the 1993 low, while the 2015 low at $13.62 came 22 years after the 1993 low. The 18.5-year cycle can break down in three 7-year cycles, ranging from 5–9 years. The November 2001 low came 8 years later while the October 2008 low came 7 years after the 2001 low. Following that, we had the December 2015 low coming 7 years after the 2008 low. If all of that is correct then we would assume the December 2015 low is the end of the most recent 18.5-year cycle. Confirmation would come with a move above the 2016 high of $21.23. The next 7-year cycle would be due 2022 with a range of 2020–2024. Since this is a new 18.5-year cycle phase, the first phase can often be the strongest. The only thing that might get in the way of an up move now in silver is a breakdown under $13.62 the December 2015 low. Silver’s 7-year cycle breaks down into two 40-month cycles. The first 40-month low is due April 2019 +/- 7 months. We are currently in that window. The low seen at $13.97 on September 11 came near the beginning of that window. There is still time left to retest that level. And that is okay as long as silver doesn’t break down under $13.62, the low of December 2015.
© David Chapman
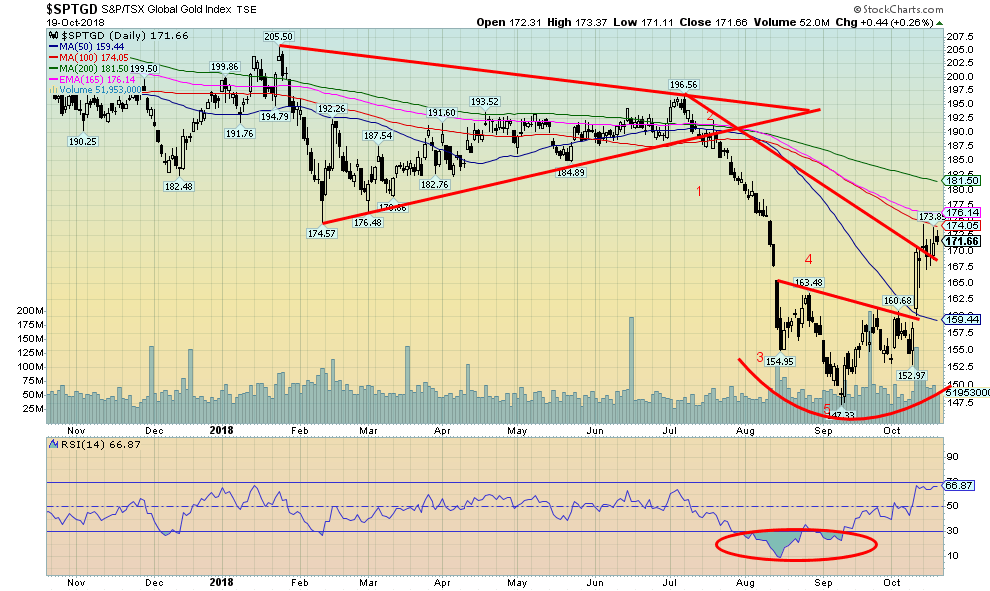
For the third week in a row the gold stocks put in an up week. This is the most sustained up move since late 2016. The TSX Gold Index (TGD) gained 1.8 percent while the Gold Bugs Index (HUI) jumped 1.5 percent. The TGD is now coming into another resistance zone that ranges from roughly 174 to 176. Once through that level the next resistance is seen at the 200-day MA near 180–182. It was earlier this year that, after topping in April, the TGD dropped through the 200-day MA. The possible head and shoulders bottom on the TGD projects up to at least 178, putting the TGD firmly into the 180–182 zone. The TGD has support down to 165 and again at 160. The scenario only collapses with a move back under 153. We doubt that.
© David Chapman
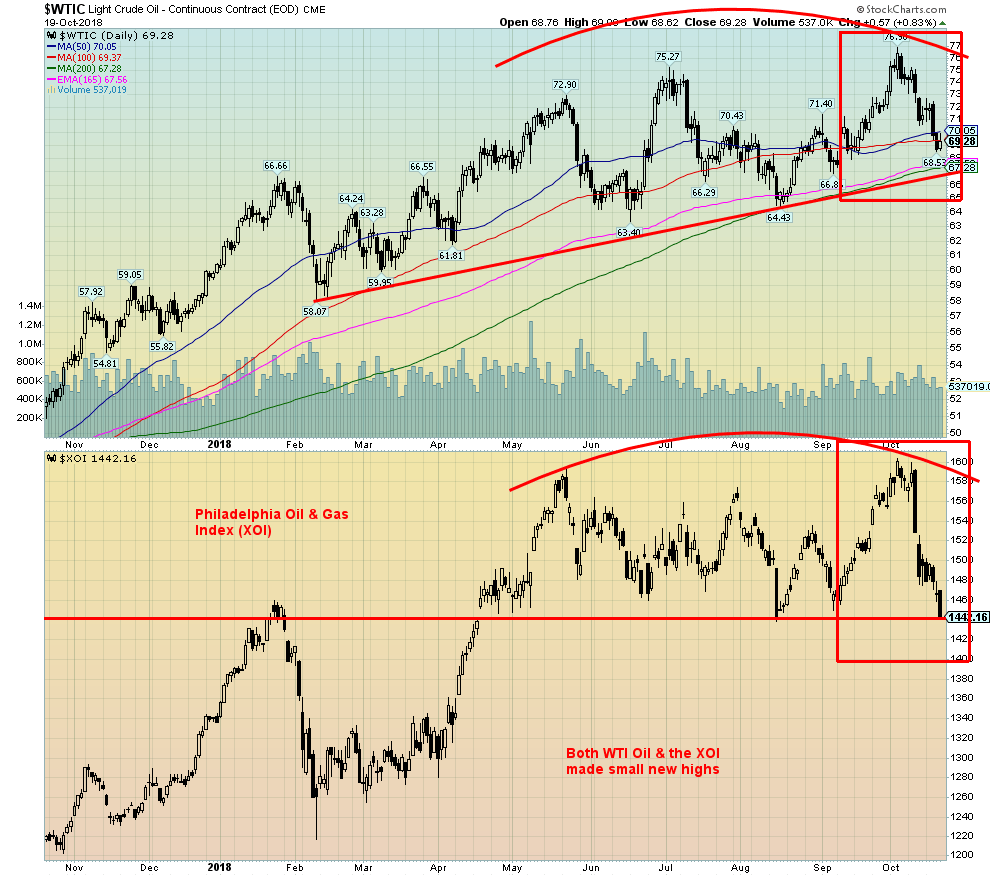
We decided to substitute the TSX Energy Index (TEN) with the Philadelphia Oil & Gas Index (XOI) because of the distortions caused by the fact that Canadian oil prices are sharply below WTI oil. Canadian crude is currently priced at $29.34 vs. $69.28 for WTI oil. Brent crude is priced higher at $79.78 (all prices US$). It is priced lower because of the difficulty in getting Canadian crude (heavy oil from the tar sands) to market. This happens even though Canada is the largest foreign exporter of oil to the U.S.
Nonetheless the XOI trades more consistently with WTI oil. Over the past couple of weeks both fell in tandem despite making new small highs back on October 3. Trade concerns and concerns over how the sanctions against Iran will play out were helping push prices higher. Now it is doing the opposite. The question now is, is oil (and the oil stocks) poised for a breakdown or will they reverse course once again? The charts appear to be negative and WTI oil and the XOI both could break to the downside. Strong seasonals for oil (and energy stocks) don’t really kick in until December. So, we are still in the soft season. That may explain why neither has done much since May.
If there is a fly in the ointment, it is the Khashoggi case. That it could cause oil prices to rise is pure speculation and quite possibly wishful thinking. But it does need to be aired and considered. While the case, so far, seems to be leaning towards finding scapegoats and patsies to take the focus off of Mohammed bin Salman, there remains some risk that the U.S. would put sanctions on Saudi Arabia. That it most likely won’t happen doesn’t take away from the potential nightmare scenario of it did. Saudi Arabia has threatened retaliation if sanctions were placed on them. What form could retaliation take? First would be a cutback in the supply of oil, helping push oil prices up through $75 and possibly upwards to $100 or higher. Second, the Saudis might decide to end their long opposition with Iran and decide that they have a common enemy—the U.S. Third, the Saudis might decide to ask for payment for their oil in Chinese yuan, thus breaking the petrodollar. Fourth, the Saudis could then cancel their huge multi-billion arms orders with the U.S. and turn to China and Russia for arms instead. Nightmare scenario? For sure for the U.S. and the West, anyway. Will it happen? Not likely. But it is a consideration. And, no, Canada could not make up for a sharp cutback in Saudi oil to the West. More likely to step in is Venezuela. Perish the thought.
Meanwhile both WTI oil and the XOI are looking toppy. The XOI is closer to a breakdown. A breakdown under 1,440 could send the index down to the 1,300 zone. For oil, a breakdown under $67 could send WTI oil tumbling to around $55. Regaining above $70 would be positive and above $73 might suggest a run back to the highs or higher. Oil has been advancing in a series of higher highs and higher lows. That appears to be a good uptrend. The XOI seems to making some sort of top, but could turn back up again as well if WTI oil were to recover back to the upside. Maybe we should just watch how the Khashoggi case plays out. But in all probability both sides want to find a way out. The fly in the ointment is Turkey. Both Turkey and Saudi Arabia have been at odds, as both see themselves as the self-styled leaders of the Sunni Islam world.
Chart of the week
© David Chapman
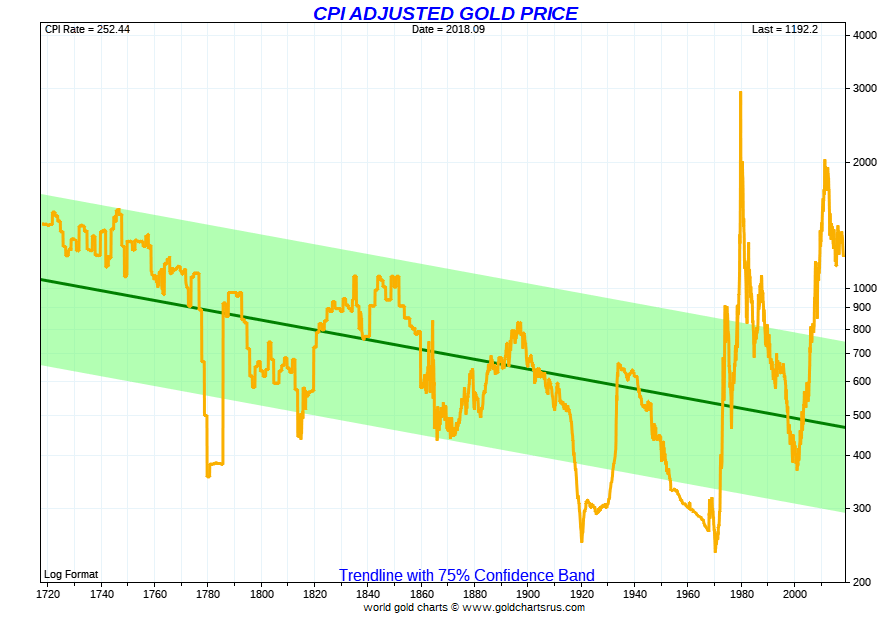
It is always interesting looking at the inflation-adjusted gold price. After all, they say that gold should be a long-term hedge against inflation. For years, however, gold was fixed. At the turn of the last century it was fixed at $20.67 for an ounce of gold. In 1934 it was revalued upwards to $35 for an ounce of gold. After Richard Nixon took the world off the gold standard in August 1971, gold was set free to trade in the market. By January 1980 it rose to $875, but after it collapsed it bottomed for good in 2001 near $250. In 2011 gold hit its nominal high at $1,923. But when one adjusts for inflation gold peaked at nearly $3,000 in today’s money in 1980. The 2011 high fell short, hitting only near $2,000. Given the fixed price of gold it was mostly a long downward trend for gold. But note in today’s inflation-adjusted prices it was still over $1,000 back in 1720. It is not that far from that level now.
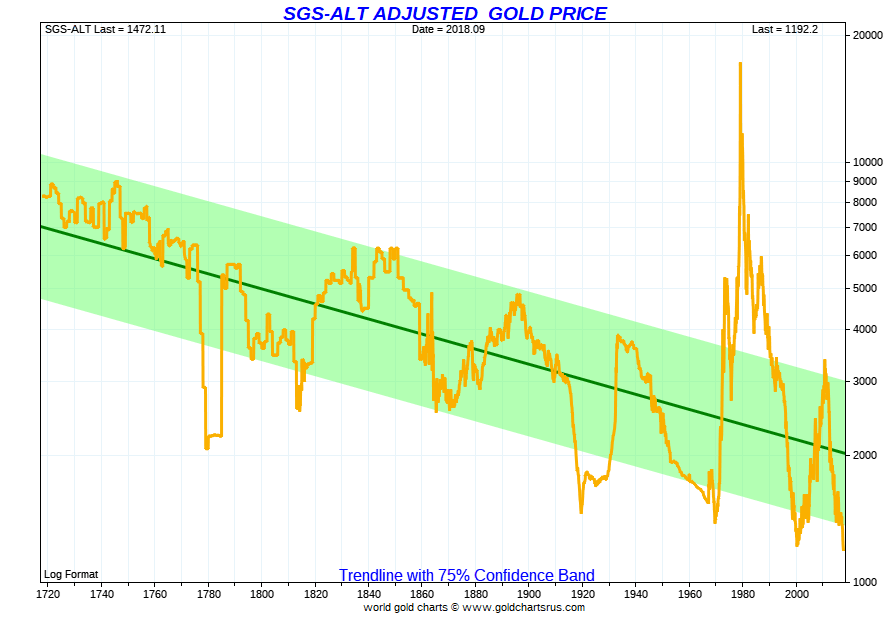
But there are all sorts of problems with inflation or CPI-adjusted prices. As Shadow Government Stats (www.shadowstats.com) points out, the official CPI uses hedonics, substitutions, and dampens the cost of food and energy to reflect a constant standard of living rather than a true measure of the cost of living. Our second chart below shows the SGS adjusted gold price. Quite a different picture. Gold, using SGS adjusted inflation is today as low in price as it has ever been since 1720. And we are a long way from the SGS inflation-adjusted price of 1980 that hit $17,200.
© David Chapman
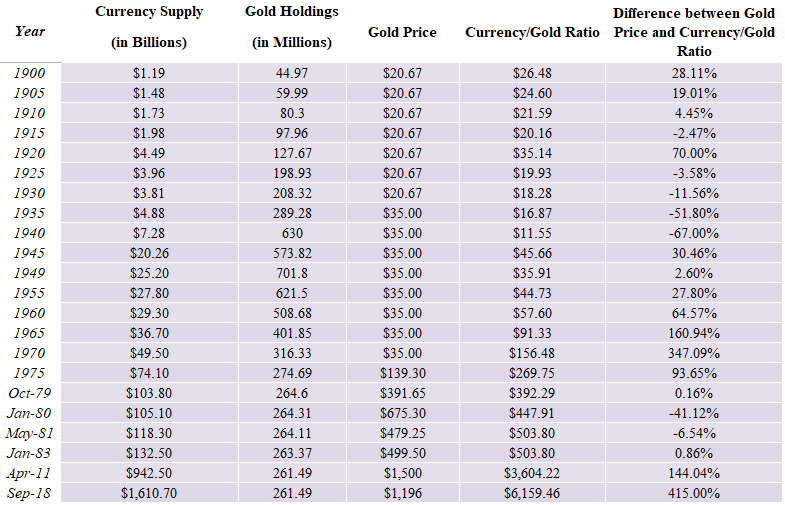
Inflation, however, is a monetary phenomenon. So, if one is to properly measure the inflation-adjusted gold price one should measure it against the currency supply known as M0. This was noted in an article by Joseph Bron in an article in Seeking Alpha back in 2011. If gold is truly backing the currency, then the gold price and the currency/gold ratio should be equal or at least reasonably equal. The currency/gold ratio is the currency supply (MO) divided by the ounces of gold a country holds. The U.S. holds 8,133.5 metric tonnes or 261.5 million ounces. The latest MO is $1,610.7 billion. That would give us a currency gold ratio price of $6,159. With gold trading near $1,230 we are clearly nowhere near that price. Another indicator that gold is sharply undervalued.
Below is a table reflecting the changes over the years.
© David Chapman
(All charts are courtesy of Stock Charts, Trading Economics, Stlouisfed.org and COT Price Charts.)
—
DISCLAIMER: David Chapman is not a registered advisory service and is not an exempt market dealer (EMD) nor a licensed financial advisor. We do not and cannot give individualized market advice. David Chapman has worked in the financial industry for over 40 years including large financial corporations, banks, and investment dealers. The information in this newsletter is intended only for informational and educational purposes. It should not be considered a solicitation of an offer or sale of any security. The reader assumes all risk when trading in securities and David Chapman advises consulting a licensed professional financial advisor before proceeding with any trade or idea presented in this newsletter. We share our ideas and opinions for informational and educational purposes only and expect the reader to perform due diligence before considering a position in any security. That includes consulting with your own licensed professional financial advisor.


PayPal’s Slowdown: From Fintech Leader to Low-Growth Dividend Stock
PayPal has shifted from fintech leader to low-growth, value-style stock, losing over 25% in market value and trading at a...


Tilray (TLRY) Falls as Bearish Momentum Persists Despite Marketing Push
Tilray (TLRY) fell 3.32% to $4.44, remaining below key moving averages and signaling continued bearish pressure. Despite a £1 million...


ESG Gap Persists as Firms Struggle to Link Sustainability to Financial Value
KPMG’s Global Survey shows a major gap between ESG awareness and financial integration. While 72% of managers understand sustainability strategies,...


Bitcoin and Ethereum Slide as Market Pressure Builds Amid Strategy Concerns and Layer 2 Disruptions
Bitcoin fell below $60,000 with heavy ETF outflows, pressured by concerns over Strategy’s finances and its STRC stock decline. Ethereum...


AI Venture Builder Launches €600K Crowdfunding Round to Scale Secure AI Solutions
AI Venture Builder, an Italian-British firm developing AI applications and vertical startups, returns to CrowdFundMe with a equity campaign. After...
 |
|
 |  |
 |
|
-

 Fintech5 days ago
Mollie Expands Across EEA With €350M Investment to Strengthen European Payments Network
-

 Cannabis2 weeks ago
Europe’s Cannabis Shift: Rising Use, and New Risks
-
 Crowdfunding2 days ago
AI Venture Builder Launches €600K Crowdfunding Round to Scale Secure AI Solutions
-

 Impact Investing1 week ago
AI Adoption in Italian Retail Stalls Despite Strong Experimentation
You must be logged in to post a comment Login