Featured
Mr Bear Looks at the Dow Jones & Barron’s Gold Mining Index
The advantage of looking at market data via a BEV plot is; it compresses price data into a percentage range of 100%. With each new all-time high (BEV Zero) registering as 0.00%, and never more, with a BEV of -100% being a total wipeout in valuation. This was true whether we’re looking at the Dow Jones during the 1890s, when the Dow Jones traded between 32.97 and 81.81, or today with the Dow Jones approaching 36,000.
This week I’m taking a break from my usual format of market commentary. This market has become tedious, with week after week the same old stuff. So instead, this week I’m focusing on how Mr Bear sees the Dow Jones and the Barron’s Gold Mining Index (BGMI). Which market series is overvalued or undervalued, and for how long they have been this way?
Let’s examine the Dow Jones, going back to when it was first published in February 1885, but looking at it as Mr Bear does; in terms of new all-time highs and percent clawbacks from those all-time highs. Or in other words, in my Bear’s Eye View format (BEV).
The advantage of looking at market data via a BEV plot is; it compresses price data into a percentage range of 100%. With each new all-time high (BEV Zero) registering as 0.00%, and never more, with a BEV of -100% being a total wipeout in valuation. This was true whether we’re looking at the Dow Jones during the 1890s, when the Dow Jones traded between 32.97 and 81.81, or today with the Dow Jones approaching 36,000.
With a BEV chart we can directly, and accurately compare any period of Dow Jones history with any other. For instance, how many new all-time highs occurred? What was Mr Bear’s largest percentage claw back in the first decade of Dow Jones history, or its latest?
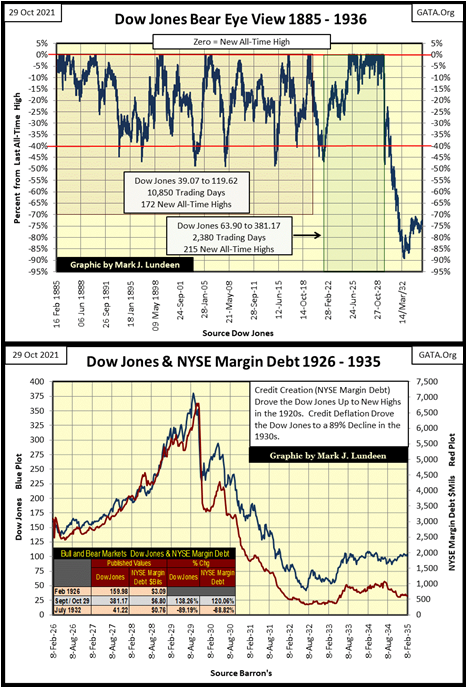
Let’s first look at the Dow Jones for its first half-century; from February 1885 to 1936 (chart below). In dollar terms, from February 1885 to November 1919 (Red Box) the Dow Jones advanced from 39.07 to 119.62. During these five decades of market history, the Dow Jones saw 172 new all-time highs as it advanced 206%. In the BEV chart below, it’s apparent how the Dow Jones did this; by occasionally making a few new BEV Zeros, after which it saw a bear market decline of over 40%, repeating this wash and rinse cycle five times between 1885 to 1919.
Then in August 1921, at the bottom of another 40%-bear market (Green Box), and something changed in the market. From 63.90 on 24 August 1921, the Dow Jones advanced, uncorrected for the next eight years, to 381.17 on 03 September 1929; a gain of 497%. During these eight years, the Dow Jones made 215 new all-time highs (BEV Zeros) in the BEV chart below.
Comparing the cluster of BEV Zeros during the 1920s, a multi-year cluster with no percentage claw back breaking below the Dow Jones’ BEV -20% line, to the tiny clusters seen before. It’s obvious something had changed in the stock market.
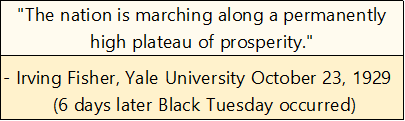
In 1929, an advance of 497% in only eight years was astounding! The inflating valuations in the Dow Jones was misunderstood as economic growth by most people. This included Yale’s Professor Irving Fisher, who like John Maynard Keynes, was a famous economist of the post-WWI era.
What caused this amazing market performance? The Federal Reserve was “injecting liquidity” into the stock market via NYSE Margin Debt, as seen in the chart above. Note the Dow Jones (Blue Plot) in the autumn of 1929 began deflating before the banking system began calling in their margin debt (Red Plot).
Credit bubbles can only go on for so long, and so high before market gravity pulls them back down to Earth. At its July 1932 bottom, the Dow Jones deflated 89.19%. It’s interesting noting margin debt contracted by 88.82% during the Great Depression Crash. Is it fair saying that both the Roaring 1920s Bull Market, and the depressing 1930s crash were both monetary events created by the Federal Reserve System? I sure think so!
Next, we look at the Dow Jones from February 1885 to the close of this week (BEV chart below). Since August 1971, when the Bretton Woods’ $35 an ounce gold peg was suspended, the Dow Jones has seen many new all-time highs (0.00%), 831 to be exact. It has also seen a few nasty corrections during this time. But these corrections haven’t corrected the FOMC’s, inflationary “monetary policies.” At the bottom of each post 1971 40% correction, the Dow Jones was soon making new all-time highs, as the FOMC was inflating the Dow Jones to levels far above where economic reality would have it.
Since the bottom of the sub-prime mortgage crash, Mike Pento, President and Founder of Pento Portfolio Strategies, said 20% of publicly traded corporations have become zombies. Zombie companies are corporations who have taken on so much debt, their operations can’t service their past debts. To service their current liabilities, these zombies take on new debt, which isn’t a long-term solution to their problem. But with the Dow Jones, and many other major stock indexes I track making multiple new all-time highs this week, no one seems to care.
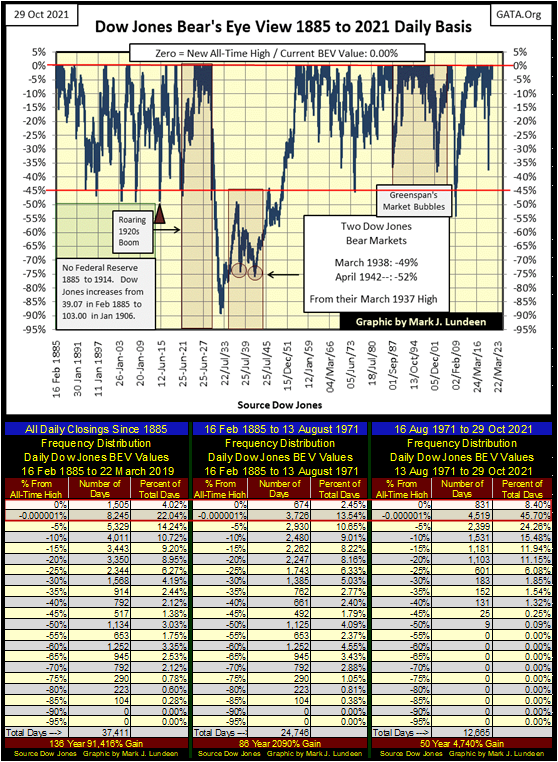
To better grasp the data above, I have three frequency distribution tables (above). The table on the far left contains all the daily closes since February 1885. The other two tables have split this data before August 1971, and after, to illustrate the impact on the Dow Jones, of terminating the Bretton Woods’ $35 an ounce gold peg in August 1971.
Seeing the frequency of daily closings at new all-time highs, and the percentage claw-backs from them in increments of 5%, is a great benefit when analyzing the 136-year history of the Dow Jones in the Bear’s Eye View format.
To see how bullish any period of market history is, I like combining the daily hits in the two top rows in these freq tables (Red Box); the 0% row (new all-time highs) and the -0.00001% row (daily closings in scoring position). Daily closings in scoring position are daily closings just short of being a new all-time high, down to a BEV value of -4.99%; those daily closings within 5% of a new all-time high.
Their breakdowns of BEV Zeros, plus scoring position closings as a percentage of total daily closings are as follows;
- All Daily Closings Since 1885 / 26.06% of Total Daily Closings
- 16 February 1885 to 13 August 1971 / 15.99% of Total Daily Closings
- 16 August 1971 to 29 October 2021 / 54.10% of Total Daily Closings
Seeing over half of all daily closings for the past five decades, either being a new all-time high, or within 5% of one is a disturbing fact. Proof positive the stock market has been manhandled to dangerous levels by the idiot savants at the FOMC for a very long time.
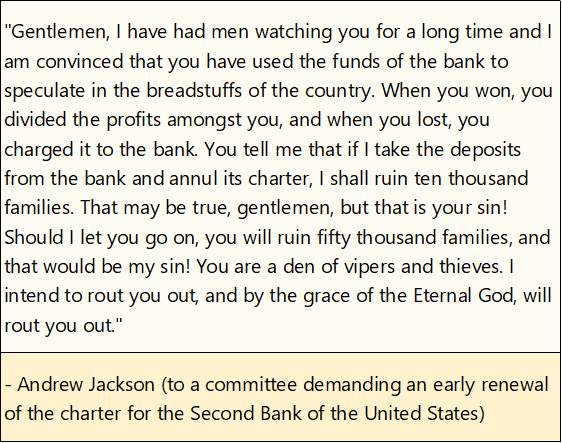
What is there to do about this? Congress should legislate the Federal Reserve out of existence, and the Department of Justice take actions against those in this den-of-thieves. But that isn’t going to happen. What we really need is another Andrew Jackson, the American President who took on, and destroyed these banksters in the 1830s
So, as individual investors, we should look for other areas in the stock market that are undervalued, or un-inflated. But, is there a market sector that has been unaffected by “liquidity” flowing from the FOMC? A market sector where BEV Zeros and daily closings in scoring position are rare market events?
Below is a chart plotting the indexed values (1.00 = 05 January 1920) of;
- Currency in Circulation (CinC / Green Plot)
- Dow Jones (Red Plot)
- Barron’s Gold Mining Index (BGMI / Blue Plot)
The data is weekly, as data for both CinC and BGMI are weekly. In the table on the chart, I’ve listed these index values at the end of this week. It’s obvious CinC inflation has been running away from both the Dow Jones and the BGMI since the sub-prime mortgage bear market, with its three QEs.
But note how for thirty years, from 1965 to 1995, the BGMI’s valuation was typically above the rate of CinC inflation. That is something the Dow Jones hasn’t done since the depressing 1930s. Also note that today, the BGMI is below where it was forty years ago in 1980, something that can’t be said for the Dow Jones.
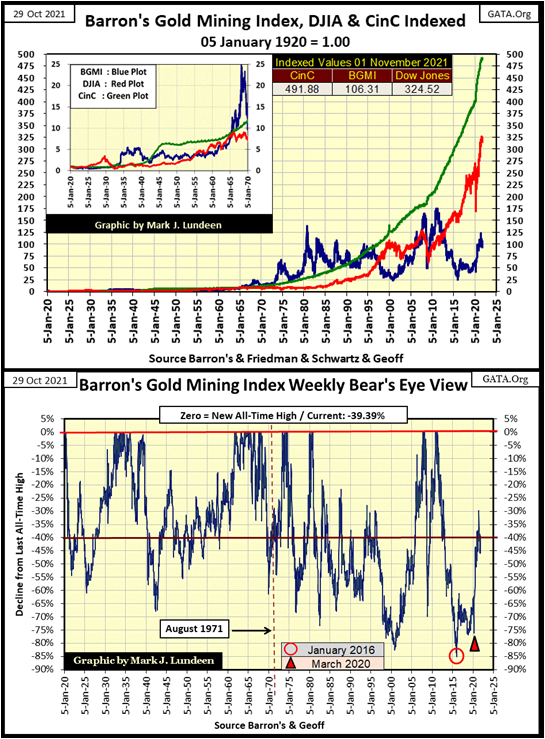
Above is a Bear’s Eye View of the Barron’s Gold Mining Index going back to 1920. I placed a dotted red line at August 1971, as that was when the US Treasury terminated the Bretton Woods’ $35 gold peg.
In the top chart, monetary inflation exploded (Green CinC Plot) after the Federal Reserve was freed from its last link to a gold standard. Yet, look at what this massive influx of inflation did for the BGMI. Before August 1971, most BGMI weekly closings, closed ABOVE its BEV -40% line. After August 1971, most BGMI weekly closings closed BELOW its BEV -40% line.
Note also, the lowest BEV value the BGMI saw since 1920 occurred on January 2016, when it broke below its BEV -85% line. Take a moment to study BGMI’s BEV chart above. In October 2021, is it possible to think of the gold miners as being overvalued? I’m thinking of them as compelling values, for those who have the patience to wait.
The two frequency distribution tables (below) compare the BGMI’s BEV data plotted above, before and after August 1971. Before August 1971 the BGMI closed at a new all-time high, or in scoring position in 13.10% of its 2,695 weekly closes. Following August 1971, the BGMI closed at a new all-time high, or in scoring position in only 3.29% of its 2,616 weekly closes.
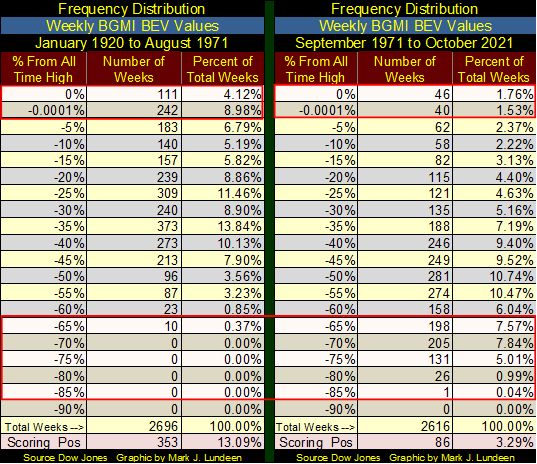
Compare the weekly closes for the BGMI in its BEV -65% row, and the rows below it (above). Before August 1971, which includes the Great Depression Bear Market, the BGMI close 65%, or more from an all-time high for only ten weekly closes. After August 1971, the BGMI closed below 65%, or more from an all-time high for 561 weeks, or 21.45% of its 2,616 weekly closes since August 1971.
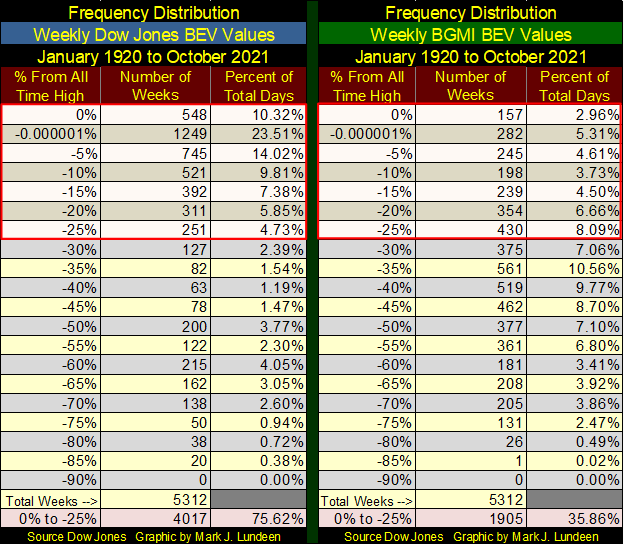
Now let’s directly compare the weekly data for the Dow Jones and the BGMI, going back to the first week of 1920, in the two frequency distribution tables below. Again, looking at the weekly closings at BEV Zeros and in scoring position. The Dow Jones has closed at, or within 5% of a new all-time high in 66.42% of its weekly closings for the past 101 years. Compare this to the Barron’s Gold Mining Index performance, where it has closed at, or within 5% of a new all-time high in only 15.98% of its weekly closings for the past 101 years.
Looking at the data from the BEV Zero down to the BEV -25% rows, or weekly closings at new all-time highs and within 30% of one, the Dow Jones closed within this red box in 75.62% its 5312 of its weekly closings. The BGMI in only 35.83% of its total weekly closings.
Looking at the 101-year history of the BGMI, as Mr Bear does above, proves my point; that monetary inflation flowing from the Federal Reserve System has not benefited the share prices of gold mining companies, or the gold and silver bullion they mine. So then, what does drive valuations of gold mining companies upward? Deflation in the financial markets, creating flight capital fleeing this deflation, provides the rocket fuel for bull markets in precious metals assets.
So, what’s the problem with inflating financial asset valuations? For one thing, it’s not an honest thing for any government to do. In fact, an inflationary monetary policy is a predatory act by a government on its citizens. And a second thing, ultimately monetary inflation leads to ruin. All this has been known for centuries, and those responsible for today’s “monetary policy” know exactly what, and why they do so. What can I say? We live in an evil world, where in human society, like in a jungle, the strong feed on the weak.
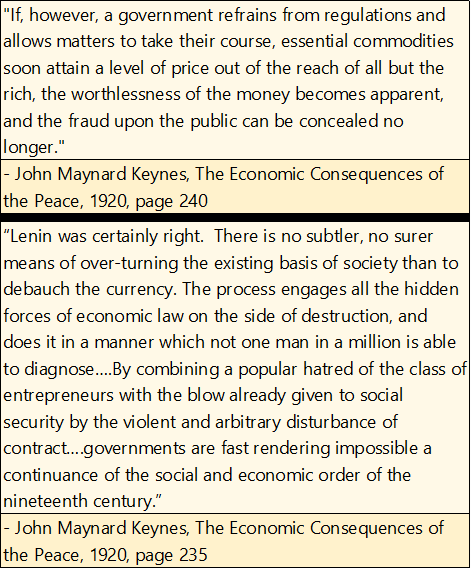
Here’s two quotes from John Maynard Keynes, from his book “The Economic Consequences of the Peace.” A study of Germany’s economy after their defeat in WWI. The inflationary consequences will prove to be as true for us in the 21st century, as it was for Germany a century ago.
To be sure, we have hard days coming our way when Mr Bear comes to settle all accounts. Tens-of-trillions in dubious assets now on corporate and personal balance sheets will be reappraised, to be deeply discounted or completely written off. And today’s wildly inflated valuations in the financial markets will be ruthlessly clawed back down to reality.
But it’s a foul wind that blows no good. I anticipate the gold miners, whose market valuations are currently beaten down (as a matter of “policy”), will become the glamor shares when Mr Bear finally does come, and has his way with Wall Street and Washington, and anyone else who has exposure to the market’s current inflated valuations.
But he didn’t come last week. I know that by seeing all the BEV Zeros in my table below, listing daily BEV values for the major market indexes I follow. And every index below closed each day either at a BEV Zero or in scoring position, except for the gold and silver miners in the XAU.
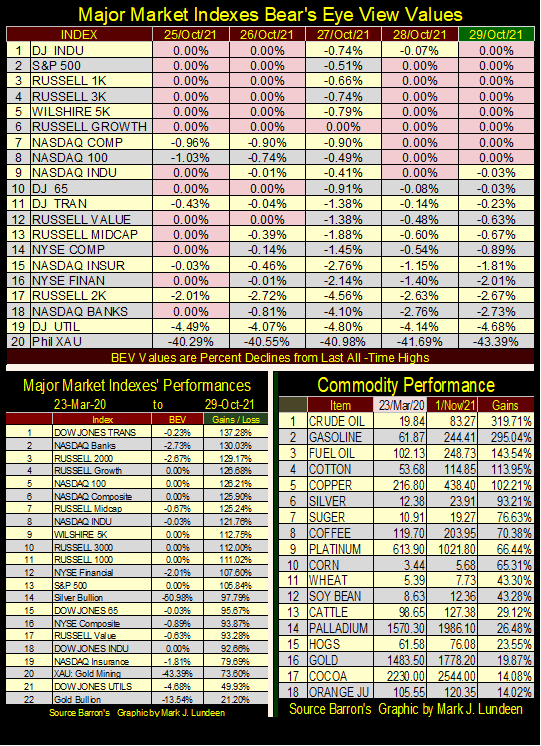
When we compare the advances seen in these stock indexes to commodity prices seen above. How much longer can the “policy makers” keep the financial market’s valuations inflated if double-digit CPI inflation continues?
I don’t know, but in Greg Hunter’s interview with Mike Pento at the link below, Mike thinks next spring will be something completely different for the stock market from what we see in the tables above. Like me, Mike likes the gold and silver miners and precious metal assets, and expects their valuations to explode when rising commodity prices force bond yields to once again rise.
—
(Featured image by Buffik via Pixabay)
DISCLAIMER: This article was written by a third party contributor and does not reflect the opinion of Born2Invest, its management, staff or its associates. Please review our disclaimer for more information.
This article may include forward-looking statements. These forward-looking statements generally are identified by the words “believe,” “project,” “estimate,” “become,” “plan,” “will,” and similar expressions. These forward-looking statements involve known and unknown risks as well as uncertainties, including those discussed in the following cautionary statements and elsewhere in this article and on this site. Although the Company may believe that its expectations are based on reasonable assumptions, the actual results that the Company may achieve may differ materially from any forward-looking statements, which reflect the opinions of the management of the Company only as of the date hereof. Additionally, please make sure to read these important disclosures.


Abivax Shares Surge as New Trial Data Eases Safety Concerns Over Ulcerative Colitis Drug
Abivax shares surged nearly 36% after positive updated trial results for its ulcerative colitis drug obefazimod reassured investors following earlier...


El Dorado Raises $9M to Expand Cross-Border Fintech Platform
El Dorado, a Latin American fintech improving cross-border financial services, raised a $9 million Series A led by Paradigm with...


Bitcoin Stalls Near $60K as Strategy Moves, ETFs Outflow, and EU MiCA Rules Take Effect
Bitcoin hovers near $60,000 with ETF outflows, while Strategy boosts reserves, sells BTC, and raises dividends to reassure investors. Ethereum...


Cannabis Dominates Global Drug Use: Trends, Risks, and Shifting Markets
Cannabis remains the world’s most widely used illicit drug, with 256 million users in 2024, surpassing all others combined. Growth...


Italy Approves First Hydrogen-Powered Train for National Rail Network
ANSFISA has approved Italy’s first hydrogen-powered train, the Alstom HMU214, for use on the Brescia–Iseo–Edolo line. Capable of 140 km/h,...
 |
|
 |  |
 |
|
-

 Crowdfunding2 weeks ago
Temotiva Launches Crowdfunding Campaign to Advance Preventive Mental Health
-
 Fintech2 hours ago
El Dorado Raises $9M to Expand Cross-Border Fintech Platform
-

 Crypto7 days ago
Bitcoin Holds Steady as Microtransactions Surge and ETF Inflows Continue
-

 Biotech2 weeks ago
AseBio 2025 Report Highlights Growth and Future Potential of Spanish Biotechnology