Featured
What negative-yielding bonds mean for the US economy
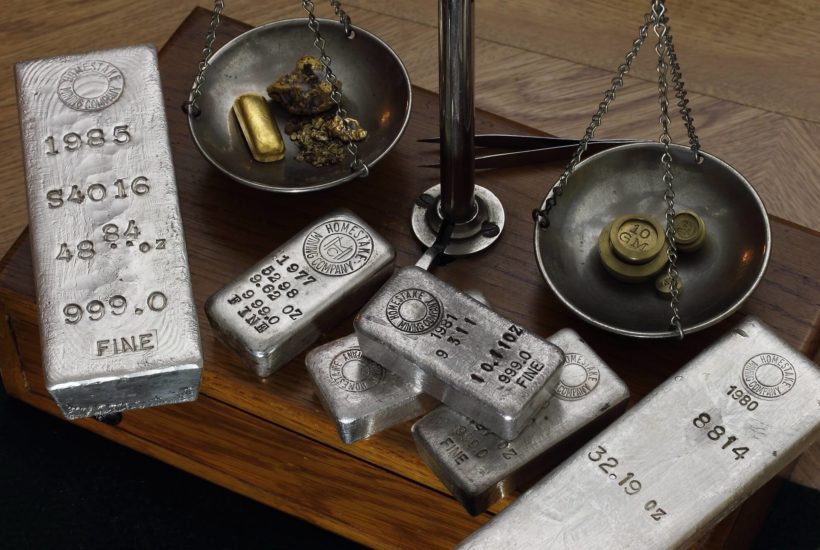
Something is shaking up the precious metals market. In May, the markets advanced, with gold lifting off its BEV -32.5% line. Three months later, the yellow metal cleared its BEV -20% level. Silver’s last all-time high price at $48.70 on January 1980. This week, it closed at $18.30. Meanwhile, negative-yielding bonds is an issue demanding even larger attention in the financial markets.
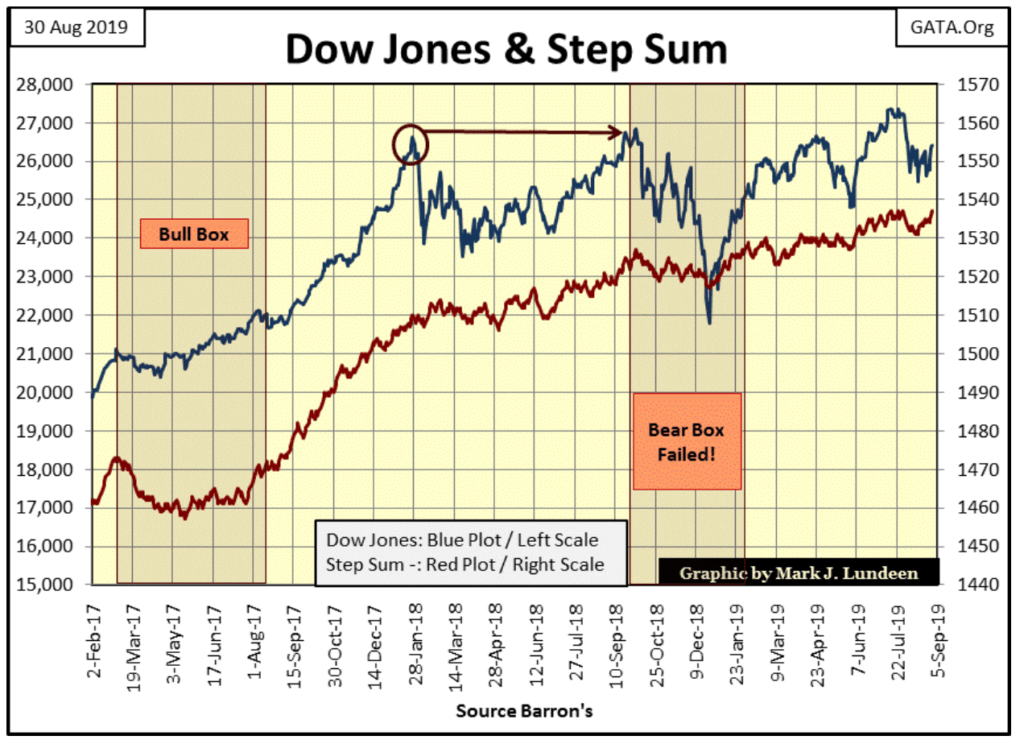
The close of the week found the Dow Jones -3.49% from its last all-time high of July in the BEV chart below.
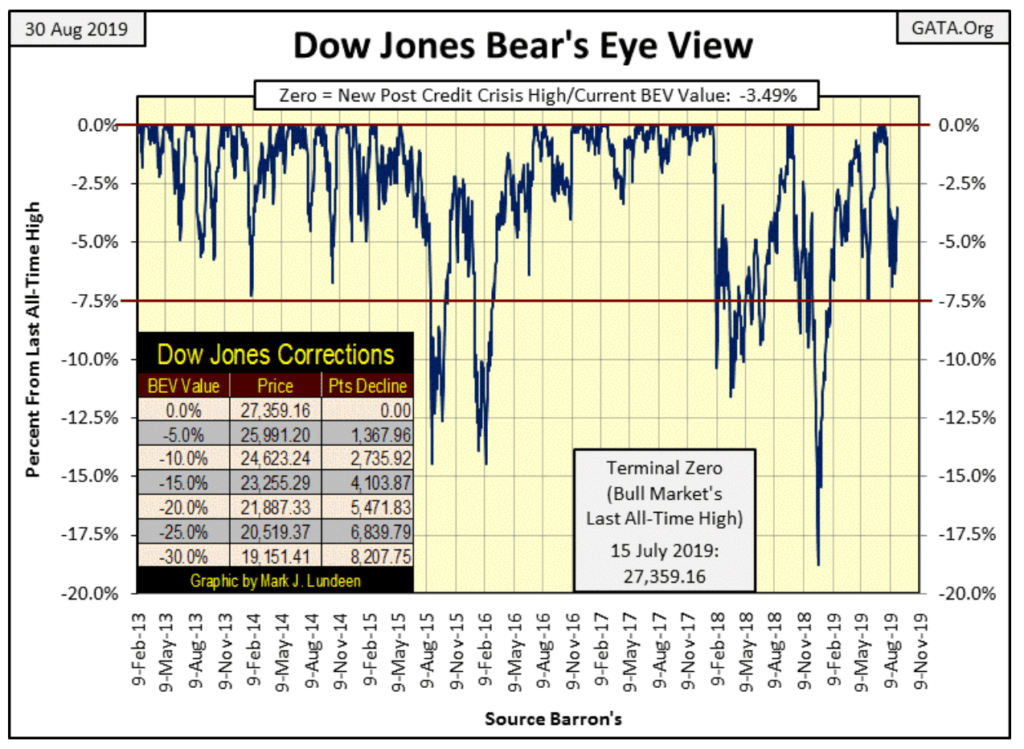
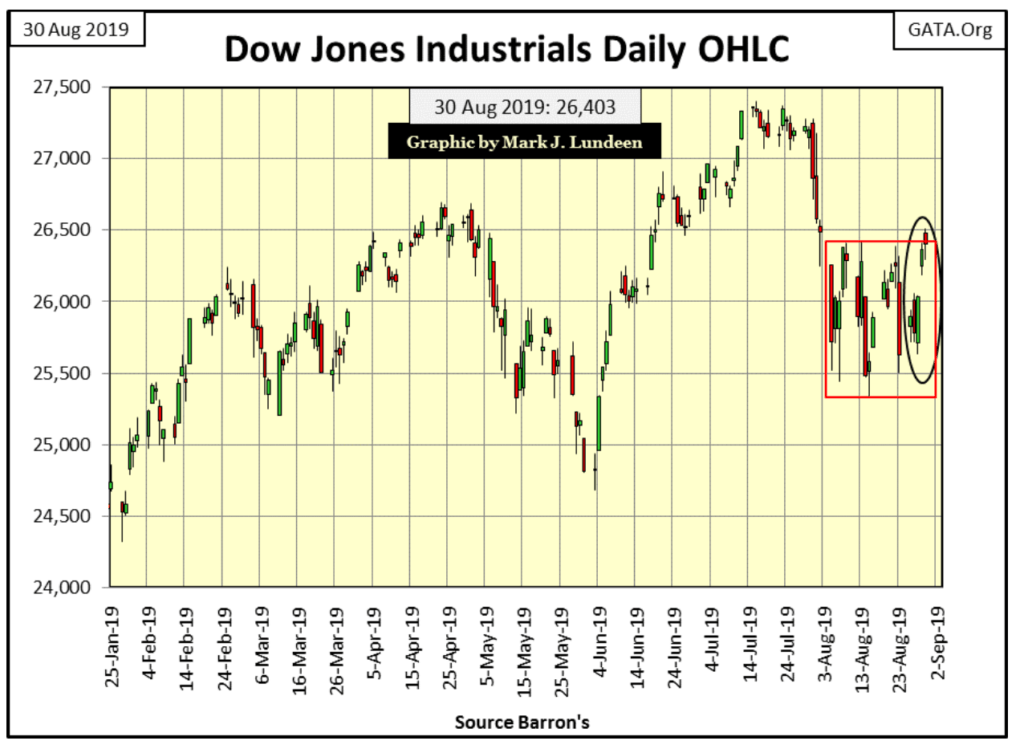
After weeks of the Dow Jones closing darn near the same distance from its last all-time high, this is getting pretty boring. A better view of what I’m talking about can be seen with the Dow Jones in daily bars below. Inside the red box is the daily action for the Dow Jones from the first week of August, and I’ve circled this week’s trading.
A lot of churning is going on inside that box, though on Friday the Dow Jones did peep above the box’s upper levels. I’m not going to call that a breakout in the Dow Jones just yet. Let it break above the 26.5K line before we assume a breakout because as things are now, the Dow Jones could just as well break below the box’s lower levels by the end of next week.
Hong Kong’s plight
What might cause the Dow Jones to do that? Lots of things, but what’s on my mind is the current situation in Hong Kong. Everyone in the navy looked forward to a port call in Hong Kong; a beautiful city filled with happy people, great food and tourist sites visitors would long remember. I still have a stub for a ticket to the Star Ferry that provided transportation for people from the Island of Hong Kong to Kowloon on the mainland.
Hong Kong is a major league player in the global financial markets. Do you believe the Chinese Communist Party bosses in Beijing can abuse Hong Kong and not impact the financial markets? Maybe, but I think not.
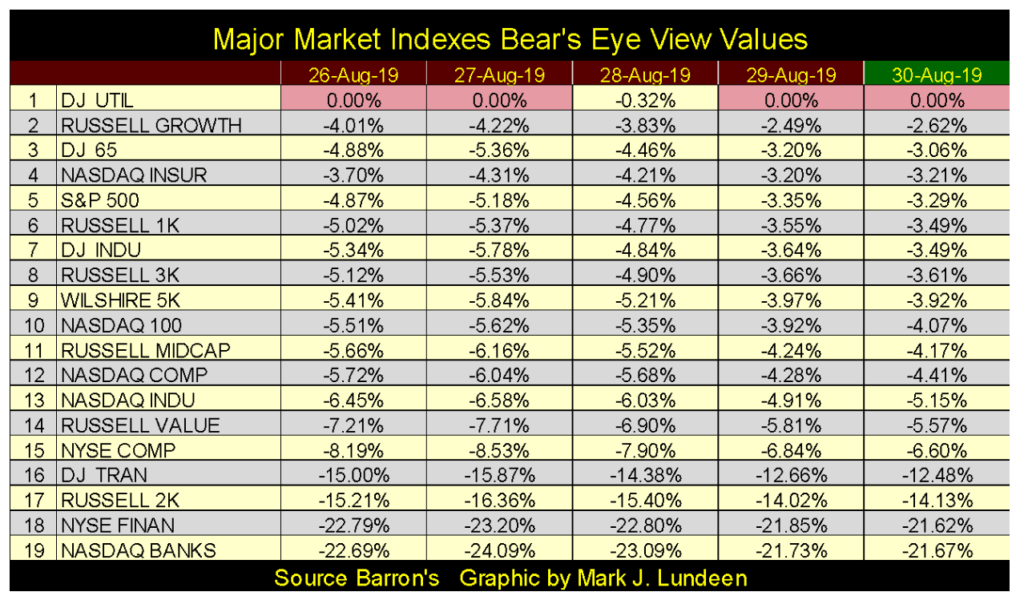
Here’s how the other major stock indexes I follow have performed this past week. The Dow Jones Utility Average made four new all-time highs as the other indexes all crept forward to their last BEV Zeros. However, with a slight variation that has been the weekly summary since the end of July; with everyone in scoring position, only the DJ Utilities Average (#1 in Table Below) manages to do so.
Will this continue to be the story as we progress through September? I doubt that. Something is going to happen that is going to force the market to either take these indexes to new all-time highs or test the lows of last December when the Dow Jones saw an eighteen percent market correction.
We’re approaching the month of October. If something big and bad is going to happen, Mr. Bear typically likes to do it in October.
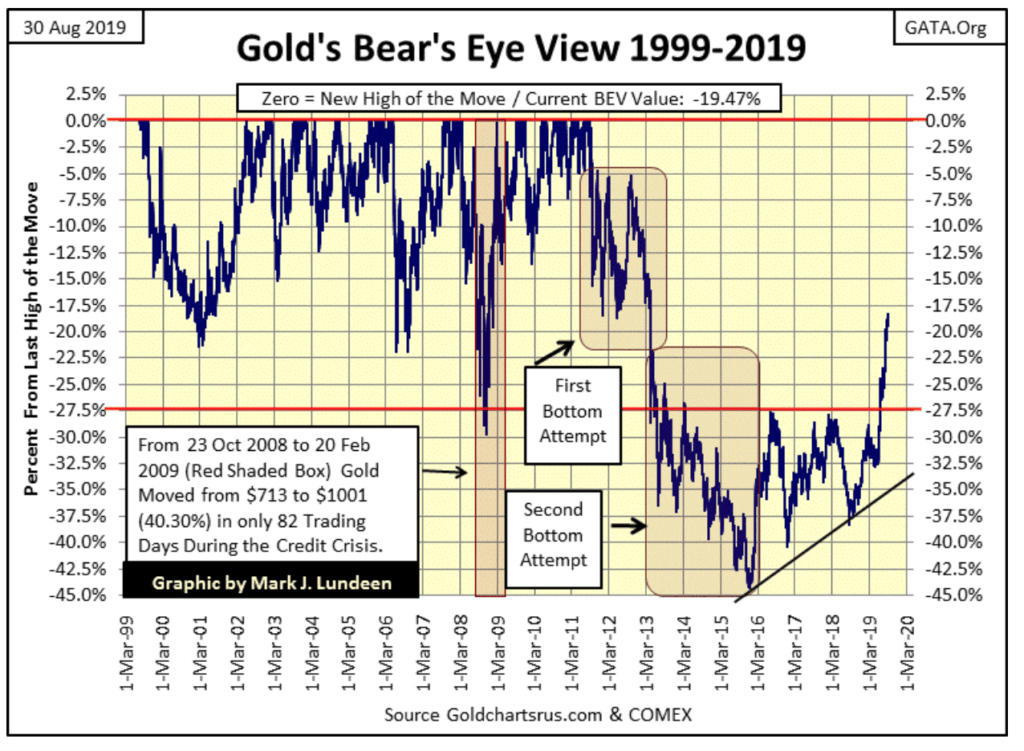
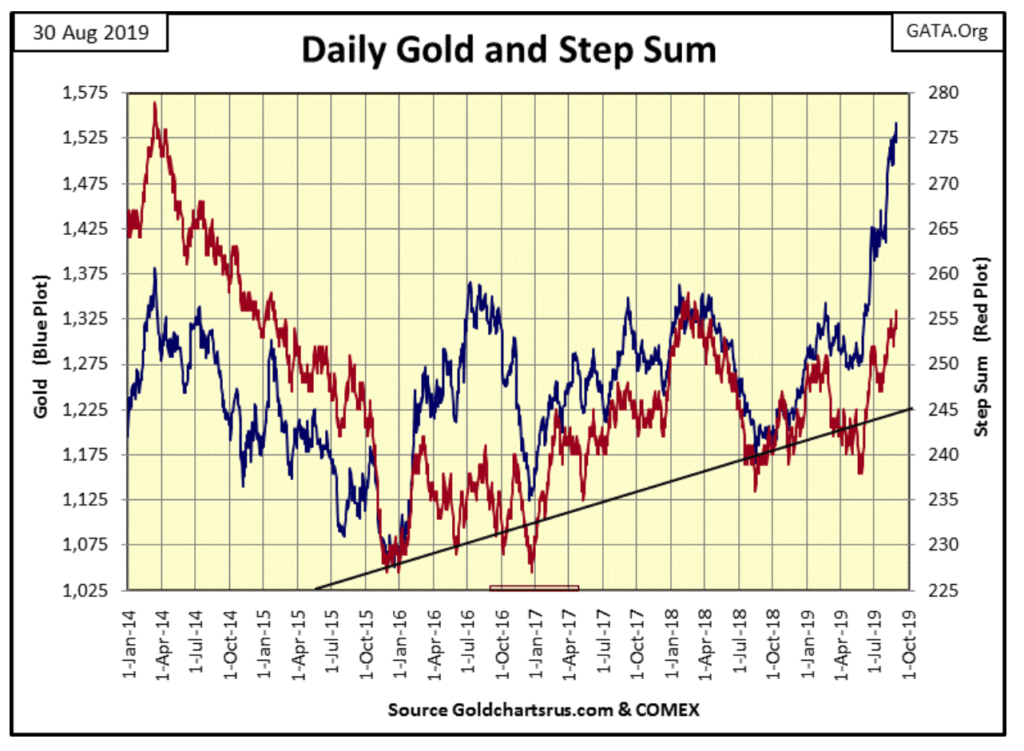
Unlike the stock market, something BIG is happening in the precious metals markets. The latest advance began in late May when gold lifted off its BEV -32.5% line ($1284) in the BEV chart below. Three months later, gold cleared its BEV -20% level ($1541).
That’s a big three-month move, and we’ve yet to see gold have a day of extreme volatility, a 3% move from a previous day’s close. Gold may not see a 3% day until the public once again moves into the gold and silver markets. When would that be? When gold is trading at much higher prices, somewhere above the BEV -10% line ($1700) in the chart below. That’s just speculation on my part, just as thinking when gold does see its day of extreme volatility, things could become wild in the financial markets.
Silver’s BEV
Next is silver’s BEV chart going back to 1969. Before January 1980, the BEV plot (Red Plot) and dollar plot (Blue Plot) are separate in this chart. But as silver’s last all-time high is still from forty years ago, its BEV and dollar plots can be overlaid, which I have done in the chart below.
It’s a nice feature to be able to see silver’s BEV value by looking over to its left scale, or its dollar value on its right scale from the same plot. This will continue to be the case until silver once again breaks above its current all-time high of January 1980, at which time these two plots will decouple from each other.
Silver’s last all-time high price was $48.70 seen on 17 January 1980. Silver closed this week at $18.30, or 62.43% below its last all-time high. The next key level for silver to clear is $20, or a BEV value of -59%.
This is actually a daunting journey to new all-time highs, if we were talking about anything else, but not so for silver. Look what silver did from January 2009 to May 2011; in a little more than two years, silver advanced from $9 (BEV -80%) to just pennies below its last all-time high of 1980 in late April 2011; a $40 (80% BEV) advance.
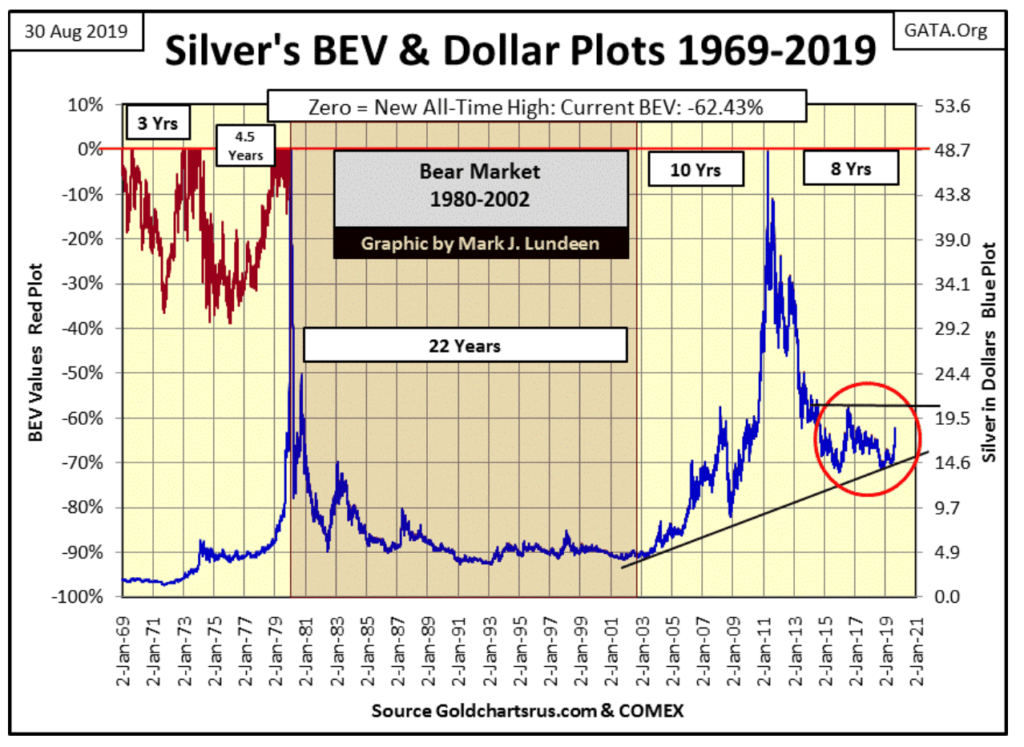
Look at where silver closed today in BEV terms (-62.43%).
Silver was at that level in July 2010. Just ten months later it closed the gap and came within pennies of breaking above its highs of January 1980 in late April 2011 ($48.58).
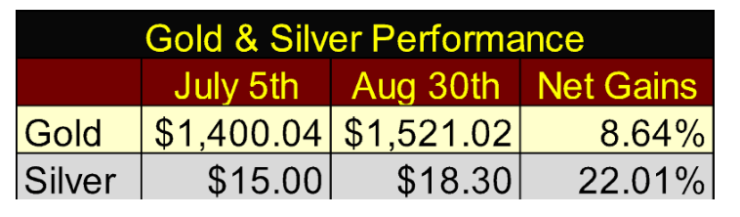
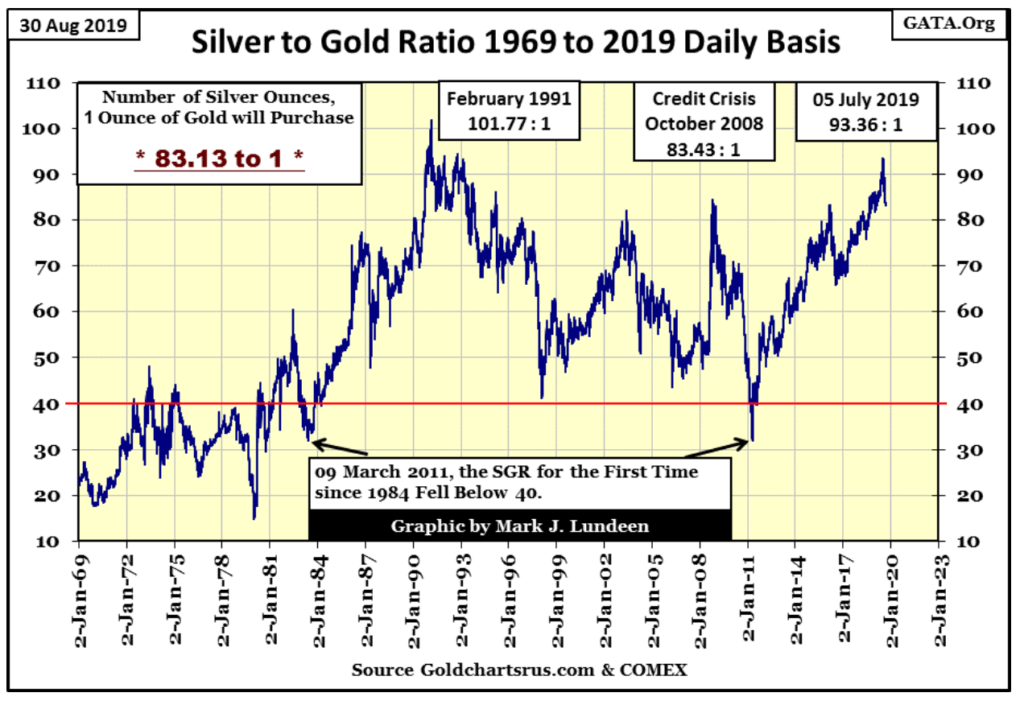
The Silver to Gold Ratio (SGR) has declined from 93.36 in early July to 83.13 at the close of the week. In other words, an ounce of gold now buys ten ounces of silver less than it did two months ago. To make this happen, silver had to appreciate 22% as gold advanced only 8.64%.
But this is what happens in a gold bull market: the big money is made in silver.
If the bull market in gold has resumed, and I believe it has, then the SGR in the chart below will decline as silver continues to outperform gold.
Gold and its step sum continue looking very constructive.
The Dow Jones and its step sum continue to be neutral, and will continue to be so until the Dow Jones makes up its mind what it’s going to do; break to the up or the downside. I’m thinking that whatever the Dow Jones itself does, sometime in the coming bear market we’re going to see a historic bear box as the public has been trained, for decades now, to buy on the dips, even the ones that are 54% below their last all-time highs.
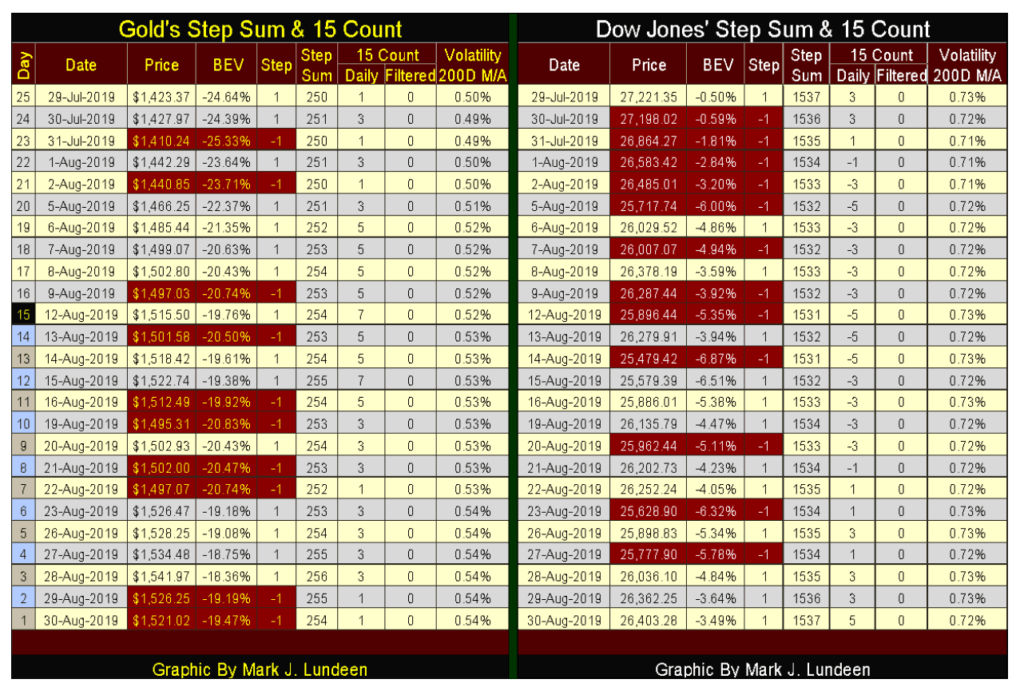
In their step sum tables, gold is looking better than the Dow Jones, if for no other reason than that in the past twenty-five days gold has advanced by 6.8% as the Dows Jones is down by 3%. Then gold’s step sum has advanced by four advancing days, while the Dow Jones finds it step sum where it was on July 29th at 1537.
Another thing I like about gold is its volatility is increasing; that’s a BIG PLUS for gold, while volatility for the Dow Jones remains around 0.73%, which is a good thing for the stock market.
Negative-yielding bonds
Negative-yielding bonds is an issue demanding even larger attention in the financial markets. What really bothers me about these bonds is that I’ve never heard of such a thing, couldn’t believe such a thing was even possible.
Alan Greenspan a few weeks ago had this to say about bonds yielding negative returns: “There is no barrier for U.S. Treasury yields going below zero. Zero has no meaning, besides being a certain level.”
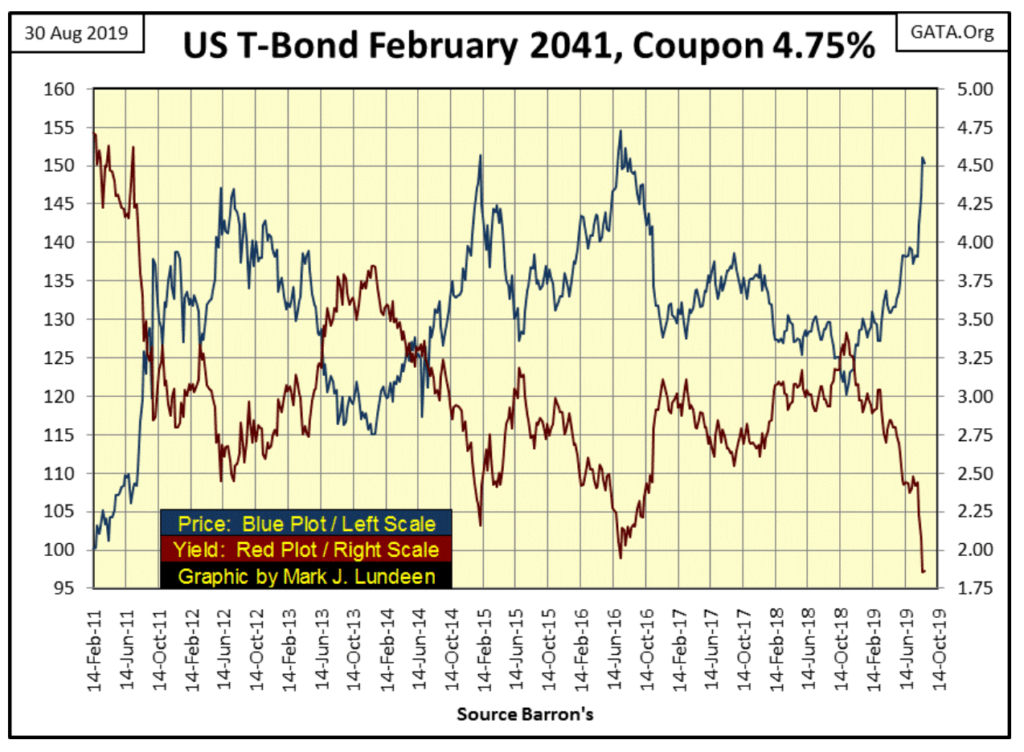
Here’s a 30Yr T-Bond issued in February 2011 with a coupon of 4.75%; meaning this $1000 bond (when issued) is a debt contract where $47.50 in interest per annum of its thirty-year term must be paid to its owner. Failure to do so results in the bankruptcy of its issuer, in this case, the US Treasury.
In the past eight years, this bond’s market price (Blue Plot below) and current yield (Red Plot) have changed considerably. In the summer of 2016, its price soared to $1550 as its current yield declined to below 2%. Still, no matter what prices this bond has traded at since February 2011, every year the US Treasury paid to the owner this bond exactly $47.50 in interest because this bond is what is called a “fixed income” financial instrument; aka a legal contract demanding the US Treasury to do so. As such this bond, or any bond that offers a coupon payment can’t become a negative-yielding bond unless its issuer commits a breach of contract.
This bond is a contract for debt whose terms cannot be unilaterally altered by one party of the contract, at least not yet anyway. To make this bond a “negative-yielding bond”, the US Treasury would first have to declare it will no longer pay its owner a coupon payment of $47.50 a year, but instead Zero dollars and No cents. The US Treasury then promises to clip a fixed annual amount (say $47.50) from the redemption value of the bond’s principle for the bond’s term. That is not going to happen with bonds currently trading in the T-bond market, or I hope not.
Let’s look at the mathematics of forcing a coupon paying bond down below Zero percent. The annual income generated by this bond makes it impossible for its yield to go negative; even if this bond’s valuation were to increase to $1 billion dollars. As seen in the table below, this bond would still be yielding a POSITIVE 4.75 micro percent.
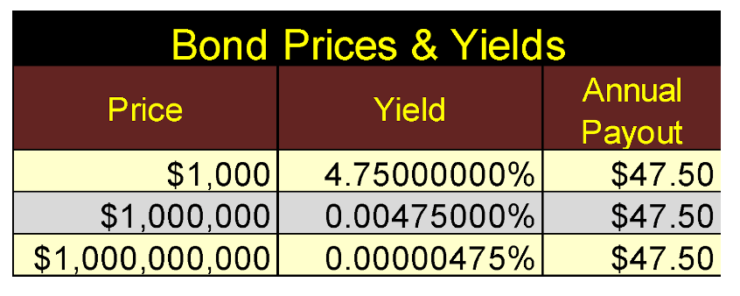
There is a barrier preventing U.S. Treasury yields from trading below zero percent; it’s called coupon payments.
The financial media gives the size of the bond market yielding negative rates as $16 trillion dollars and leaves it at that. I suspect what’s left unsaid is these $16 trillion dollars in bonds were, from their date-of-issue, created without an annual interest payout.
To create the fiction of a negative-yielding bond, these bonds’ issuers also included a principle claw-back clause at maturity. It’s either that or force the bond buyer to not only put up the cash to buy the bond but also require the bondholder to pay the bond issuer an annual payment.
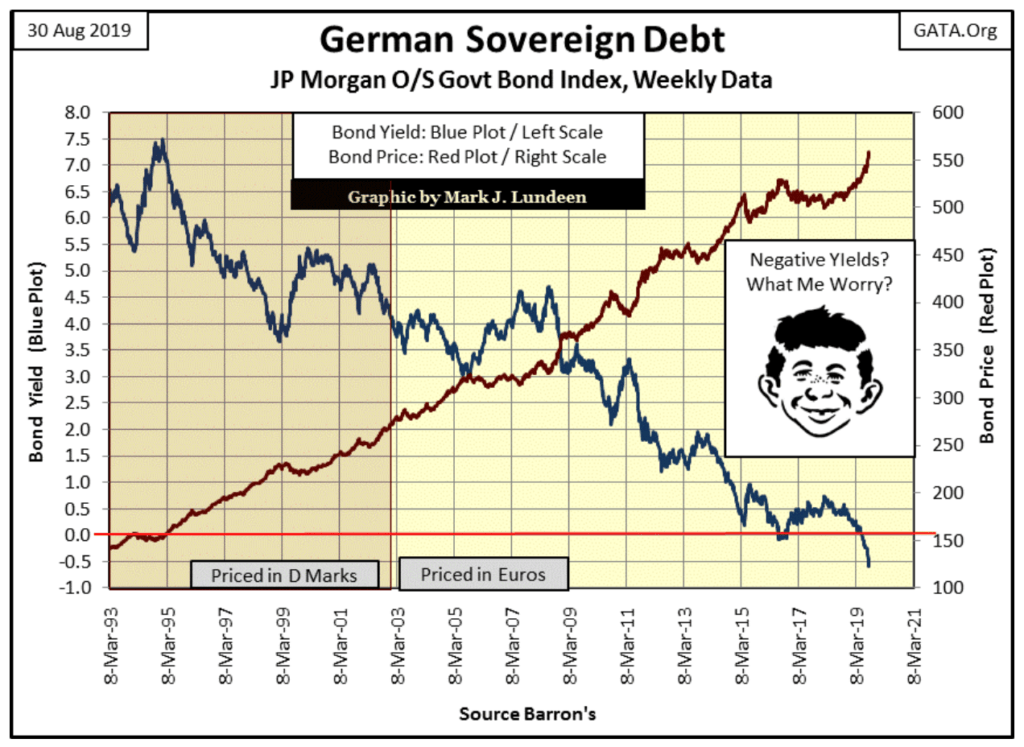
If this is true, then the German bond market has become bifurcated into two classes of bonds:
- Those that pay interest on principle, and will always have a positive yield
- Those that pay no interest on principle, and can never have a positive yield
The US Treasury bond market hasn’t yet seen any negative-yielding bonds. As the entire Treasury market now consists of bonds paying a coupon, the T-bonds issued so far can never see their yields go below 0% without triggering massive defaults as a result.
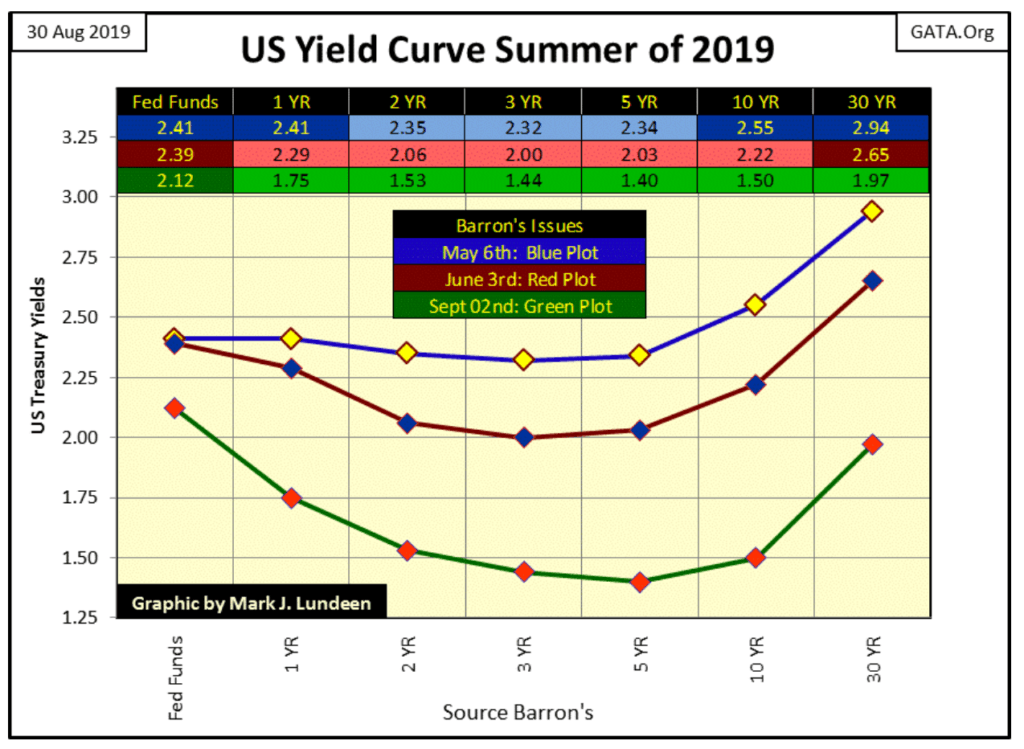
But negative-yielding bonds are having an impact on the US bond markets. Foreign fiduciaries that have lost the option of earning income in their domestic bond markets are now sending their capital to the US debt markets where they can still earn a positive return on investment funds.
How much of the current yield inversion in the US Treasury market is the result of capital flight fleeing the negative-yield nightmare now playing in Europe’s bond market?
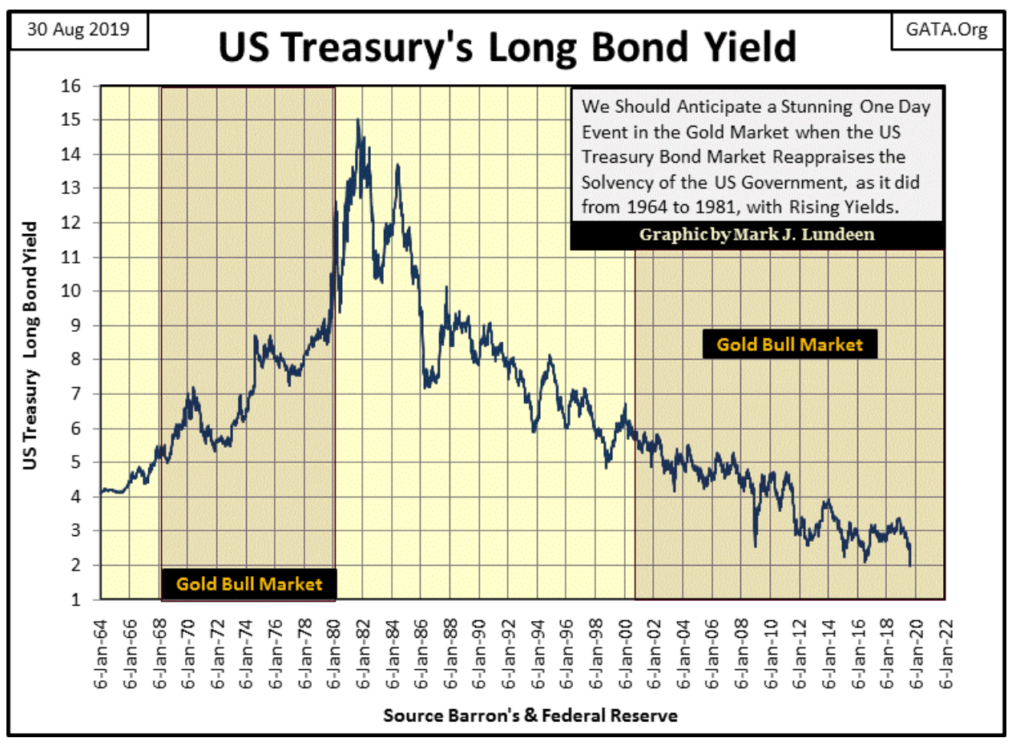
In the chart below plotting the US Treasury’s long bond yield, I never thought it would happen, but bond yields are once again breaking down to levels last seen in July 2016. And if the US Treasury decides to finance its operations by issuing bonds with negative yields, will bond yields ever again rise up to where they were before the 2007-09 credit crisis? Maybe, but I’m thinking most likely not.
So where can one go for income if not the bond market?
Good question. Whatever it is it should be as boring as a bond; something whose operation is relatively unaffected by the ups and downs economies are known to have. I’m thinking of dividend-paying utility stocks.
Below we see the Dow Jones Utilities (DJUA) yield (Blue Plot) and dividend payout (Red Plot) from 1929 to the close of this week; data for income seekers that is more important than the price of the DJUA. But like the Dow Jones Industrials, bear markets in the DJUA can be identified by dividend yields rising from 3% to much higher levels. Bull markets can be identified by dividend yields declining from high levels down to 3%.
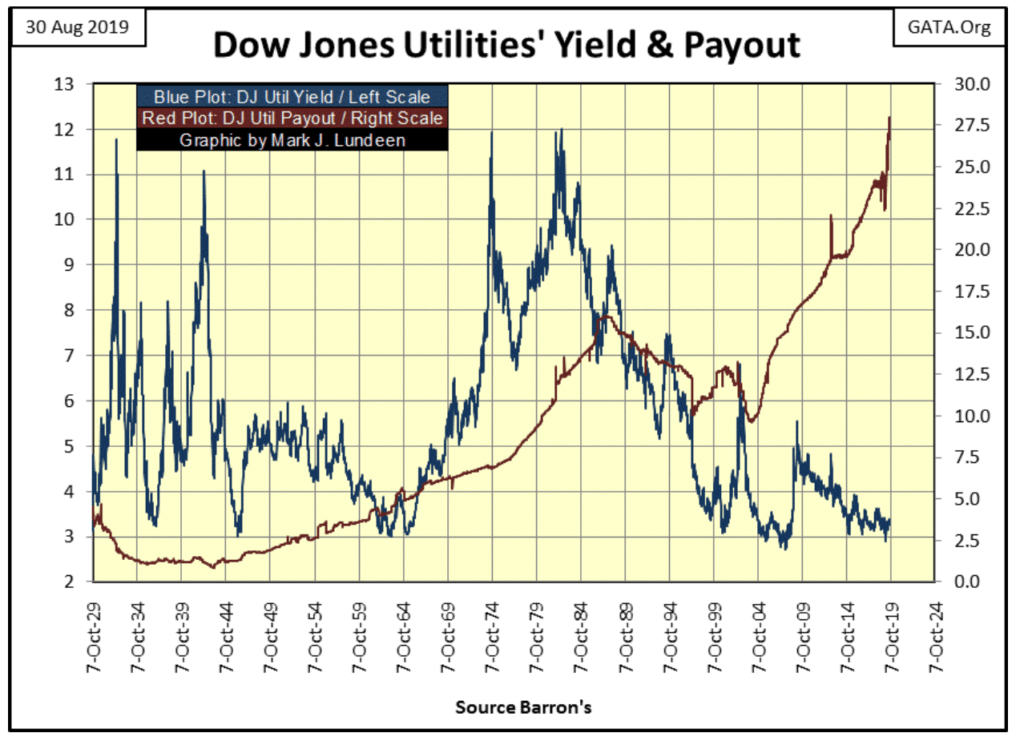
One very positive feature about investing in dividend-yielding utility stocks for income is that they are stocks. Unlike bonds, which are fixed-income investments, dividend payouts (Red Plot above) for utility stocks have increased in the past decades. They have also declined on occasions. During the Great Depression Crash, the DJUA’s dividend payout decreased by 41%.
One bad thing about investing in utilities today is with their yield now at 2.97%, a full percentage point above the US30Yr T-Bond yield of 1.97%, means that purchasing utility stocks in this market is buying them at a market top.
That can’t be helped, as except for gold and silver, everything in this market is at record valuations, which includes bonds. But for someone seeking income, for all bearish factors of buying utility stocks in late August 2019, I still believe they are much more attractive than seeking income in fixed-income investments like bonds.
Another possibility of earning income in the coming years is to invest in dividend-paying gold mining stocks.
Our world is a troubled one. Maybe negative-yielding bonds aren’t the worst thing to come along in the past decade.
(Featured image by DepositPhotos)
—
DISCLAIMER: This article expresses my own ideas and opinions. Any information I have shared are from sources that I believe to be reliable and accurate. I did not receive any financial compensation for writing this post, nor do I own any shares in any company I’ve mentioned. I encourage any reader to do their own diligent research first before making any investment decisions.


Graph Therapeutics Secures $5M to Advance AI-Driven Precision Therapies
Biotechnology company Graph Therapeutics raised 5 million dollars in a funding round led by Daphni, with support from existing investors....


DEA Hearing Signals Historic Turning Point for U.S. Cannabis Policy
The DEA has begun a key hearing on reclassifying cannabis from Schedule I to Schedule III, following a recommendation from...


Italy Leads Europe in Digital Sustainability Reporting for SMEs, EFRAG Finds
Italy leads Europe in digital sustainability reporting tools for SMEs, according to EFRAG’s second mapping of VSME platforms. The ecosystem...

RLUSD Launch in Japan Amid XRP Price Decline and Uncertain Outlook
Ripple and SBI launched the RLUSD stablecoin in Japan after JFSA approval, signaling strong progress in tokenization. However, XRP fell...


Youth Cannabis Use in Colorado Is Falling — But the Full Story Is More Complex
The 2026 Colorado survey shows teen cannabis use fell to 10 percent in 2025, down from 21 percent in 2015....
 |
|
 |  |
 |
|
-

 Impact Investing2 weeks ago
Edison Accelerates Renewable Growth and ESG Impact in 2025
-
 Africa2 days ago
Morocco’s Growth Holds at 4.6% as Agriculture Offsets Economic Pressures
-

 Cannabis1 week ago
Spain Cannabis Laws: Private Use, Fines, and Grey Areas
-
 Business4 days ago
Dow Jones Near Highs Signals Strength Until Volatility Returns