Featured
Several new market highs set this week amid North Korea-US heated exchange
The escalating tensions between U.S. and North Korea echoed in the financial markets.

The verbal spat between North Korea and America has wide-ranging effect in other areas of the economy.
Weekly Update
It is the Kim and Donald show. As in Kim Jong Un the North Korean Supreme Leader, and Donald Trump the US President. Donald Trump threatened to “totally destroy” North Korea and made fun of Kim as the “Rocket Man.” Kim responded by calling Donald Trump a “mentally deranged U.S. dotard.” For those not in the know, a dotard is someone who is old, useless, and demented and also refers to someone who is lethargic and dull. The two have been exchanging colorful threats and insults back and forth now for some time. North Korea followed the latest one up by suggesting they might test a hydrogen bomb over the Pacific. Trump called Kim a “madman.”
If this were the WWE, we suppose this might pass as entertainment. Instead, these are two world leaders threatening to blow the world to smithereens. While the ongoing “tit for tat” threats passed back and forth between North Korea’s testing of missiles into the ocean and sometimes over Japan have at times negatively impacted markets, the markets now seem to be ignoring the two with their ongoing spat. Except it is difficult to ignore Donald Trump’s threats to destroy North Korea and then realizing that North Korea has the capability to do a lot of destruction as well.
Lost in the shuffle is that China, and to a lesser extent Russia, has said that if the US were to attack North Korea then they would have to get involved and support North Korea. Recall that during the Korean War 1950–53 the Americans had pushed deep into North Korea and appeared to be on the cusp of seizing the entire peninsula. China responded by sending in 500,000 troops to assist the North Koreans and they successfully pushed the Americans back to the DMZ zone where the war ended in a stalemate and armistice.
Also lost in the shuffle was the Fed meeting this past week. The Fed announced that they will be starting to cut its $4.5 trillion balance sheet starting in October. Initially, it will be $10 billion a month. Fed chair Janet Yellen said that it will be gradual and predictable. The Fed left interest rates unchanged at 1.25% to 1.50%; however, they expect to raise interest rates one more time this year, probably in December and then three hikes in 2018. The somewhat more hawkish tone sent interest rates slightly higher, steadied the stock markets that merely inched their way higher, caused the US$ to jump higher and gold sold off.
In a surprise admission, Fed Chair Janet Yellen said the Fed doesn’t really understand why inflation has remained low below its target. She did note the US could suffer some short-term damage from Hurricanes Harvey and Irma. Some economists are predicting that it could shave upwards of 1% off GDP and possibly even more. Finally, Janet Yellen admitted she has not met with Trump and she gave no hint as to whether she would be willing to stay on as Fed Chair once her current term is up in February 2018. Given the Trump administration’s extreme slowness in filling positions, leaving uncertainty over who will head the Fed is not a particularly wise idea. Markets hate uncertainty.
The most controversial part of the recent Fed announcement is that they will be unwinding the quantitative easing (QE) that was introduced after the crash of 2008 and the recession of 2007–2009. While it was credited with saving the financial system from a potentially bigger collapse, growth since that time has been well below average growth seen after previous recessions. The unemployment rate has come down considerably, but much of the job creation has taken place in part-time low-paying jobs.
Simply put, the unwinding of the QE portfolio is as unprecedented as the QE programme that preceded it. The Fed clearly believes they can now afford to roll off the portfolio albeit at a controlled predictable pace. But is it really a good idea? The Fed’s balance sheet ballooned from $800 billion in 2008 to $4.5 trillion. Economic growth recovered but it has been consistently anemic. They also dropped interest rates to zero but now they are hiking them once again. With the current Fed rate at 1–1.25% and proposed hikes in December and three more in 2018, the Fed rate could be 1% higher by the end of 2018. Unemployment fell but the US (and Canada) became havens for part-time workers. The stock market soared with many saying that instead of QE going into Main Street it went into Wall Street.
Unwinding the QE program could put further upward pressure on interest rates, particularly at the long end of the curve. There could be other unintended consequences as well and many believe that Janet Yellen is being overly optimistic. This is especially the case as many have correctly noted that the US has now gone seven years with no recession. Odds favor one over the next few years. There could be further unexpected consequences from the hurricanes and even the California wildfires. A political crisis or war could also disrupt plans.
On the war front, we have learned that Japan has moved missile batteries into the North Korean missile flight path and China has moved troops to the North Korean border. Tensions amongst the global powers are at the highest they have been in decades. China has made it clear they would not tolerate a western invasion or attack on North Korea. Despite sanctions, Russia has been helping North Korea circumvent them.
North Korea is not the only front for a potential clash of world powers. In Syria, both US-backed forces of the Syrian Democratic Forces (SDF) and the Syrian army (SAA) backed by Russia are now in close proximity to each other, vying for the same territory in Deir Ezzor that includes the Syrian oil fields. After taking out ISIS, apparently, the SAA and SDF have already clashed. Russia has also warned they will strike back if the SDF persists. The Syrian front is a cauldron of potential clashes with the SDF, US, Kurds, and Israel on one side and the SAA, Russia, Hezbollah, and Iranian forces on the other.
And the tensions are not limited to just the global powers. Societies have fragmented and have become highly polarized. In the US and even in the EU protests, demonstrations and clashes between different sides and/or police have become commonplace. Like the 1930s, ours is a world slowly coming apart at the seams.
Stock market valuations are at or near record levels and earnings have been outstripping nominal growth although much of the earnings growth has come from large global players whose primary earnings are overseas. Nonetheless, the markets are at or near levels seen in 2000 and 2007 before those tops. There are signs that the Chinese debt market is at or near its stretch point. S&P recently downgraded China to A+ from AA-. Overall, global debt has outpaced global growth since 2009 and today, it stands at around $230 trillion.
What all these need is a trigger. While unwinding the Fed’s balance sheet would most likely not be a trigger in and of itself, it may be another factor that helps tip the scales. Meanwhile, back to the Kim and Donald show. We hope that they keep it at the entertainment level and not move to real war. That would be madness.
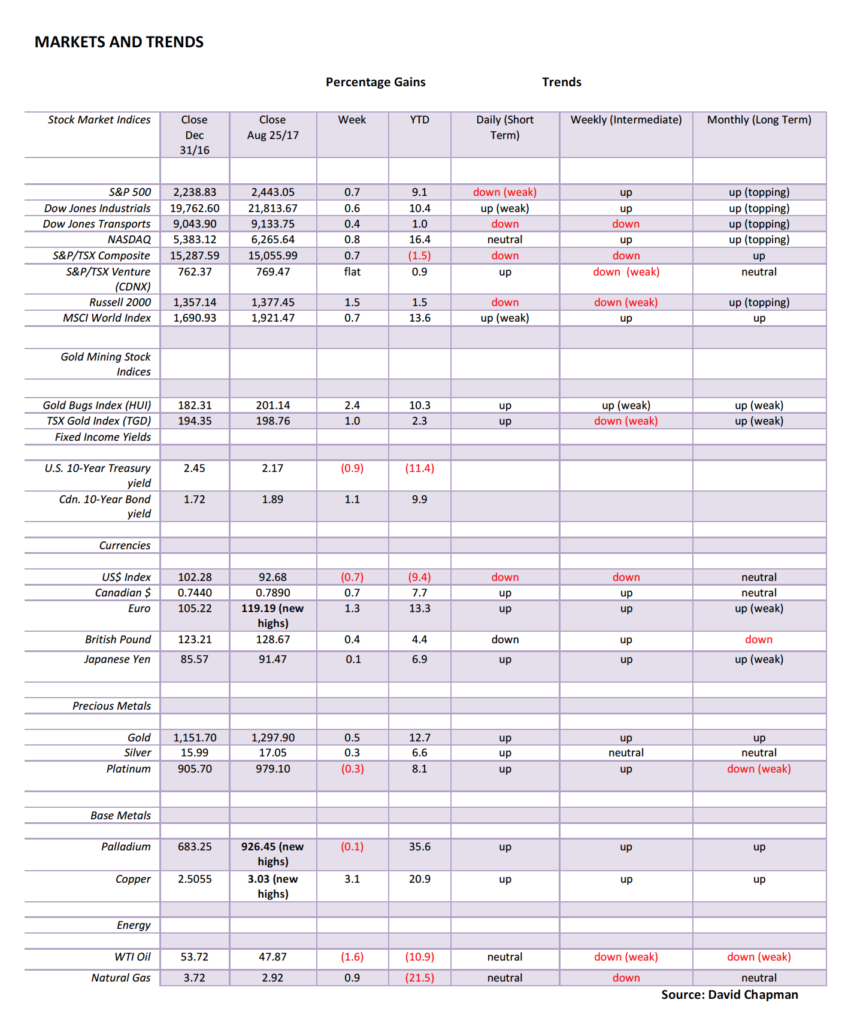
Markets and Trends © David Chapman
Note: For an explanation of the trends, see the glossary at the end of this article. New highs refer to new 52-week highs.
© David Chapman
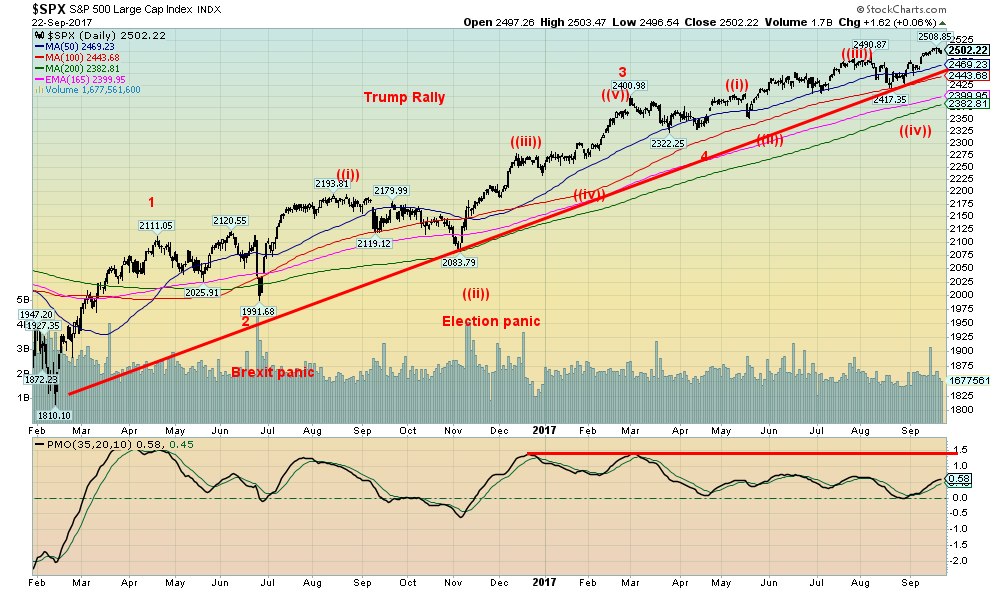
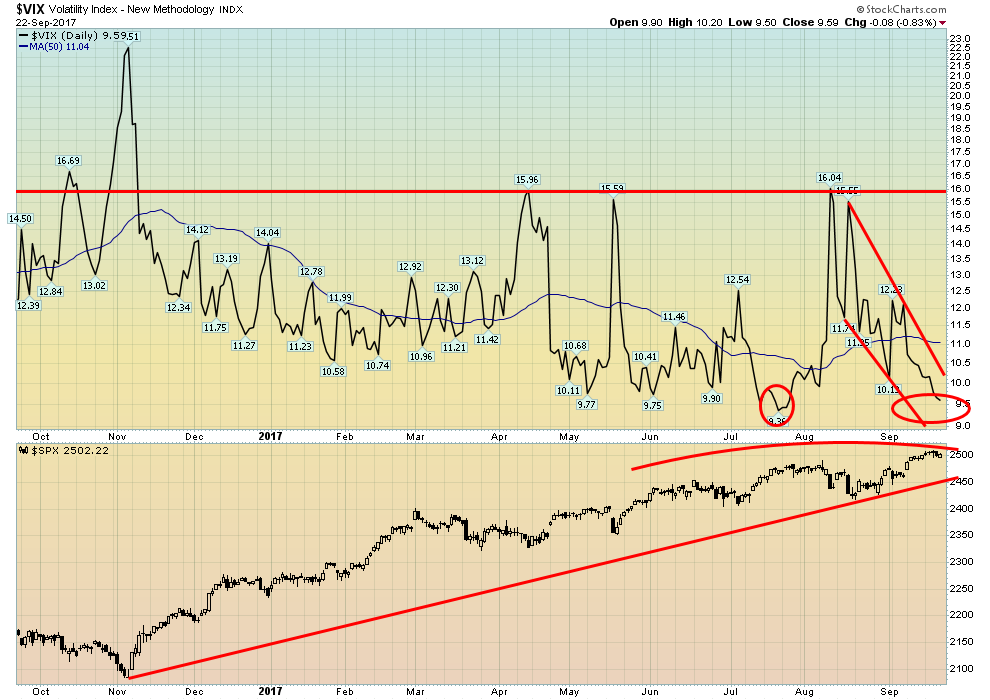
The NASDAQ joined the new highs crowd this past week, leaving only the Dow Jones Transportation (see below) as the only one that has not made a new all-time high during the most recent up move. But interestingly enough the NASDAQ then reversed and closed lower on the week. Our chart of the S&P 500 again shows the unfolding pattern of what we believe is the 5th and final wave up from the 2009 major low. The key corrections were the 2011 EU Greek crisis and the 2015/2016 tapering crisis. Those were waves 2 and 4 of the five-wave advance from 2009. If the above is correct then we could soon start a more serious corrective wave to the downside. Note how momentum has been falling as the market moved higher throughout 2017.
A break now under 2490 (a previous high) would be the first sign of some possible trouble. The 50-day MA is at 2470 so that would be the next line of defense. The uptrend line from the February 2016 low comes in now around 2,455. So a firm break under 2,450 could signal the end of the bull. The other points would be the August 2017 low of 2,417 and the 200-day MA currently near 2,380. So those are points to keep in mind if the market starts a pullback.
Still, we won’t argue that the market could still move higher. Interestingly the market in 2000 made a secondary top in September while the 2007 bull made its final top in early October. Both were the final top before the dot.com collapse and the financial crisis collapse got underway. That we are potentially making a high once again in September (and maybe stretching into October) is, we believe, no accident. The most famous high of all was September 3, 1929.
We’ll reserve final judgment on this bull until we break key points. If the market does move higher, then some of the points would need to be adjusted to reflect the reality of the changes. But overall now we believe we are late in the game.
© David Chapman
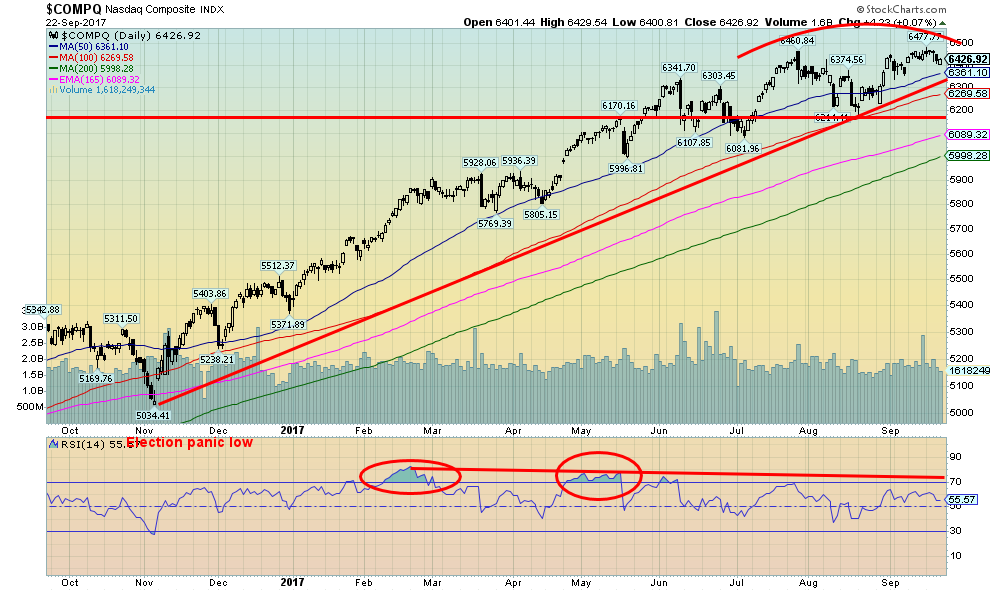
Here’s a closer look at the NASDAQ. The NASDAQ made new all-time highs this past week 6,477, then reversed and closed down on the week by 0.3%. Not what one would call a big reversal but nonetheless a reversal. Key, however, is does it follow through. New highs above 6,477 would negate that proposition. Note here how RSI has been continually declining since peaking last February.
In both February and May, the RSI climbed over 70 and while it stayed there for a while the NASDAQ eventually capitulated. Despite a series of new all-time highs, the NASDAQ has never again gone over 70. Volume has also been declining as the market moved higher. Currently, at 55, the RSI is neutral despite just coming off all-time highs. 6,360 marks one breakdown point but more important would be breakdown under 6,200. As with the S&P 500, we could still move higher but the market is slowly fading and with that, it risks a sudden breakdown.
© David Chapman
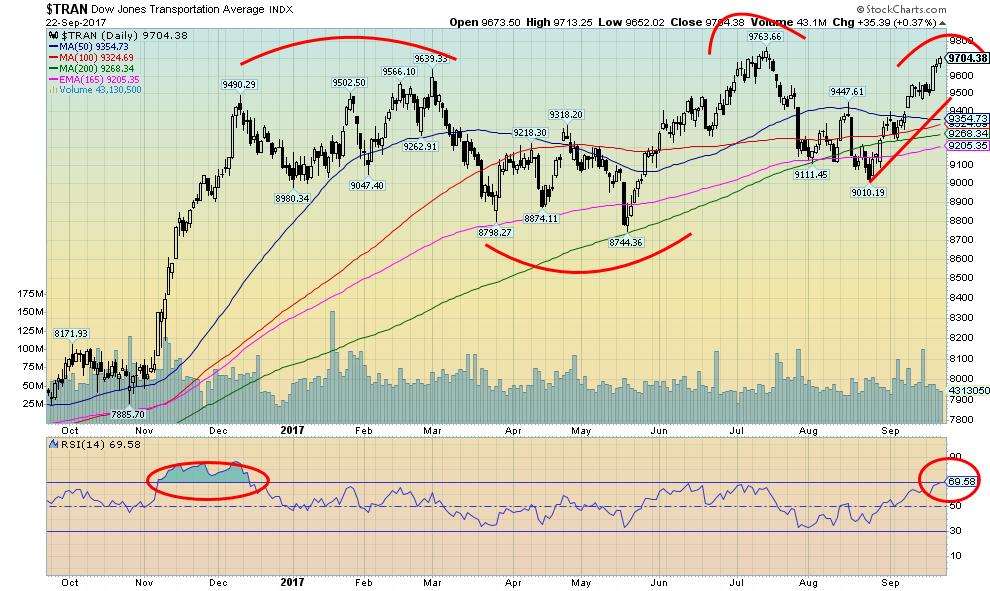
Could the Dow Jones Transportation (DJT) be making a key double top? The DJT had its biggest move following the election in November as it soared to a top in December 2016. Since then the DJT has moved in a sideways pattern. After gaining 1,600 points from late October to December 2016 or 20.3% since then the gain has been only 214 points or 2.2%.
The recent run-up from the August 2017 low has quickly brought the RSI back to 70 (although not quite over yet). The DJT is only 60 points from its previous all-time so it is possible to still to take it out and confirm with the DJI. A failure here, however, could suggest the potential double top has some legs and a breakdown under 9,010 could see a swift decline for the DJT towards 8,000. As with the other indices, we would be cautious here. A break of 9,500 would be a sign that a top is most likely in.
© David Chapman
Complacency is thy name. Once again, the VIX volatility indicator, a measure of fear and greed in the market, is rapidly approaching the all-time low seen in July at 9.36. The VIX is currently at 9.59, slightly higher even as the S&P 500 is higher in price (a divergence). This is, we believe, another hint that the market could soon be due for a tumble.
When the VIX moves higher, it does so rapidly because of a sharp down day. The day of reckoning is getting closer. Elliott Wave International noted that large speculators (hedge funds, managed futures, etc.) were now holding a record short position in VIX futures. This is interesting because the large speculators are usually spectacularly wrong at major tops and bottoms. Another warning sign that a sudden drop could be coming.
© David Chapman
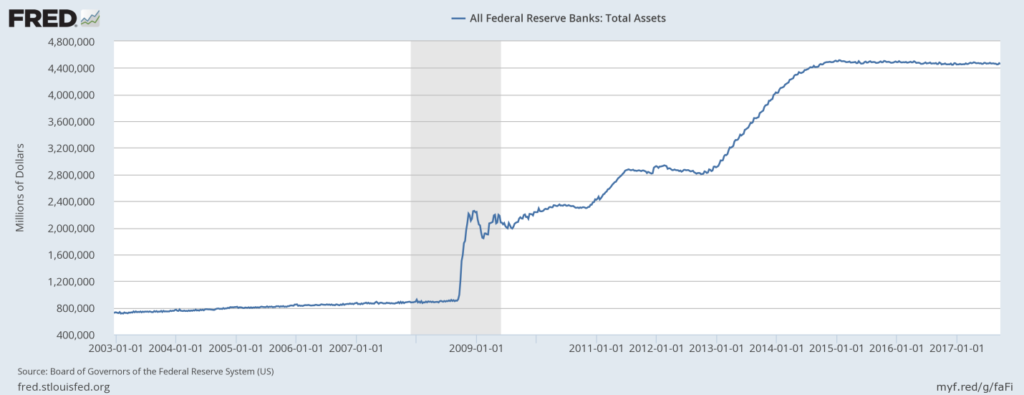
Here is the much talked about Fed balance sheet. This grew from about $900 billion in 2008 to $4.5 trillion today. As can be seen, once tapering got underway the balance sheet stopped growing. Naturally, the largest item on their balance sheet is US Treasury bill, notes, and bonds totaling roughly $2.5 trillion. The target for the roll-off would be the huge position in mortgage-backed securities totaling $1.8 trillion. The slowdown in the growth of the Fed`s balance sheet since 2015 corresponds nicely with slowing momentum in the growth of the stock market.
© David Chapman
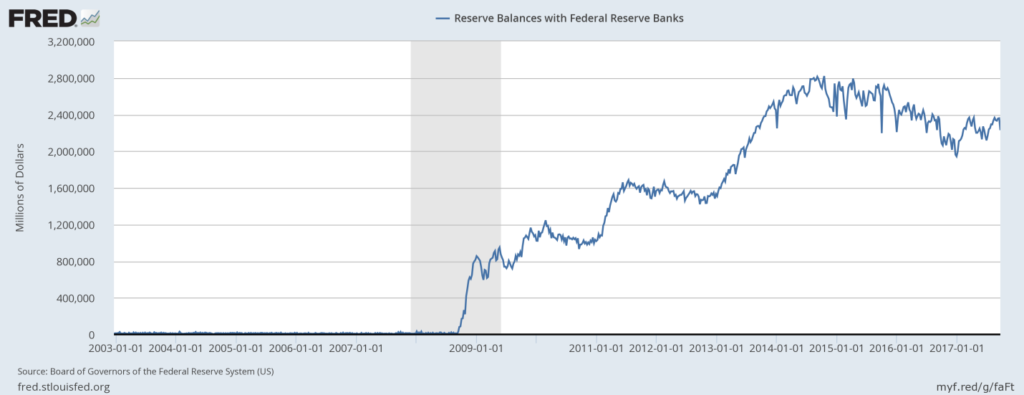
What is interesting is that the banks who sold the securities to the Fed for cash have for the most part held their funds back with the Fed in the form of interest-bearing reserve deposits. Currently, they total $2.2 trillion (these reserve balances would be on the liability side of the Fed`s balance sheet).
They grew from a mere $4.5 billion back in 2008. These funds were placed back on deposit and were not put into the broader economy as the Fed had expected. They are, however, down from their peak of $2.8 trillion. The question is the Fed`s unwinding of the balance sheet mean that it will be taking liquidity out of the market? The stock market has thrived for the past 8 years on huge amounts of surplus liquidity.
© David Chapman
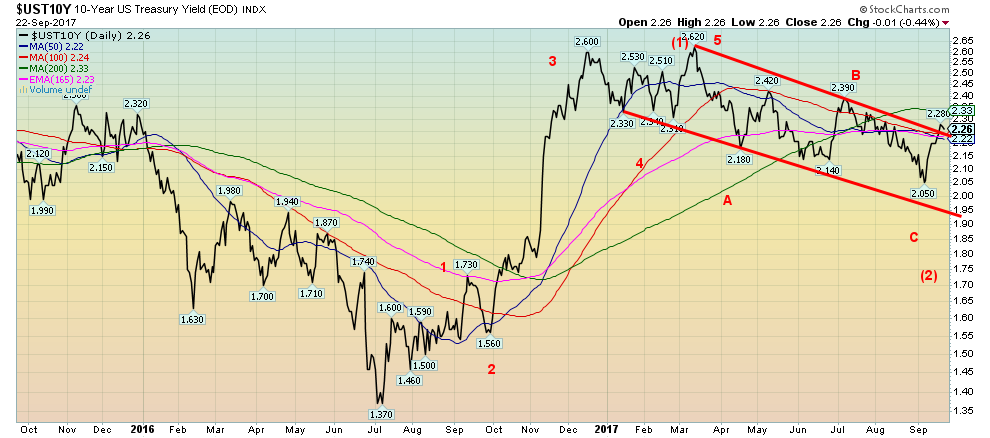
The yield on the 10-year US Treasury note appears to have broken out this past week. We would like to see a move and close above 2.33% to confirm the breakout. If this is correct, then the 10-year US Treasury note could be making a wave (3) to the upside (or it could be the C wave of a larger ABC pattern). Either way, a move to higher yields appears to be underway. The move should take the 10-year US Treasury note above 3%.
© David Chapman
Spread watch
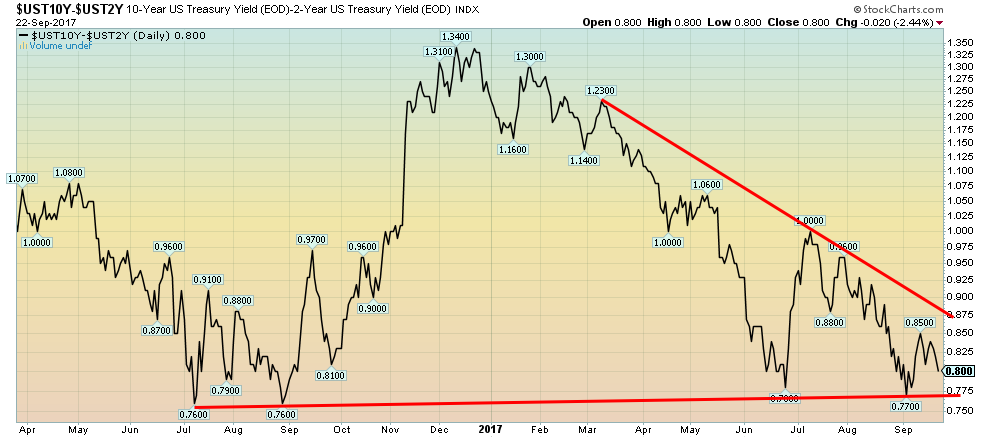
The 2–10 year spread narrowed this past week to 0.80% from 0.81% the previous week. The spread appears to be headed back down. Key is it has to break under 0.77% to suggest that it could move a lot lower. The pattern appears to be shaping up for a further decline. If the 2–10 spread once again goes negative as it did in 1999 and 2007 before important stock market and economy tops then odds would favor a recession fast approaching.
With the Fed hinting at one more rate hike in 2017 and 3 more in 2018, this has seen prices for short-dated maturities back off, more so than long-dated maturities. The yield on the 10-year US Treasury note rose to 2.26% from 2.20% this past week but the yield on the 2-year Treasury note jumped to 1.46% from 1.39%. The yield on the 2-year Treasury note has broken out and suggests a move to 1.62%.
© David Chapman
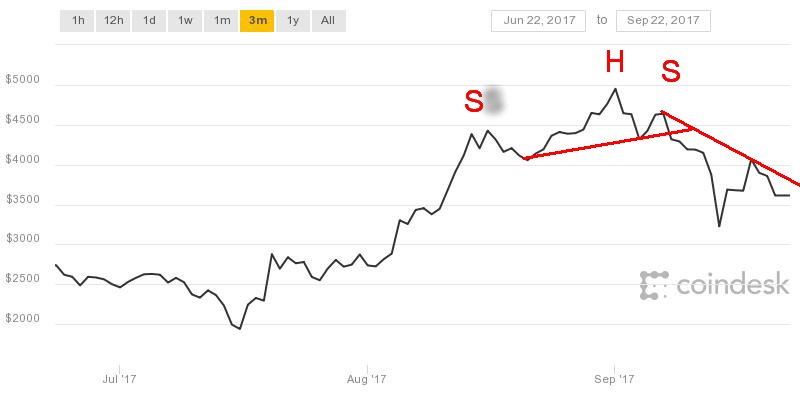
Bitcoin watch. Bitcoin has fallen from what appears to be a head-and-shoulders top pattern. Potential targets are down to $3,400. Bitcoin actually hit a low of $3,226 satisfying that target. But if Bitcoin were to break to new lows as the chart appears to suggest the next target would be $2,850. So far, it appears a classic failure following the breakdown is shaping up. Regaining back above $4,000 and closing firmly over that point would suggest that Bitcoin could be headed back to the highs near $5,000.
© David Chapman
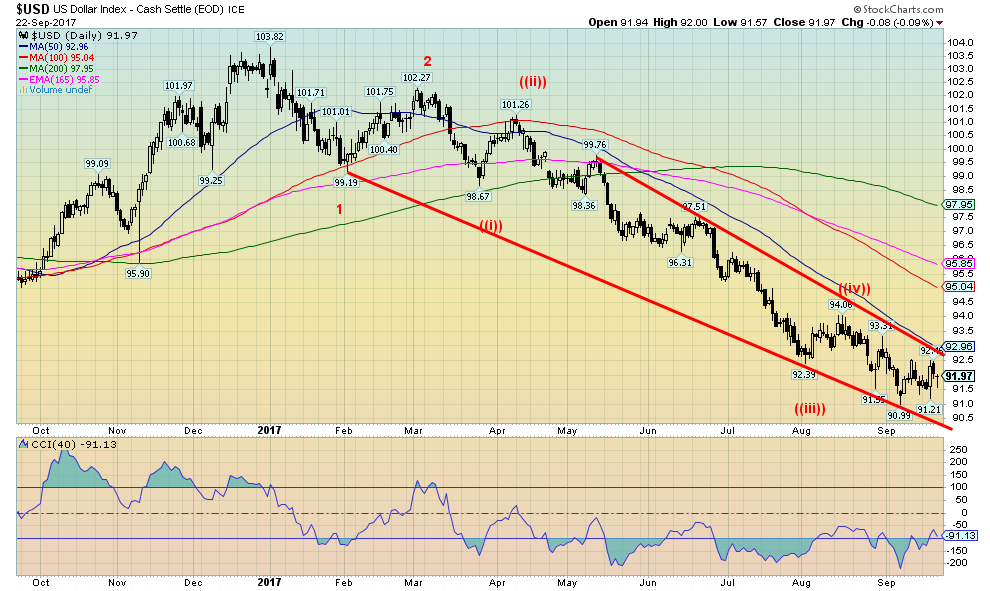
Despite making its low at 90.99 on 8 September 2017 the US$ Index has failed to make any serious headwind to the upside. It quickly failed near 92.50 and tumbled back down in an irregular manner. Still, it is possible the US$ Index has made wave ((v)) low. But to confirm, it needs to break over 93. Our targets were 91 to 91.10 and with a low of 90.99, the target proved to be prescient.
A firm break, however, under 91 could see the next major target at 88. The US$ is under attack from a number of corners. While the spat with North Korea may have sent some scurrying for cover with the Euro (and oddly even the Japanese Yen) one of its major areas of attack is coming from China and Russia. Russia announced that US$ will no longer be accepted at its ports. And China is hurrying towards a Chinese Yuan dominated the world in Asia and through the building of its “Silk Road.”
Russia and China already conduct trade in Yuan and Rubles. As well, Venezuela announced they will no longer accept US$ for their oil. Instead, the main currency will be the Euro but Yuan and Rubles could also be accepted. All of this puts downward pressure on the US$ and by extension, the US$ Index dominated as it is by the Euro, the prime beneficiary of those fleeing the US$.
While the US stock markets have done well since the election of Trump the US$ has mostly been on a downward path. The Fed hiking interest rates help but rebounds have typically been short-lived. At this stage there just isn’t enough evidence to suggest that the US$’s downward trend is over. Moving above 93 would support a more bullish stance but a breakdown under 91 would suggest the bears remain in firm control.
© David Chapman
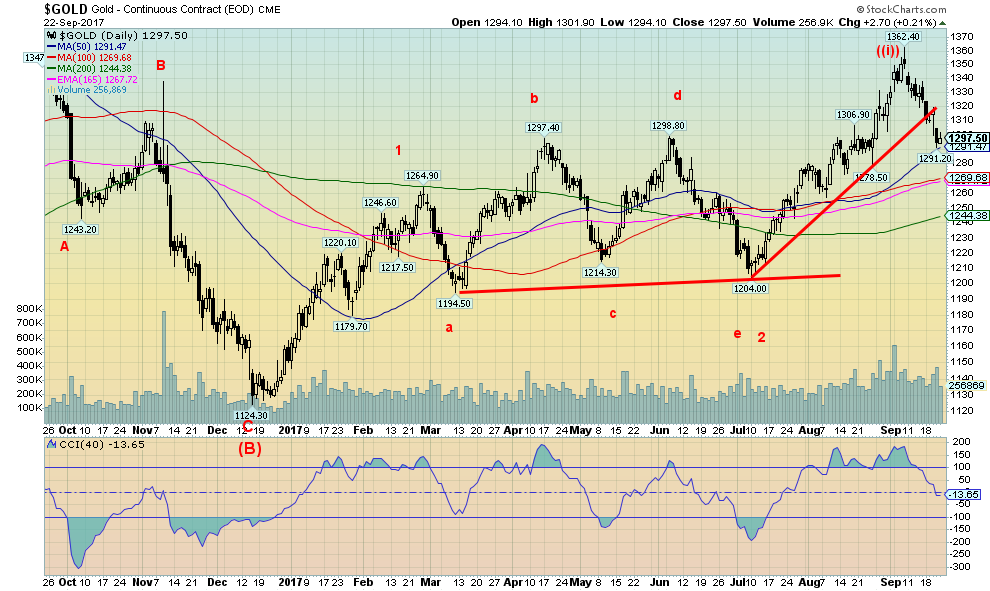
For the second week in a row, gold fell, this time losing 2.1%. Still gold remains up 12.7% on the year, outperforming the S&P 500 by a slight margin. As we note below, the commercials selling gold futures seem to have put the dent in gold`s upward movement. Gold has fallen to the 50-day MA an area that could provide support. Further support lies below down to $1,270.
We had noted that the last significant lows on the dailies were at $1,272 to $1,278 and a breakdown under that level could target gold down to $1,240. Gold seasonally can be strong into September or October. So a top in September is not unusual. The question now is how weak will the pullback be. The period October to December has not been friendly to gold over the past few years. This suggests that this corrective period could last into the latter part of November or early December before another strong up move gets underway.
There have been positives about gold recently. Russia has revealed that they have added another 15.6 metric tonnes of gold to their reserves. Both Russia and China have been buying gold to shore up their currencies the Ruble and the Yuan as they prepare to make them more readily available on a global basis alongside the US$, the Euro, the Japanese Yen and even the Canadian Dollar.
Russia is believed now to hold 1,745 metric tonnes of gold to China’s officially reported holdings of 1,842.6 metric tonnes. Many believe that China’s holdings are considerably higher as they have not updated their reserve holdings in over a year now. China has been on record as wanting to raise their reserves to around 8,000 metric tonnes putting them on par with the US who holds 8,133.5 metric tonnes.
Speaking of the US Steve Mnuchin recently visited Fort Knox, the first visit by the head of the US Treasury since 1948 and only the third ever. Some are speculating as to whether the US might do a revaluation of gold, a move that would help the US with its $20 trillion government debt. Gold has not been officially revalued upward since 1934 when President Franklin Roosevelt revalued gold to $35 from $20.67 a gain of almost 70%. Grant you, a period of confiscation of gold and gold certificates took place before the revaluation.
And it outlawed the private possession of gold (except for collectible gold). The move was meant to tackle the Great Depression and dis-inflation by immediately devaluing the US$ to help create more inflation. It worked as the US enjoyed a strong economic run until 1937. Interestingly, the revaluation of gold also created the Exchange Stabilization Fund, an arm of the US government that many call the “plunge protection team.”
Gold investment demand has perked up in the ETFs and gold as an asset class remains under-owned. All the gold in the world is only equal to about $7.3 trillion vs. roughly $65 trillion for stocks and $230 trillion for debt instruments.
We believe that the 10 July 2017 low represented the end of a complex corrective wave and the C wave or third wave to the upside is in the early stages of an advance. The top just above $1,360 might represent the end of wave 1 up while the current correction unfolding is wave 2 down. Gold may have a bit more downside here noting both the $1,270 are and the $1,240 area. To the upside, regaining above $1,300 would be positive but strong resistance remains up to around $1,320. Only above $1,340 does it suggest that the recent high at $1,362 could fall and then gold could challenge the July 2016 high of $1,377.
© David Chapman
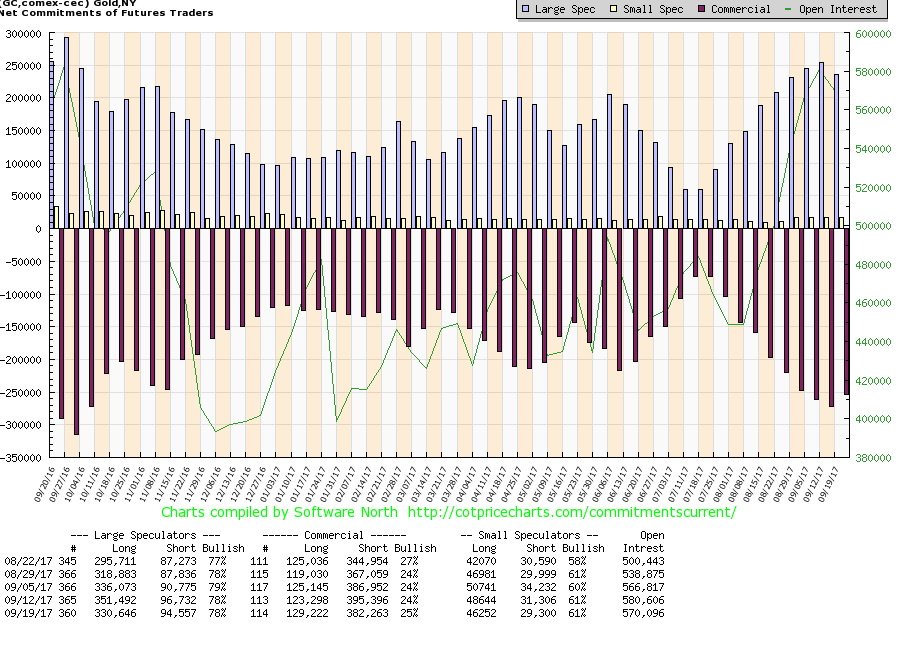
The commercial COT improved this week for the first time in ten weeks, rising to 25% from 24%. That is still not a signal that the bottom might be in but it is a positive development. The short open interest fell by roughly 13,000 contracts while long open interest rose for the first time week up roughly 6,000 contracts. The large speculators COT was unchanged at 78%, although the long open interest fell roughly 21,000 contracts while short open interest was only down about 2,000 contracts. The large speculators are still a bit long and we’d like to see that ratio lower before a final low might be in.
The silver commercial COT also improved slightly rising to 27% from 26% with short open interest down about 4,000 contracts and long open interest up about 2,000 contracts. In line with the falling market, the large speculators COT slipped to 76% from 79% this past week. They dropped long open interest by about 3,000 contracts while hiking short open interest up about 4,000 contracts. The commercials and the large speculators are acting true to form. We’ll see if the commercial COT improves further when this week’s numbers are released on Friday, 29 September 2017.
© David Chapman
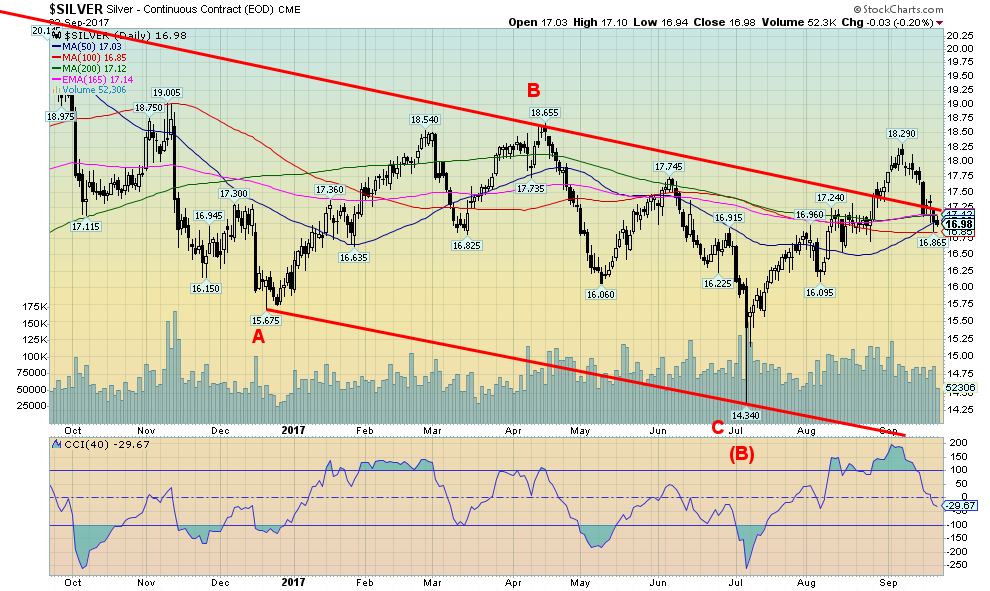
Silver, like gold, has been weak of late, falling for the 2nd week in a row and this time losing 4.1%. Silver remains up 6.2% for 2017 grossly underperforming the gold price. Like gold, we believe silver is starting a new wave to the upside and that this is the first significant correction. There is strong support in the $16.80 to $17 zone but below $16.80 silver could fall towards $16. Resistance is in the $17.50 to $17.60 zone and we would be surprised by any bounce to see silver break above that level. As we show below silver remains cheap when compared to gold.
© David Chapman
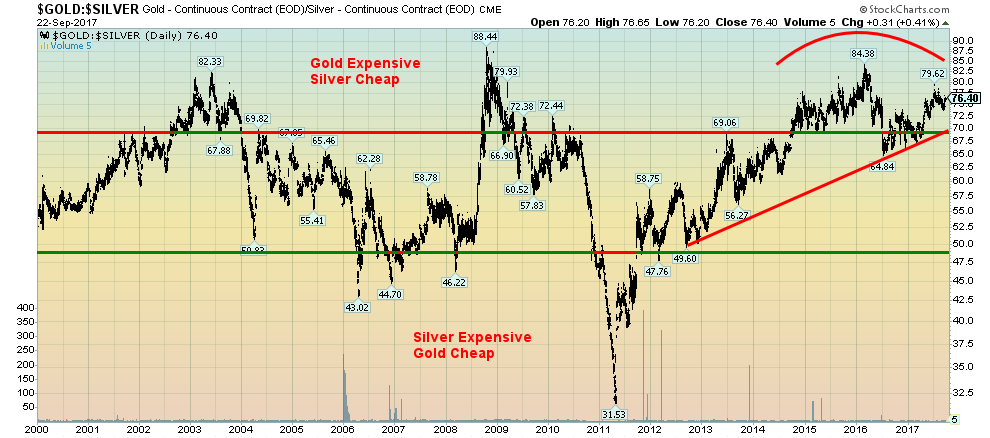
Silver has been quite cheap in relation to gold now for some time—three years to be exact. The good news is that the gold: silver ratio appears to be tracing out a large topping pattern. The ratio needs to break back under 70 and under the neckline of the pattern currently near 65. Targets could be down to a gold: silver ratio of 50. Despite the frustration with silver the pattern developing still suggests that holding silver over gold could still pay dividends going forward.
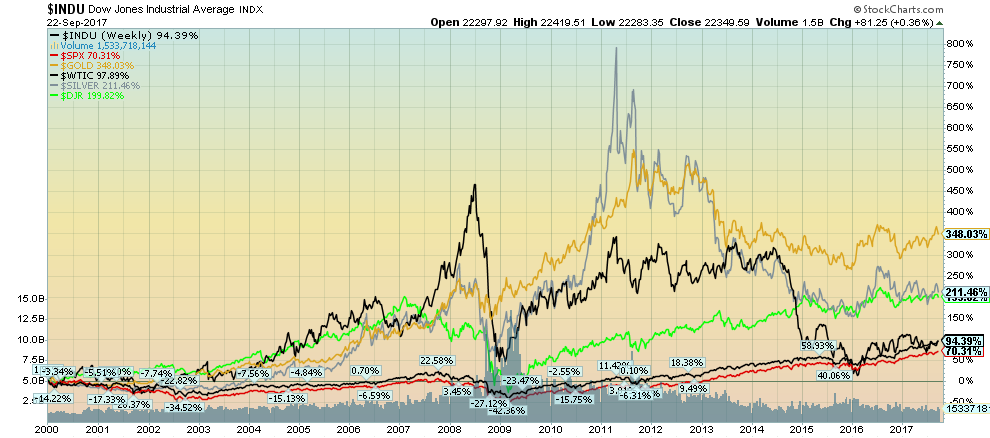
The year 2000 proved to be quite pivotal. It marked a major top for the stock indices and a major low for the precious metals (gold and silver). First, came the dot.com crash of 2000–2002 to be followed by the financial crisis crash and recession 2007–2009 that required the entire financial system to be bailed out. Precious metals, that had been through a long, painful bear market from 1980–2001 (punctuated with a few strong counter-trend rallies) came to life and enjoyed a strong run until 2011 with only the financial crisis crash providing a significant blemish along the way.
The result has seen gold as the best performing asset since 2000, up 348%. And silver has not been a slouch either, up 211%. Still, it lags behind gold when it should be leading gold. As for the major indices, their performance has been enhanced somewhat by the run-up since 2009. Overall, it is not overly impressive. The DJI is up 94% while the S&P 500 has gained only 70%. A big winner has been the Dow Jones REIT sub-index gaining 199%.
An interesting side comment is gold has also been an outstanding performer since Richard Nixon took the world off the gold standard back in August 1970. Gold has gained over 3,600%. The DJI’s gain, on the other hand, has been slightly lower at 2,800% (without the impact of dividends). Gold has proven over a long period the ability to maintain its value and remains today a counter to owning stocks.
© David Chapman
© David Chapman
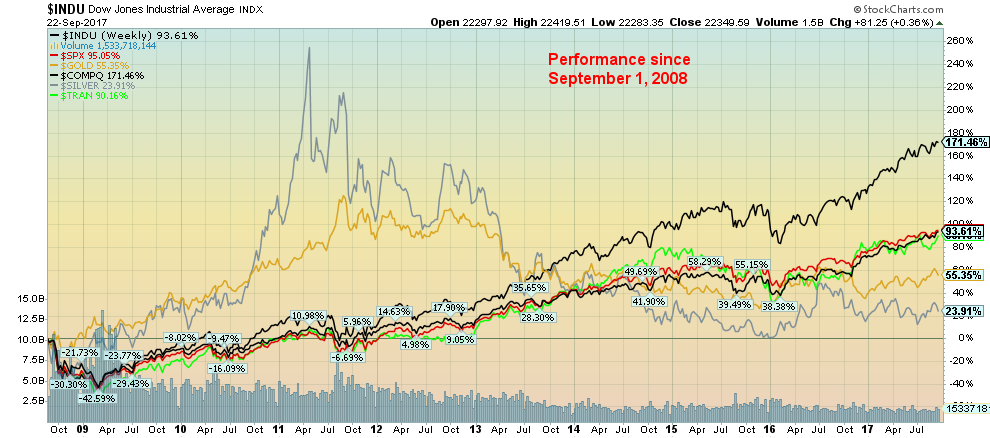
While gold has been the best performer since 2000 it hasn’t fared as well since the financial crisis of 2008. Following an initial strong performance, gold (and silver) topped out in 2011. Since then the gold bugs have had to endure a painful 6-year bear market that is not yet over. Still, since September 2008 gold has gained 55% even as most of that was made in the run-up into 2011. Silver has been a relative laggard, up only 24%. The faraway leader has been the NASDAQ with a 171%, followed the S&P 500 up 95%, and the DJI up 94%.
© David Chapman
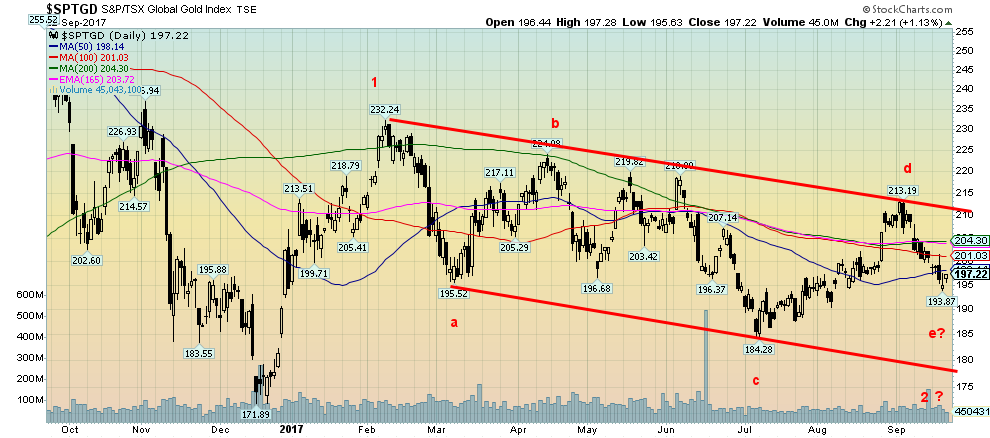
We have been trying to figure out just where the gold stocks are. We know that historically gold stocks are currently super-cheap to the gold price. But as the chart demonstrates, since making a top back in February 2017 the gold stocks have just been downright frustrating, moving back and forth in a directionless pattern. Our best interpretation at this time is the S&P TSX Gold Index (TGD) has been tracing out a 5-point abcde type pattern. Long and frustrating. But there may be light at the end of the tunnel.
If we are correct, the TGD is currently trying to complete its e wave to the downside. The wave could, however, extend to the bottom of the channel near 180. On the other hand, an e wave is often the shortest of the waves. That is something to keep in mind. The TGD is trying to find support at the weak 50-day MA having failed to hold the 100 and 200 day MAs. A break of 190 puts the potential 180 target in play. To the upside, regaining over 200 and then 205 would be positive. But the major breakout line is seen up at 210.
© David Chapman
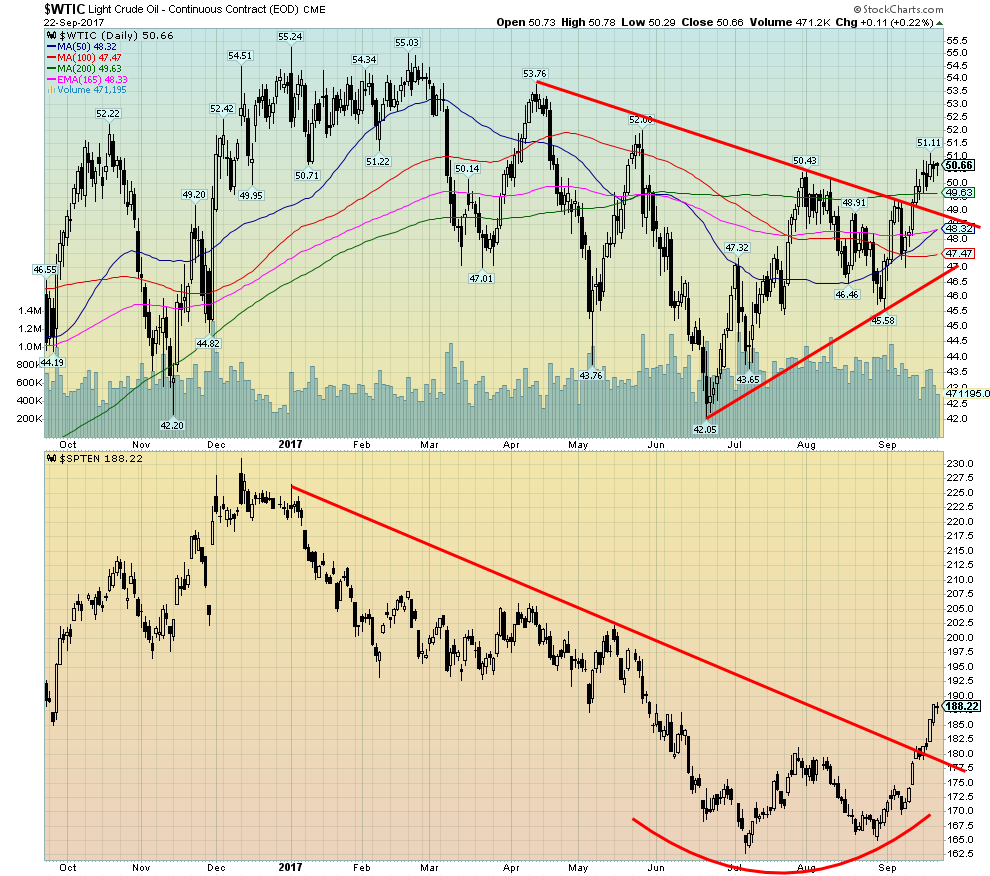
WTI Oil broke a downtrend and so did the S&P TSX Energy Index (TEN). The TEN put in a nice double bottom and has broken firmly above the neckline and the downtrend line. Minimum targets for the TEN appear to 193. But a firm break above that level could target up to 205. As for WTI oil, the target appears to be up to $60. One note of caution, however, is that the September to November period seasonally tends to be weak for oil and oil stocks. Could oil and the oil stocks be going against the seasonals?
GLOSSARY
Trends
Daily – Short-term trend (For swing traders)
Weekly – Intermediate-term trend (For long-term trend followers)
Monthly – Long-term secular trend (For long-term trend followers)
Up – The trend is up.
Down – The trend is down
Neutral – Indicators are mostly neutral. A trend change might be in the offing.
Weak – The trend is still up or down but it is weakening. It is also a sign that the trend might change.
Topping – Indicators are suggesting that while the trend remains up there are considerable signs that suggest that the market is topping.
Bottoming – Indicators are suggesting that while the trend is down there are considerable signs that suggest that the market is bottoming.
(All charts are courtesy of Stock Charts and COT Price Charts.)
__
DISCLAIMER: David Chapman is not a registered advisory service and is not an exempt market dealer (EMD). We do not and cannot give individualized market advice. The information in this article is intended only for informational and educational purposes. It should not be considered a solicitation of an offer or sale of any security. The reader assumes all risk when trading in securities and David Chapman advises consulting a licensed professional financial advisor before proceeding with any trade or idea presented in this article. We share our ideas and opinions for informational and educational purposes only and expect the reader to perform due diligence before considering a position in any security. That includes consulting with your own licensed professional financial advisor.


Youth Cannabis Use in Colorado Is Falling — But the Full Story Is More Complex
The 2026 Colorado survey shows teen cannabis use fell to 10 percent in 2025, down from 21 percent in 2015....


Morocco’s Growth Holds at 4.6% as Agriculture Offsets Economic Pressures
Morocco’s economy grew 4.6% in Q1 2026, driven by a strong agricultural rebound offsetting declines in industry. Services expanded moderately...


Abivax Shares Surge as New Trial Data Eases Safety Concerns Over Ulcerative Colitis Drug
Abivax shares surged nearly 36% after positive updated trial results for its ulcerative colitis drug obefazimod reassured investors following earlier...


El Dorado Raises $9M to Expand Cross-Border Fintech Platform
El Dorado, a Latin American fintech improving cross-border financial services, raised a $9 million Series A led by Paradigm with...


Bitcoin Stalls Near $60K as Strategy Moves, ETFs Outflow, and EU MiCA Rules Take Effect
Bitcoin hovers near $60,000 with ETF outflows, while Strategy boosts reserves, sells BTC, and raises dividends to reassure investors. Ethereum...
 |
|
 |  |
 |
|
-

 Crypto5 days ago
Bitcoin and Ethereum Slide as Market Pressure Builds Amid Strategy Concerns and Layer 2 Disruptions
-
 Business2 weeks ago
Fed Policy Shift Raises Concerns Over Debt and Inflation Risks
-
 Crypto1 day ago
Bitcoin Stalls Near $60K as Strategy Moves, ETFs Outflow, and EU MiCA Rules Take Effect
-

 Biotech1 week ago
Galicia Launches €805M Biotechnology Strategy to Drive Innovation and Competitiveness (2026–2030)
You must be logged in to post a comment Login