Markets
Oil prices fell under $45, gold and gold stocks followed the same trend
Oil prices dropped under $45 and gold and gold stocks withered as well. The major stock markets may have been rather boring this past week but not elsewhere, it seems.

The markets appear to be trying to bore us to death. The S&P 500 eked out a tiny 0.06% gain this past week, which means in rounding terms a 0.1% gain. The MSCI World Index fared worse, eking out a tinier 0.04% gain. That qualifies as flat on the week. Arguably, maybe the excitement was with the Dow Jones Industrials (DJI) up 0.5% on the week to another record high. Trouble was nobody else joined the party so it was a lonely walk for the senior index. And, a walk was about all one could say about the week or maybe it was a very casual stroll.
We would love to say that Amazon (AMZN-NASDAQ), the $466 billion behemoth, who stunned everyone by taking out Whole Foods Market (WFM-NASDAQ) in a $13.7 billion deal, led the DJI except Amazon is not a part of the DJI index. Whole Foods, whose market cap was valued at $12.7 billion before the deal, soared almost 10%. So did Amazon—jumping, but a more subdued 2.4%. Hurt were grocers everywhere else including stumbling Wal-Mart (WMT-NYSE) (a DJI component) whose stock dropped 3.7%. Grocers in Canada were also hit with Loblaw’s (L-TSX) dropping 2.7%, Metro (MRU-TSX) losing 1.3%, and Empire (EMP.A-TSX) off 0.7%. The fear is Amazon is going to shake up the grocers market with a remake of Whole Foods and boost its e-commerce business. Whole Foods has a network of 460 stores including 13 in Canada.
But the main background story of the week continues to be dominated by President Donald Trump who is now, it appears, under investigation for possible obstruction of justice related to the firing of former FBI Director James Comey. Trump has predictably called it a “witch hunt” and now hanging over these proceedings is the specter that another “Saturday Night Massacre” could take place: Trump could fire special counsel Robert Mueller III and as well Rod Rosenstein the Deputy Attorney General for the US Department of Justice.
Rosenstein is allegedly behind the recommendation to fire Comey. The going-ons in Washington overshadowed the shooting at a baseball practice when a gunman opened fire on Congressmen, seriously injuring one and injuring others before being killed by police. Nonetheless, the Russian investigation and the maneuvering in Washington are sure to continue and dominate headlines. But, the going-ons appear to be nothing but background noise for the markets that seem to be largely ignoring it.
If Mueller and Rosenstein were to be fired, however, that could most likely shake the markets. A reminder once again that following the original “Saturday Night Massacre” when on October 20, 1973, President Richard Nixon, under investigation for Watergate, fired independent special prosecutor Archibald Cox and triggered the resignations of Attorney General Elliot Richardson and Deputy Attorney General William Ruckelshaus. Today it’s Mueller and Rosenstein with Attorney General Jeff Sessions seemingly above the fray even following his testy disposition with the US Senate where he refused to disclose any of his discussions with President Trump. Stock markets fell another 43% into 1974 while gold soared 85% in roughly the same period.
Not all markets were quiet on the week as the S&P TSX Composite not only fell 1.8% on the week (more on this later) but has now fallen into negative territory for the year—down 0.6%. The S&P TSX Composite appears to be out of sync with all other markets that are largely in the green this year. Oil prices dropped under $45 and gold and gold stocks withered as well. The major stock markets may have been rather boring this past week but not elsewhere, it seems. The takeover and ongoing circus in Washington sparked some excitement, but it was a yawn for the most part from the stock markets.
(Source)
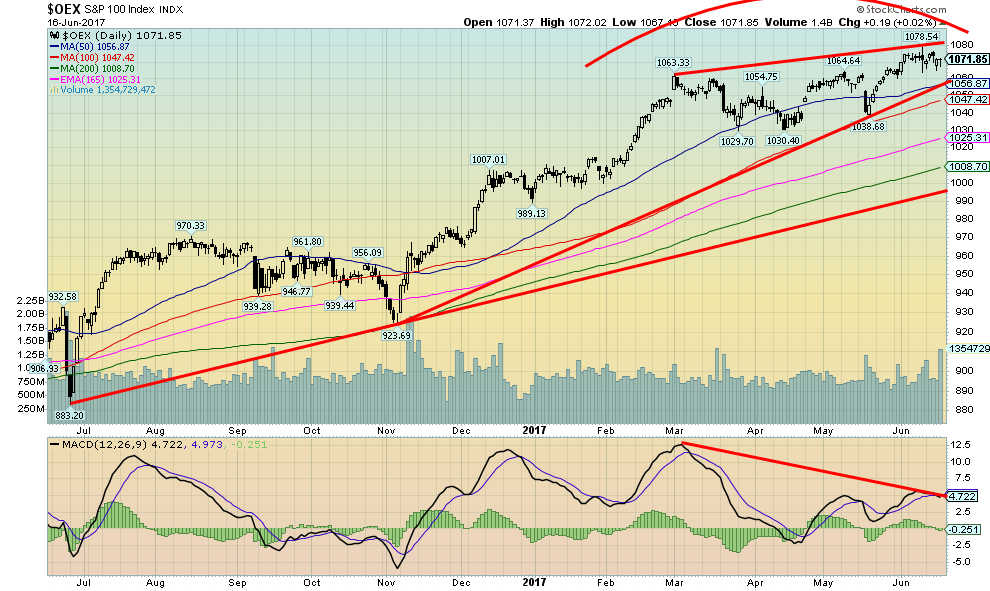
We thought we would show the S&P 100 or the OEX as it is known, instead of the S&P 500. What’s the difference? The OEX is made up of the largest cap stocks with options traded on them from the S&P 500. Another way of thinking of the OEX is that it is DJI on steroids with 100 companies (102 actually, as two companies have two different classes of stock) instead of the narrower DJI 30 stocks. The OEX represents some 63% of the market capitalization of the S&P 500 and almost 51% of the market capitalization of the entire US equity markets. It is the largest and most established companies found in the S&P 500.
Not surprisingly, the chart of the OEX is very similar to the S&P 500. The Trump rally remains very visible getting underway in November 2016 and topping in February 2017. We have in the past described what has taken place since the February top as a potential wave 4 of a wave that got underway back at the June 2016 low coinciding with the Brexit. The Brexit low was, we believe, a wave 2 low counting from the February 2016 low. The February 2016 low was, we believe, wave 4 of the bull market wave that started back in March 2009. All this suggests once this wave is complete we should see another wave to the upside to complete the current up wave.
Note how an ascending wedge appears to be forming. Naturally, this bearish pattern is not as yet confirmed until we break down under 1,055, a level that coincides with the 50-day MA. The bearish wedge pattern only measures down to around 1,025 to 1,035 and the 165-day exponential MA. That would be in keeping with our notion this is merely a corrective wave to the Trump rally with another one to the upside to come. Note how the MACD indicator is diverging with the price action and is actually starting to roll over. A break to the downside could be imminent.
(Source)
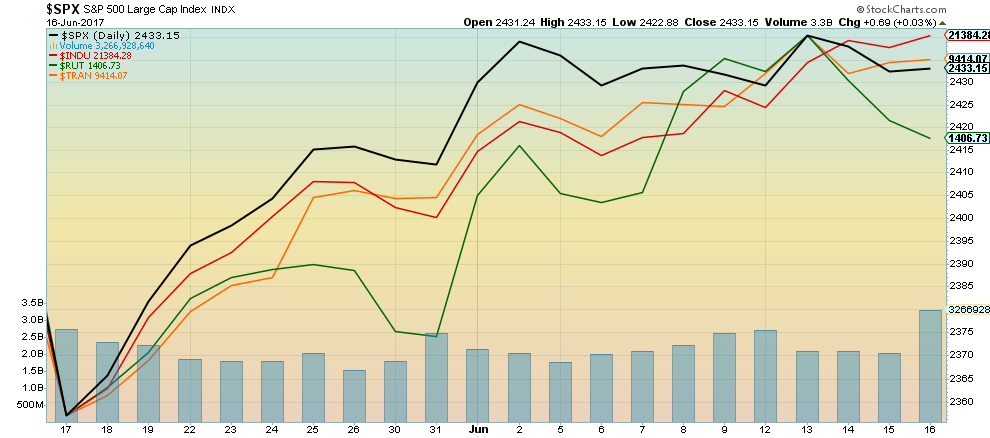
It’s lonely at the top. This past week the Dow Jones Industrials (DJI) (in red) moved to new all-time highs. Nobody else joined the senior index to confirm. The Dow Jones Transportations (DJT) (orange) hasn’t made a new high since March 1. One of the key tenets of Dow Theory is the averages must confirm each other. The S&P 500 (black) flirted with new all-time highs but failed to make it. Others such as the NASDAQ (not shown) and the small cap Russell 2000 (green) actually faded away this past week. So what does it all mean? Well, not a lot actually—at least until it is confirmed. Confirmation would come with a breakdown under a previous low and suggest that the divergence seen at the top was a signal. One also needs other signals to confirm and here most signals were mixed this past week. The NYSE advance/decline line closed in positive territory as did the NYSE up/down volume ratio. The VIX volatility indicator remains mired in a very low territory (the VIX moves opposite to the price action of the indices). But long periods of low volatility are not unusual. So all one can do with this is to note the divergence and await the coming week to see if we get any confirmation.
(Source)
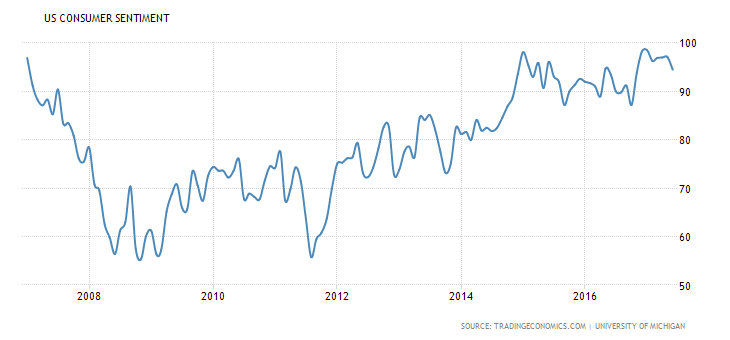
Consumer sentiment as measured by the University of Michigan sentiment indicator took a tumble this past week with an index reading of 94.5 for June (preliminary). The market had been looking for 97 and the May index was 97.1. So it was a bit of a surprise to see consumer sentiment coming in lower than expected. Not that it is particularly low. Indeed, the index has been flirting just under 100 and at least over 90 now for several months reflecting some confidence by the US consumer. It was, however, the lowest reading in seven months. Both present and future expectations declined. The high points for the index were seen in the late 1990s, reaching an all-time high in January 2000 at 111.4. The record low was 51.7 in May 1980. What the index is reflecting is decreased confidence that Trump’s agenda is going to get passed. Stock markets and the Michigan consumer sentiment indicator do, however, often go hand in hand. Deteriorating consumer confidence can translate itself into a declining stock market. If the index were to break under 90 it might be reflecting a broader problem.
(Source)
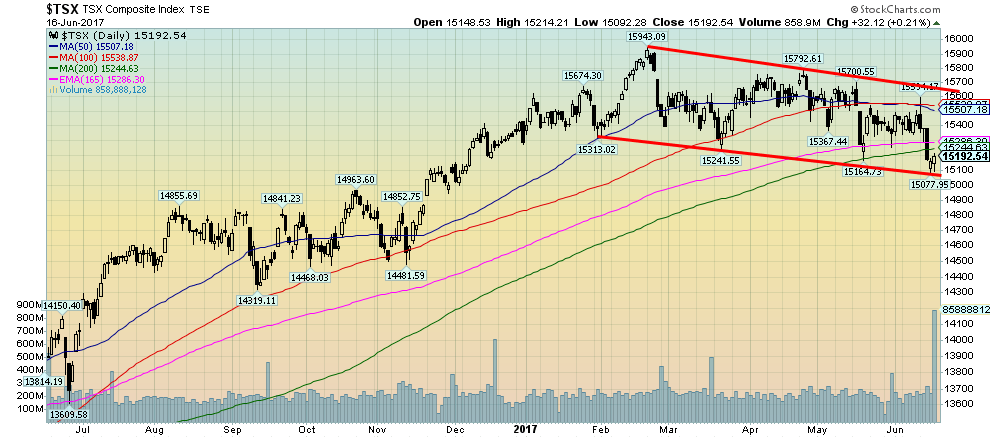
While the US indices are in the black this year, as are the major international indices and emerging market indices, the same cannot be said for the S&P TSX Composite. The TSX is now down 0.6% on the year falling into negative territory this past week. Especially hard hit was Materials down 5.2% led by a 5.5% decline in the TSX Gold Index. But Energy was down 4.3% as oil prices fell, Consumer Staples dropped 2.3% as grocers were hit following Amazon’s takeover of Whole Foods; Health Care dropped 3.4% and Information Technology continued its recent weakness with a loss of 3.1%. Was there a winner? Yes, Utilities gained a paltry 0.6%. Financials have been generally weak now for weeks against the background of the Home Capital debacle. But they are showing signs of coming around. The TSX has fallen under the 200 day MA but we are also down at trendline support given the gentle downtrend nature of the bear channel. Thursday saw a bottom and Friday was an up day. A dead cat bounce following the sharp down day of Wednesday? Maybe, but regaining back above 15,300 would be positive. A move back above 15,400 could suggest that a low is in place even if temporary. Above 15,525 would confirm a low and above 15,700 would be a breakout. Naturally, we don’t want to see new lows.
(Source)
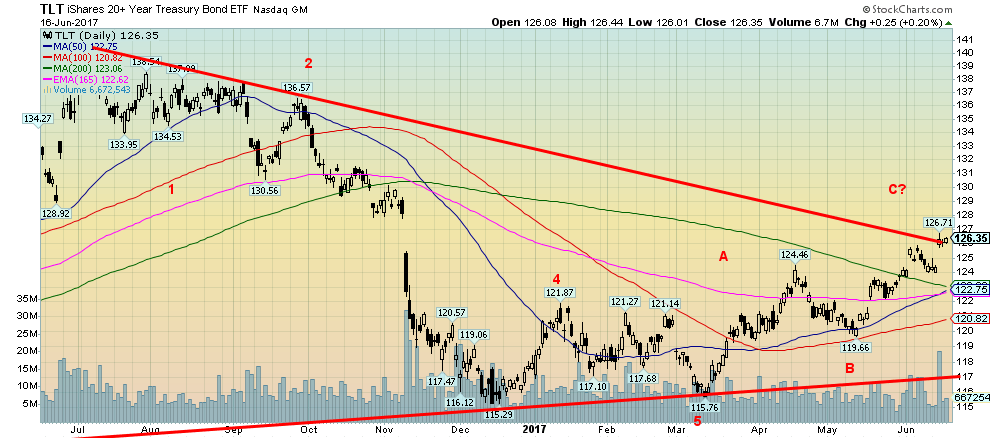
US bonds have continued their recent rally spurred on this past week when the Fed hiked the Fed rate once again. The new Fed rate is 1%–1.25%. Oh, for the days when it was 0%–0.25%. It was the second rate hike in 2017 and the fourth since they started in December 2015. All of this despite the fact that inflation remains mired below 2%. The May CPI actually fell from April. The core inflation rate remains mired at around 1.6% year over year. It seems counterintuitive that bond prices should rise (yields fall as yields move inversely to prices) but the expectation is hiking rates will eventually slow the economy and therefore require lower interest rates. Many thought the Fed should have stood pat. But the Fed has wanted to show their confidence in the economy and also to try and normalize interest rates following years of quantitative easing (QE) and 0% interest rates. The Fed also addressed its $4.5 trillion balance sheet noting that they will let things run off as they mature.
(Source)
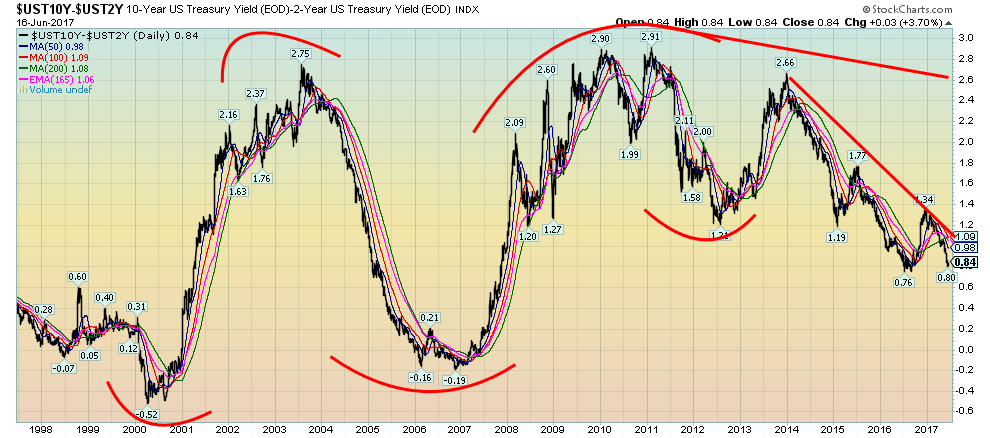
Rising Fed rates raise the specter of the yield curve eventually going negative. No, it is nowhere near that right now. Above is the 2–10 spread meaning the spread between the yields of the 10-year US Treasury Note and the 2–year US Treasury Note. It is currently at 0.80%. But note in 2000 before the Tech/Internet crash it reached negative 0.52%. And before the 2008–2009 financial crash it dropped as low as negative 0.19%. It has a way to go before it is negative but this is worth keeping an eye on. It can change rapidly and the current direction is down for a narrower spread. If it does turn negative then odds increase sharply that a recession and stock market drop are likely on the way.
(Source)
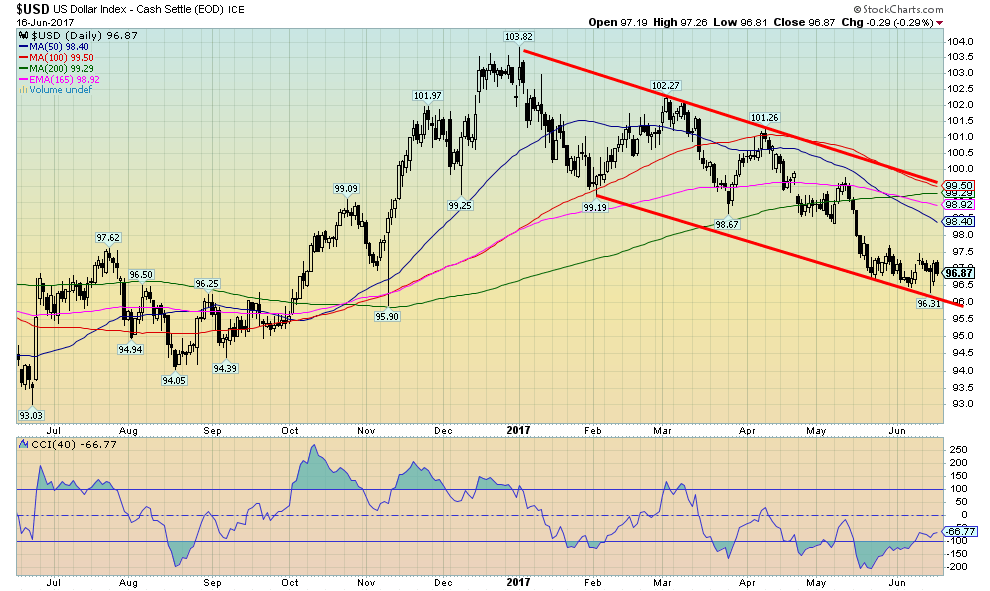
Despite the Fed rate hike this past week the US$ Index went nowhere. Normally one might expect the US$ to rally after the Fed hikes rates. But the Euro wasn’t really hit this past week, the British Pound improved despite the uncertainty created by the election while the Canadian$ enjoyed a strong up week on the heels of rate hike talk and ignoring the fall in oil prices. Sentiment remains poor towards the US$ right now and one would think as well that it could translate into a rally of some sort. It still might once we break above 97.50. We could then see a test of 98.40 to 99.50. Above 99.50 the US$ Index would break out. But all that is trying to find a bottom albeit a temporary one. We believe the top is in and that the breakdown under 100 was the start of a new longer term downtrend. Even if a rebound did occur we doubt it would break above 100.
(Source)
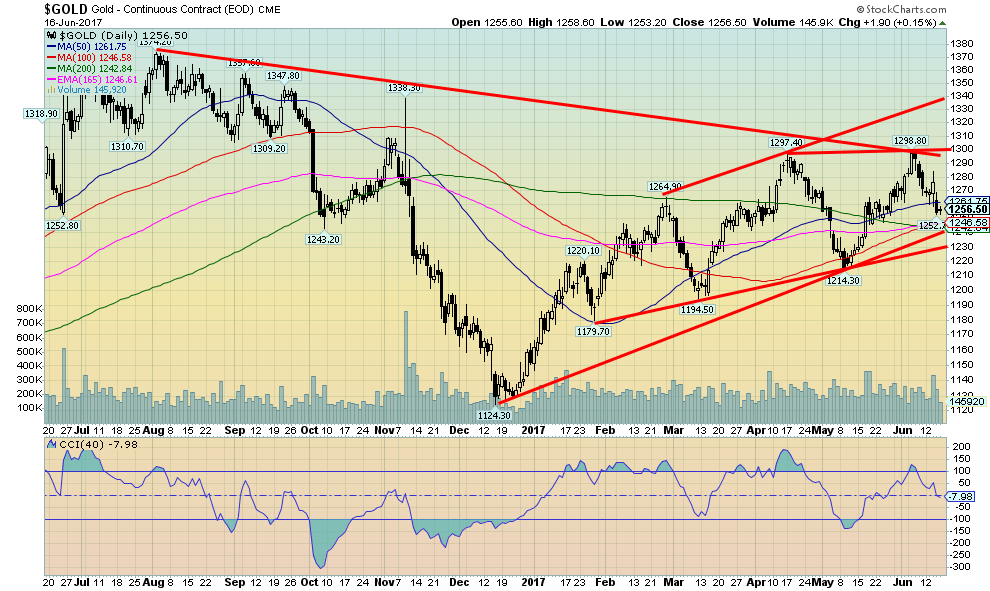
We confess even we are somewhat baffled by how gold is unfolding since the December 2016 low. But despite the confusion over what is going on, we like the fact that we have successive higher lows starting with the January 2017 low of $1,179, the March 2017 low of $1,194 and the May 2017 low of $1,214. Also, successive highs were seen in January 2017 at $1,220, February 2017 at $1,265, April 2017 at $1,297 and albeit only marginally higher in June 2017 at $1,299. At least the trend is right. Up. Key now is that gold on this pullback holds above $1,214 and preferably holds the up trendline, currently near $1,230.
We have seen this pattern before. While it is certainly no guarantee we can point out that from February 1999 to October 1999 the NASDAQ put in a series of sharp ups and downs of successive higher highs and higher lows. Once the final low was seen in October 1999, the NASDAQ started its blow off to the top in March 2000 gaining 95% in the process. The frustrating part for the gold bugs is that this “herky jerky” action could continue into the summer before we see the final bottom.
One thing seems certain: we most likely won’t see a top in July this year. In 2016 the high for the year was seen in July before the long slide into December 2016. In 2015 the high was actually seen in January and the rest of the year was spent making lower highs and lower lows until the final one in December. The low, so far for 2017 was made in January. Despite gold’s recent difficulties gold remains up 9.1% in 2017. Good support is seen down to $1,230/$1,240 while major resistance is at $1,300. Next, let’s have a look at gold’s seasonals.
(Source)
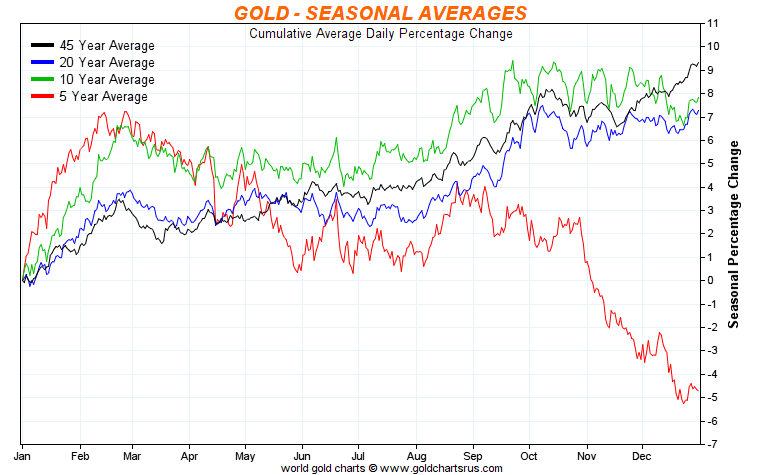
For the past five years, the gold seasonals have been out of sync with what had occurred over a 10-year, 20-year, and 45-year period. Gold was generally topping by August and then a long slide got underway into year-end. Could gold be setting up to return to its long-term averages? As the 10, 20, and 45-year seasonals show gold had a tendency to bottom early in the year, top out around February/March, then go through a series of ups and downs generally into June or July. After that gold tended to have its best months of the year. If anything, 2017’s movement appears to be following the longer-term averages and not the average of the past five years. If that is correct it bodes well for gold once we get into July/August and there remains the potential for an explosive move in the latter part of the year.
(Source)
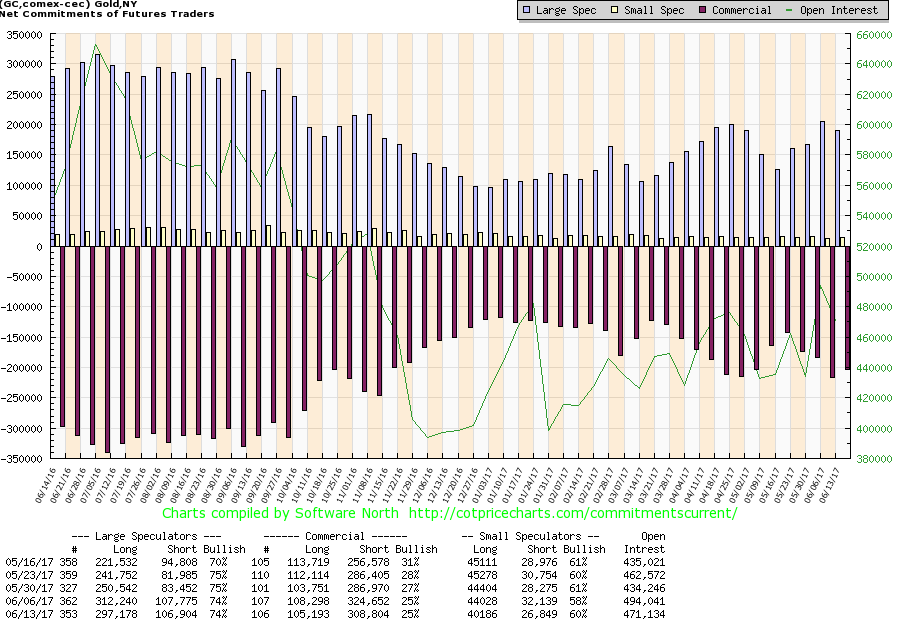
The improvement in the commercial COT was small this past week, but at least it was an improvement. Overall the commercial COT remained at 25%. But significantly the short open interest fell by roughly 16,000 contracts even as long open interest dropped just over 3,000 contracts. That tells us that the commercials were covering some shorts on the recent drop. The large speculators COT (hedge funds, managed futures, etc.) remained as well at 74% but they cut their long open interest position by roughly 15,000 contracts. Open interest declined by roughly 23,000 contracts. In a true bear market, one would expect open interest to be rising. We will watch this week’s COT with interest.
(Source)
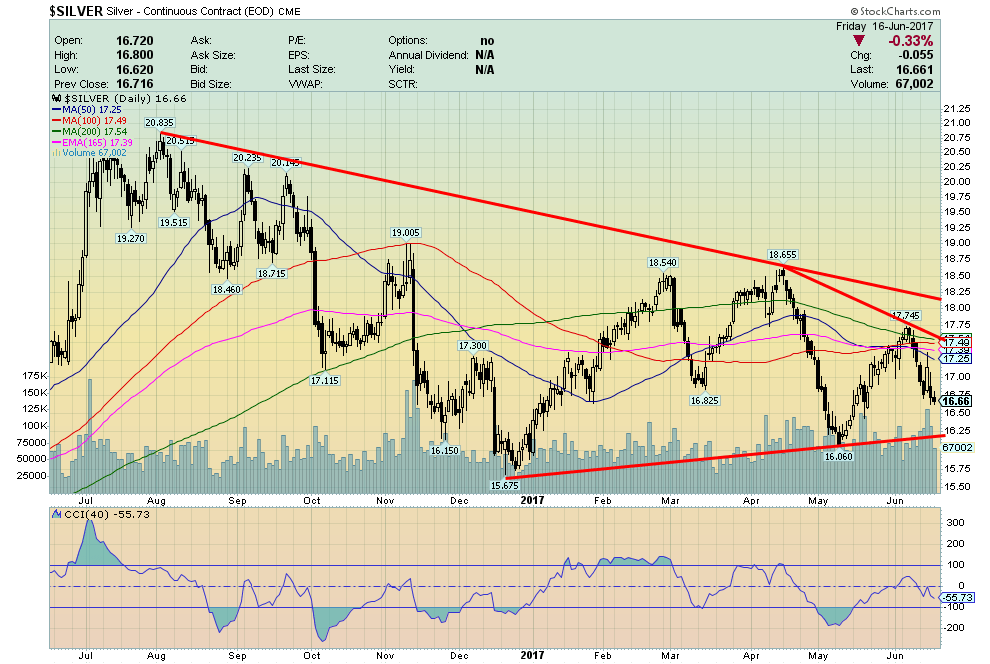
Silver has struggled in relation to gold. It’s only up 4.2% so far in 2017. But silver remains tremendously undervalued. Strong support can be seen down to $16.25 while resistance is at $17.50 and just above $18. Silver appears to be making an interesting bottom pattern and we would expect once this correction is complete a strong up move could get under way that would carry it over $18 and even over the 2016 high of $21.23.
(Source)
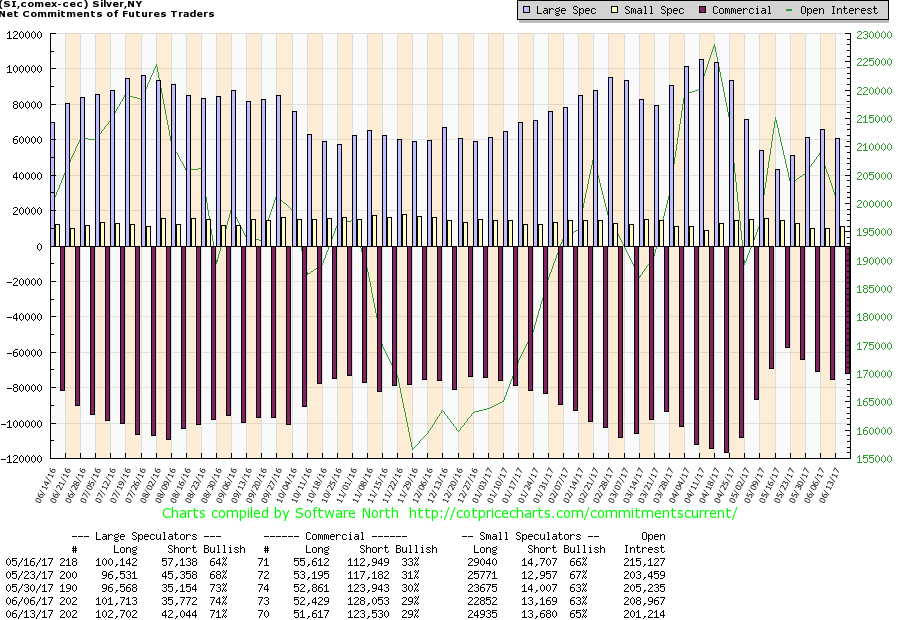
Like the gold COT silver’s commercial COT was unchanged this past week at 29%. There really wasn’t a lot of movement either way with long and short open interest. The large speculators COT dropped to 71% as short open interest jumped about 6,000 contracts. But long open interest also went up by roughly 1,000 contracts. It is the long open interest that fascinates us as it has remained consistently high near 100,000. This tells us that there are a lot of long-term players in here. Usually in a bear move long open interest would fall considerably. Not this time. The large speculators COT remains quite bullish.
(Source)
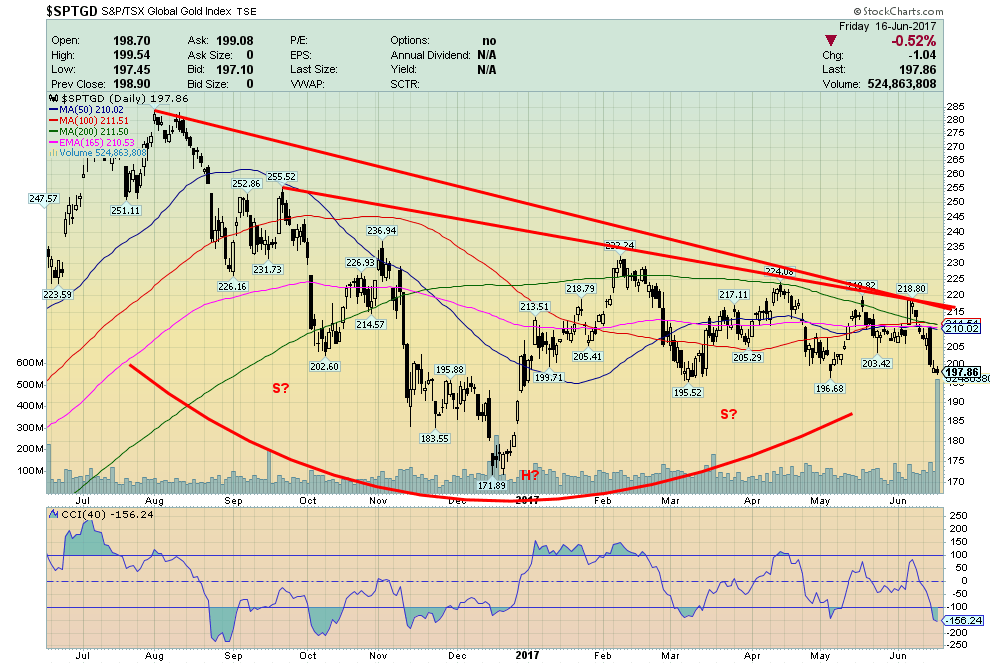
It seems like the holders of gold stocks are throwing in the towel. Both the Gold Bugs Index (HUI) and the TSX Gold Index (TGD) were hit back over 5% this past week. Both are clinging to barely 2% gains for the year. All this does is make gold stocks cheaper than they were. The Gold/HUI ratio is at 6.75, which remains at the high end of the spectrum historically for this ratio. We certainly wouldn’t be throwing away our gold stocks here. The TGD could be making an interesting head and shoulders bottom pattern. A firm breakout over 215 on volume could project the index up to around 275. Interestingly, volume was heavy this past week on the sell-off. Seems that many are just discouraged but sentiment towards the gold stocks and the gold/HUI ratio suggest one should be accumulating gold stocks, not selling them.
(Source)
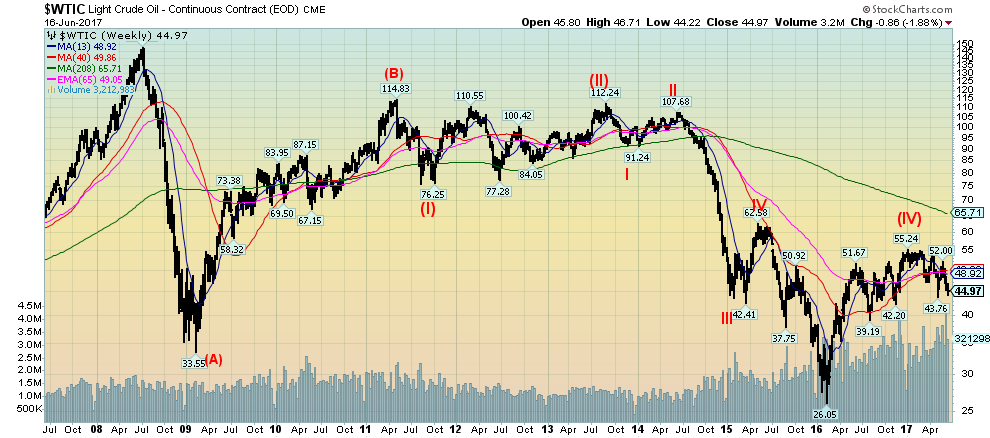
WTI oil prices have fallen under $45. They could have further to fall. They could even go down to test the February 2016 low of $26.05. If this happens, it should occur quickly before year end. And if it does, it could complete a 5-wave decline to the bottom and a (C) wave. After that, a new bull could get underway. There is no rule, however, that says WTI oil has to go back down to those lows. Support is seen at $42 and $39. Under $39 there is mostly air until the February 2016 low. We are optimistic that oil prices are in the final throes of its decline from the high of $147 seen way back in 2008. Seems like a generation ago.
—
DISCLAIMER: This article expresses my own ideas and opinions. Any information I have shared are from sources that I believe to be reliable and accurate. I did not receive any financial compensation in writing this post, nor do I own any shares in any company I’ve mentioned. I encourage any reader to do their own diligent research first before making any investment decisions.


XRP Under Pressure Amid Macro Forces, Fed Policy, and Regulatory Shifts
XRP remains under pressure despite easing geopolitical tensions, as macroeconomic factors and Fed policy dominate market sentiment. Liquidations and high...


Edison Accelerates Renewable Growth and ESG Impact in 2025
Edison reports strong 2025 sustainability progress, boosting renewable investments by 90% to reach 2.3 GW toward a 4 GW 2030...


New Gene Therapies Transform Rare Disease Care, but Gaps Remain
Gene therapies are transforming rare disease treatment, enabling normal lives for some patients. However, only about 6% of 7,000 rare...


Temotiva Launches Crowdfunding Campaign to Advance Preventive Mental Health
Temotiva Innovación Lab has launched a crowdfunding campaign through Santander X Explorer, marking a new phase for the University of...


Fed Policy Shift Raises Concerns Over Debt and Inflation Risks
The Federal Reserve is criticized for resuming balance sheet expansion through Treasury purchases despite expectations of tighter policy under new...
 |
|
 |  |
 |
|
-

 Impact Investing2 weeks ago
EU Approves €23B Italian Renewable Energy Plan to Boost Climate Goals
-

 Biotech1 week ago
Advances in Biomarkers and Targeted Therapies Transform Kidney Care in Autoimmune Disease
-

 Africa2 weeks ago
Morocco at an Energy Crossroads Amid Global Gas Volatility and Critical Minerals Opportunity
-

 Fintech4 days ago
Trade Republic Brings Back Human Support and Launches Customer Council
You must be logged in to post a comment Login