Featured
Overnight repo rate rose up to 10% amid cash shortages in money markets
The Fed cut rates as expected. The Fed also intervened in repo markets for four consecutive days because of cash shortages in the short term money markets. It was the first major repo operation since 2008. In 2008 there was a financial crisis. So what is there now? The operation is expected to continue. There are further signs of a slowing global economy as the stock markets fell and gold rose.

U.S. overnight repo rate

As expected, the Fed cut the key banking rate another quarter point this past week to 1.75%-2.00%. It is the second cut this year. Expectations by many are for one more, but there are many who expect the Fed to be done for the year. The Fed, as usual, was ambiguous. If there is one more, we would not expect it to happen until the December FOMC.
But the real story of the week may have been the action in the overnight repo market. The term may throw off non-market people, but for the short-term money markets, it is a very key market. For starters, what is the repo rate? Simply, it is defined as “the discount rate at which a central bank repurchases government securities from the commercial banks, depending on the level of money supply it decides to maintain in the country’s monetary system. …Repo is short for repossession.”
It is, however, not just limited to the central bank as banks and dealers are active in the overnight repo market as well, lending overnight funds against collateral. Depending on the credit of the collateral the repo rate can vary. Many securities may not be eligible for repo due to a low credit rating. The repo market is huge. In the U.S., the average daily volume is estimated at $3.9 trillion. Repo dealing desks exist not just in the U.S. but in major money markets around the world, including Canada.
So, what happened? The overnight repo rate leaped to a high of 10% this past week from its normal 2-2.25%. It only fell once the Fed pumped roughly $75 billion into the markets, not just once but every day for four days. The last time markets had been this violent in the overnight repo market was 2008. We all know what happened then.
In 2008 markets were violent because of the fear of financial collapse surrounding the Lehman Brothers debacle. This time it appears to be have been a gross mismatch of funds in the markets. U.S. companies withdrew apparently upwards of $100 billion for tax payment deadlines. The U.S. Treasury had to settle a $78 billion issue of coupon bonds and bills. Add in the demand for funds because of the surge in oil prices, coupled with ongoing distortions because of the Fed unwinding QE and what happened was a classic cash squeeze in the market. Rates soared.
The fact that the Fed had to get involved to calm the markets is a sign, we believe, of growing instability in markets. The world, as we know, is highly indebted with an estimated $250 trillion or more of debt outstanding. Most of it is outside the money markets as loans and many other forms of debt are not marketable so they do not trade. It is the market for securities, bonds, bills, notes, commercial paper, bankers’ acceptances, and many others. It includes paper of governments, corporations, and financial institutions. Active participants include banks, investment dealers, and brokers but also many corporations with large money market requirements.
Interest rates globally and historically are low including, as we have noted, $17 trillion of negative rate debt primarily in the EU and Japan. Interest rates have to stay low. The world would not be able to withstand a rise in interest rates. Central banks around the world would be forced to intervene to try and push rates down if dislocations and mismatches occur. The Fed is lowering rates in response to a potential global economic slowdown. But the central banks influence primarily short interest rates while long interest rates are market oriented. If rates start to rise to even 3% or higher for 10-year bonds and notes it could cause a bond collapse resulting in a market panic as a debt crisis spreads.
U.S. Fed funds rate


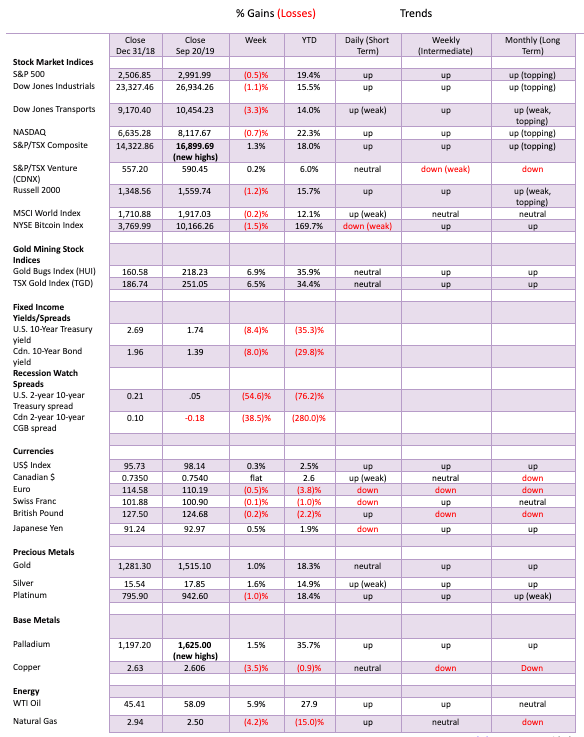
For the first time in four weeks, markets closed lower this past week. The S&P 500 fell 0.5% while the Dow Jones Industrials (DJI) was off 1.1%. Hardest hit was the Dow Jones Transportations (DJT), losing 3.3%. Gainers were rare this past week. The TSX Composite soared to new all-time highs, gaining 1.3% this past week while the Tokyo Nikkei Dow (TKN) was up 1.3% as well.
More tensions between China and the U.S. surfaced over trade and that was enough to put a damper on the markets irrespective of the Fed’s rate cut. Concern remained over the drone bombing against Saudi Arabia’s oil fields as the U.S. was sending troops to the kingdom. The Fed cut rates as expected, but questions remained about further rate cuts and there was a sense as to just how much this would accomplish against a backdrop of a slowing global economy.
There was concern about the Fed’s operations in the repo markets where cash shortages had developed. These repo operations are now expected to continue into October. There are more bond and bill auctions coming up and the volume, coupled with the settlements, is weighing on the market. If weak demand develops for the bond auctions, interest rate yields would rise again and bond prices fall (prices move inversely to yields).
The picture above of the S&P 500 shows it is once again up against the top of the broadening channel. Failure to make new highs or break through the top of the channel could set up a potentially dangerous double top on the charts. This pattern is being repeated elsewhere. A gap down through 2,950 would be dangerous and suggest an island top. If the ascending wedge pattern is correct, a breakdown through 2,900 suggests a big drop ahead. Confirmation comes with a breakdown under 2,800.
While the NYSE advance decline remains positive, it is beginning to roll over with the market. There is little encouragement elsewhere where numerous charts are failing at channel tops, and, experiencing declining volume typical of a topping pattern. Put buying is growing and normally that might be a positive sign. The market, however, has not yet fallen.
The fall equinox can often bring trend changes in markets even if it is not immediately obvious. We have seen numerous highs in September, including last year, along with famous ones in 1929 and a lower high in 1987. Tops in September saw crashes in October in 1929, 1987, but also 1978 and 1979. Some highs waited until October. There were key highs in October 2000 and 2007 before significant drops in the months to follow. With so many non-confirmations, potential double tops, reaching tops of channels against declining volumes, weakening economic conditions, the potential for rising interest rates, chaos in the repo markets, and, the volatile China/U.S. trade war, caution is advised at this juncture.
As noted, a breakdown could occur under 2,950 S&P 500 and confirmed under 2,800. The TSX Composite doesn’t break down until below 16,000. With the TSX Composite up against a channel as well caution is advised there as well. For the S&P 500, a decline into October could last into December/January and fall as low as 2,200 to complete what we believe is either an E wave or a C wave. Either way, a decline of some significance appears to be in the works and should become evident soon.

Gold, silver and the gold stocks as represented by the Gold Bugs Index (HUI) and the TSX Gold Index (TGD) enjoyed an up week. Gold gained 1% and silver was up 1.6%, while the HUI jumped 6.9% and the TGD gained 6.5%. Despite the positive week, we are not enamored with what appears as a potential head and shoulders top forming on the gold chart. Volume tailed off this week even as the market rose. Not necessarily a positive sign.
The US$ Index gained a small 0.3% this past week, but it too looks toppy. Normally that would be positive for gold but with a negative pattern forming on the gold chart we are somewhat suspicious as to what actually might happen. The US$ Index could still move higher to unfulfilled targets up around 100.80. Gold breaks under $1,490 and has potential targets down to $1,415/$1,420. There is some interim support at $1,480 down to $1,470. Below that the targets should be achieved.
The silver chart continues to look negative. Its next break would occur under $17.50 and target down to $16.90/$17.00 support. Ultimately, silver could fall to retest levels down to $16. The upcoming period is often difficult for gold and silver. Weakness can last into November or December before the early year rally gets underway. We believe we have a completed a 1 or A wave up and this is the 2 or B wave to form. Even when gold was rising from $680 to $1,900 from 2008 to 2011 there were several corrections along the way, including some that saw gold fall 10–15%. So, a correction now would not be unusual.
The commercial COT for gold shown below remains at 25% this past week. While long open interest rose roughly 7,000 contracts short open interest jumped roughly 20,000 contracts. That suggests to us that the commercials remain negative and have yet to cover their shorts. Silver is in the same position. Profit-taking on gold stocks would raise cash for buying opportunities that should arise over the next couple of months.

Markets and Trends
__
DISCLAIMER: David Chapman is not a registered advisory service and is not an exempt market dealer (EMD). We do not and cannot give individualized market advice. The information in this article is intended only for informational and educational purposes. It should not be considered a solicitation of an offer or sale of any security. The reader assumes all risk when trading in securities and David Chapman advises consulting a licensed professional financial advisor before proceeding with any trade or idea presented in this article. We share our ideas and opinions for informational and educational purposes only and expect the reader to perform due diligence before considering a position in any security. That includes consulting with your own licensed professional financial advisor.


Cannabis Clubs Approved in Hesse as Youth Interest in Cannabis Declines
Ten cannabis clubs in Hesse, Germany, have received approval to legally cultivate marijuana under strict regulations. Despite broader access, youth...


Robinhood Expands to Europe with Tokenized Stocks and Perpetual Futures
Robinhood is expanding in Europe by offering tokenized stocks and perpetual futures. Tokenized shares enable fractional, 24/7 trading of real...


Ecnoglutide Shows Promise as Next-Generation Obesity Treatment
Ecnoglutide, a once-weekly GLP-1 receptor agonist, showed up to 13.2% weight loss over 40 weeks in obese or overweight adults...


Coffee Prices Decline Amid Rising Supply and Mixed Harvest Outlooks
Coffee markets fell last week amid ongoing harvests in Brazil, Indonesia, and completed harvests in Vietnam. Despite cold weather in...


Dolci Palmisano Issues Its First Minibond of the F&P “Rolling Short term” Program
Dolci Palmisano Srl issued its first €300K Short Term Minibond at 5.5%, fully subscribed on launch. Structured by Frigiolini &...
 |
|
 |  |
 |
|
-

 Africa7 days ago
Côte d’Ivoire Unveils Ambitious Plan to Triple Oil Output and Double Gas Production by 2030
-

 Biotech2 weeks ago
Galicia Becomes First in Spain to Approve Gene Therapy for Hemophilia B
-

 Business4 days ago
The TopRanked.io Weekly Digest: What’s Hot in Affiliate Marketing [NordVPN Affiliate Program Review]
-

 Fintech2 weeks ago
Bitget Secures Operational License in Georgia, Strengthening Its Eastern Expansion