Featured
Is the PayPal stock (PYPL) anxious about a correction?
Paypal stock’s ability to break above the key level of price resistance has produced exceptional results.
2017 has been a fruitful year for Paypal Holdings Inc (NASDAQ: PYPL) stock. Year-to-date, PayPal stock is up 89.36% and this move towards higher PYPL stock prices has been relentless.
I have the virtue of saying that I actually foresaw such a move in the stock when I published a report on January 11, 2017, titled “Paypal Holdings Inc: This Will Send PYPL Stock Soaring.”
My inclination to believe that this stock was going to surge higher was based on the notion that it was challenging to break above a key level of price resistance established a few short weeks after its initial public offering (IPO).
Breaking above a level of resistance that was set shortly after an IPO has a tendency to produce exceptional results, and Facebook Inc (NASDAQ: FB) is a prime example of this. Once this feat was accomplished, PayPal began its ascent towards higher stock prices, and I am beginning to wonder if a correction is going to ever occur.
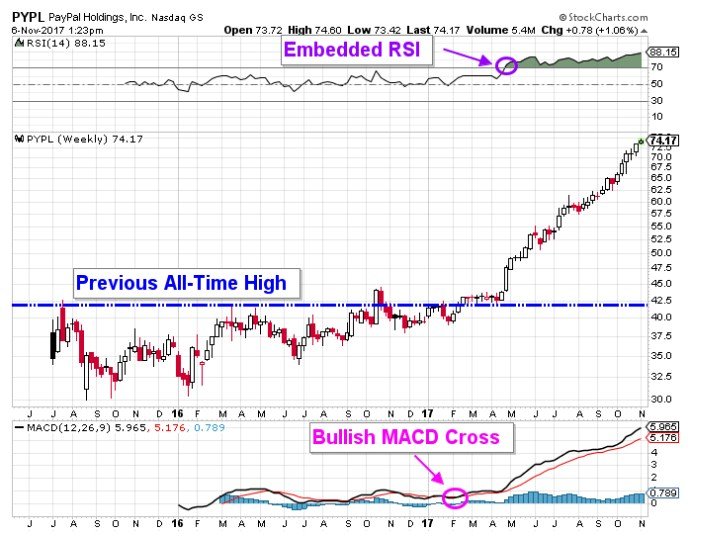
Chart courtesy of StockCharts.com © Profit Confidential
As a technical analyst, I rely on price action and technical indicators in order to suggest whether an investment is set to appreciate or depreciate. The following PYPL stock chart illustrates the indications that have supported and currently are supporting this move towards higher stock prices.
In January of this year, I had the inclination to believe that the previous all-time high going to be broken to the upside, and this was despite the failed attempt that occurred in October. These bullish beliefs were based on the bullish trend that began in January 2016, which was characterized by a series of higher highs and higher lows.
This inclination came to fruition when PayPal forged a new all-time high in February and this marked the beginning of the epic move towards higher PayPal stock prices.
This epic move has been supported by a number of technical indicators, and I have highlighted the Relative Strength Indicator (RSI), and the Moving Average Convergence/Divergence (MACD) indicator.
RSI
The RSI is used to measure overbought and oversold conditions. A reading below 30 is oversold, while a reading above 70 is overbought. The largest moves are created when the reading is below 30 or above 70.
In April, when PayPal stock began to accelerate higher, this indicator became embedded above 70 and has remained there ever since. As long as the RSI indicator remains above 70, the stock price will continue to push higher.
In order to negate the implication suggested by this indicator, the oscillator will need to cross below 70, which would signal that the accelerated move towards higher prices has concluded.
MACD
The MACD indicator is used to distinguish whether bullish or bearish momentum is influencing the trading action in an investment, and this indicator is very influential because, in order for an investment to stage a significant advance or decline, the appropriate momentum is required.
In February, a bullish MACD cross was generated, indicating that bullish momentum was influencing the trading action in this investment. PayPal proceeded to break above the previous all-time high, and this began the trend towards higher stock prices. This indication remains in bullish alignment, implying that the path of least resistance is geared towards higher stock prices. In order to negate this bullish posturing, a bearish MACD cross would have to be generated.
Both of these technical indicators continue to suggest that higher PYPL stock prices are on the horizon, and only when negating signals are generated will a correction ensue. The problem arises in the fact that either time or lower prices are required in order to generate these negating signals.
In order to confront this dilemma, I am leaning towards another indicator that I believe will as act as a precursor to suggesting a correction is in development. That indicator is highlighted in the following PayPal stock chart.
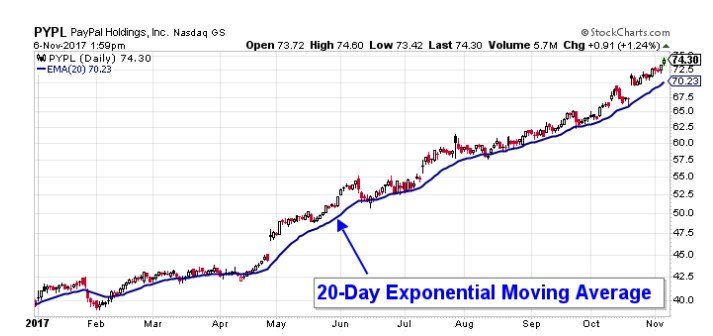
Chart courtesy of StockCharts.com © Profit Confidential
This stock chart illustrates that after both the bullish MACD cross was generated and the RSI became embedded, the accelerated trend towards higher stock PayPal stock prices has been supported by the 20-day exponential moving average.
20-day exponential moving average
For eight months, this moving average has acted as a level of price support, and as long as PYPL stock is trading above it, I will have the inclination to believe that higher prices are still possible. In order to even consider a correction is in development, I would need to see a confirmed close below the 20-day moving average.
Analyst take
PayPal stock is trading like runaway freight train, steamrolling its way towards higher stock prices. Corrections are always a concern, so I am watching the 20-day exponential moving average to give an indication that such a development is occurring.
(Featured image by André-Pierre du Plessis via Flickr. CC BY 2.0)
—
DISCLAIMER: This article expresses my own ideas and opinions. Any information I have shared are from sources that I believe to be reliable and accurate. I did not receive any financial compensation in writing this post, nor do I own any shares in any company I’ve mentioned. I encourage any reader to do their own diligent research first before making any investment decisions.


Advances in Biomarkers and Targeted Therapies Transform Kidney Care in Autoimmune Disease
New biomarkers and targeted therapies are reshaping the management of kidney damage in autoimmune diseases like lupus and vasculitis. Experts...


Bitcoin Rises on Iran Deal as Crypto Markets React to AI and SpaceX News
Bitcoin rose above $65,000, gaining about 5% as a tentative Iran war agreement boosted markets. ETFs still show weekly outflows....


Rising Inflation, Fed Uncertainty, and Market Excess Amid War and SpaceX Mania
Rising inflation, driven by war, debt, and money growth, puts the Fed in a difficult position ahead of its meeting....


SpaceX IPO Sparks Déjà Vu as Market Risks Loom and Gold Bulls Stay Hopeful
The author compares the 2000 AOL Time Warner merger to SpaceX’s planned IPO, warning it may signal a market top....


The TopRanked.io Guide to 2026’s Biggest and Best Affiliate Opportunities
Want to earn affiliate commissions on literal billions of dollars worth of revenue? Then this week, we've got something special...
 |
|
 |  |
 |
|
-

 Markets7 days ago
Sugar Markets Rise Slightly Amid War, Oil Price Pressure, and Strong Global Supply
-

 Africa2 weeks ago
Morocco’s Record Grain Harvest Spurs Temporary Import Barriers to Protect Farmers
-

 Cannabis4 days ago
Cannabis Legalization in Germany: A Mixed Interim Assessment
-

 Crypto2 weeks ago
Crypto Market Slumps as Bitcoin and Ethereum Fall, Sentiment Turns to Fear
You must be logged in to post a comment Login