Markets
Political controversy and investigation are weighing on the market
Weighing on the market is the ongoing Russian investigation, the controversy over some of Trump’s picks for cabinet, plus judicial and congressional roadblocks being thrown up in front of his legislation.

Possibly the biggest revelation of the week—or maybe it wasn’t—was the President’s son-in-law Jared Kushner was under scrutiny into possible ties to Russia and associates of the President. No matter what, the Russian issue does not seem to want to go away.
Since the President’s election in November, US stock markets have largely been on tear setting new all-time high records.The benchmark Dow Jones Industrials (DJI) was up 18% from the lows of the election to its recent highs. The NASDAQ and the S&P 500 have fared even better as both have been setting records. Call it the “Trump rally.”
But the high water mark for the “Trump rally” actually made its high back on March 1, 2017. Since then it has been mostly sideways to down despite some pops that once again made new record highs. Weighing on the market is the ongoing Russian investigation, the controversy over some of Trump’s picks for cabinet, plus judicial and congressional roadblocks being thrown up in front of his legislation. The Trump agenda is now coming under question and that, in turn, weighs on markets.
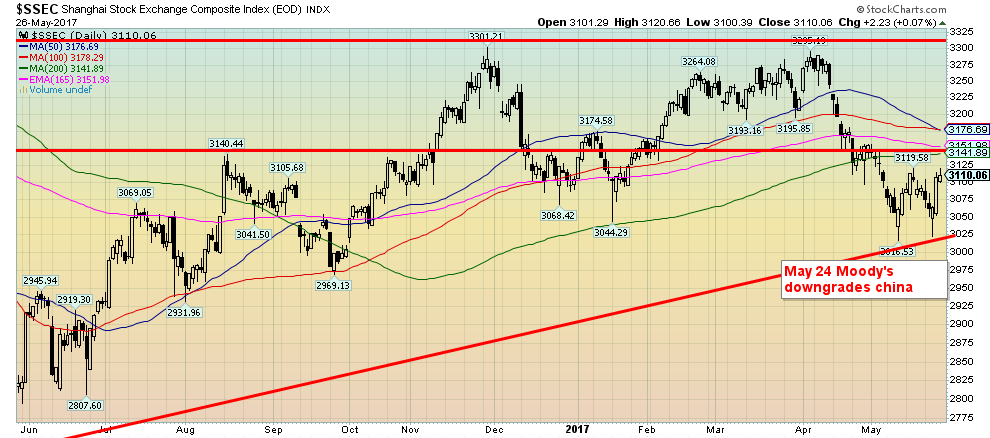
With the center of attention on Trump and his Presidency, few probably paid much attention to the May 24, 2017 downgrade of China debt to A1 from AA3 by the rating agency Moody’s. The initial reaction was typical hysteria on the part of the financial news networks, but after an initial hiccup, the Chinese stock market as represented by the Shanghai Stock Exchange (SSEC), actually jumped higher. Credit default swaps (CDS) which one would expect to rise were actually steady. Sell the rumor, buy the news?
(Source)
The SSEC has been steadily rising since February 2016. The recent decline has tested major trendline support. The recent sell-off shaved about 8.5% off the index while testing that support. The index, however, is trading under its 200-day MA and considerable resistance is seen up to at least 3,180. Above that, it’s possible the index could make a return to the highs. But the chart pattern also suggests a possible double top in November and April that appeared to suggest a decline to at least 2,780. A break back under 3,025 could well set up that test.
(Source: www.bloomberg.com, www.elliottwave.com )
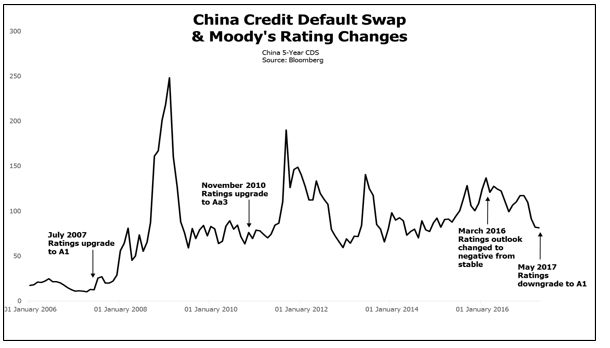
As we had noted the credit downgrade did not seem to impact China’s CDS spread. The high water marks were seen in 2008, 2011, and more recently in March 2016 when China’s rating was changed to negative from stable. China has considerable problems in its real estate sector and Chinese corporations were heavy borrowers of US$. A sharply rising US$ has put pressure on those companies and their debt repayments have soared with the strong US$ and subsequent somewhat weaker Chinese Yuan, despite the Yuan’s close relationship to the US$.
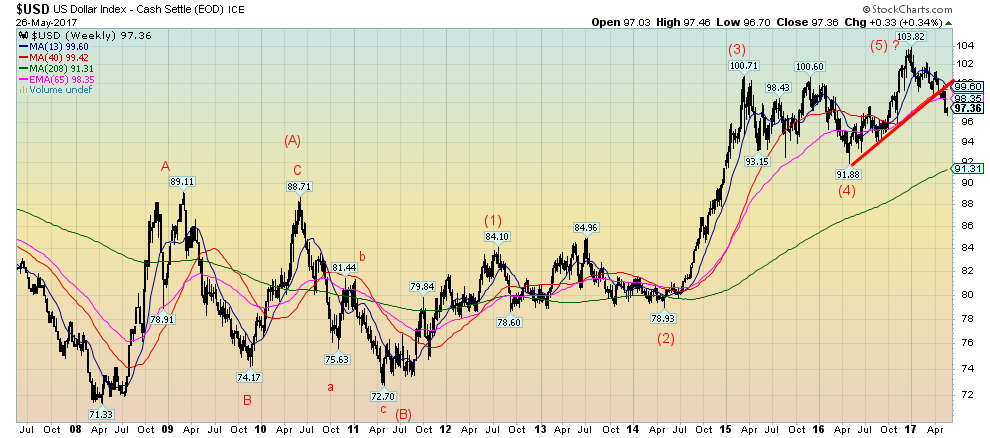
Speaking of the US$, the US$ Index has been under pressure recently and the US$ bulls seem to have disappeared. The US$ Index has broken down under the trendline up from the lows of May 2016. This has led us to believe it is quite possible the US$ Index has completed a five-wave rise to the top at 103.82 seen in December 2016. The recent decline has seen US$ sentiment fall sharply, suggesting that, at a minimum, a bear market rally could take place. If one does form, our expectations would be that we would test the underbelly of the uptrend line between 99 and 100. Targets appear to be down around 94 to 95 with a chance that we could test the four-year MA currently near 91.
(Source)
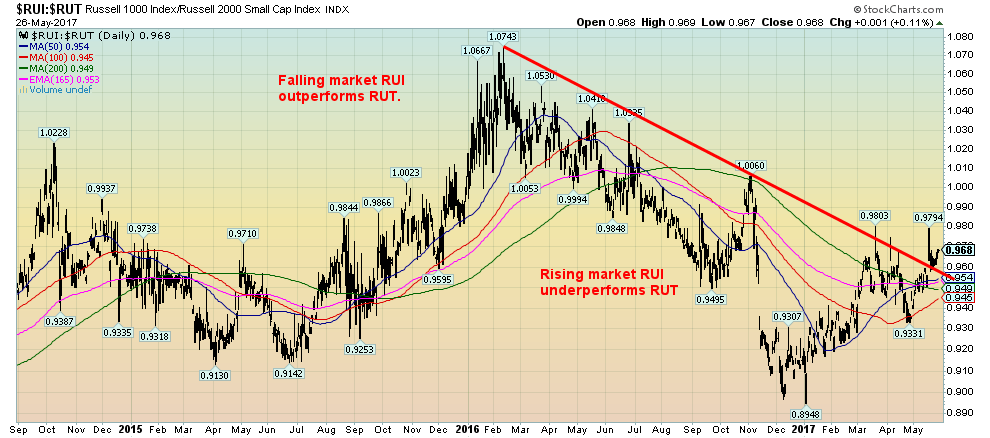
This past week the S&P 500 and the NASDAQ both printed new all-time highs. The DJI is just short of new highs as is the Dow Jones Utilities Index (DJU). But the Dow Jones Transportations (DJT) remain well off their highs and the small cap Russell 2000 is also below its recent highs. Will they join the big cap indices, or is this a potentially meaningful divergence? We can’t answer that right now, but the chart below of the Russell 1000 (that did see new all-time highs) expressed as a ratio with the Russell 2000 suggests the small cap stocks are often the canary in the coal mine.
What the ratio chart suggests is that during falling markets the large-cap Russell 1000 outperforms the small cap Russell 2000. But in a rising market, it’s the small caps that lead the way. That ratio appears to have bottomed back in early January 2017 and it has been rising ever since. The ratio appears to have broken above the down trendline from the top of February 2017. What it suggests is now the large-cap Russell 1000 is outperforming the small cap Russell 2000. And that could be a harbinger of an impending market correction. Or, as we noted, the small cap index could be the canary in the coal mine.
(Source)
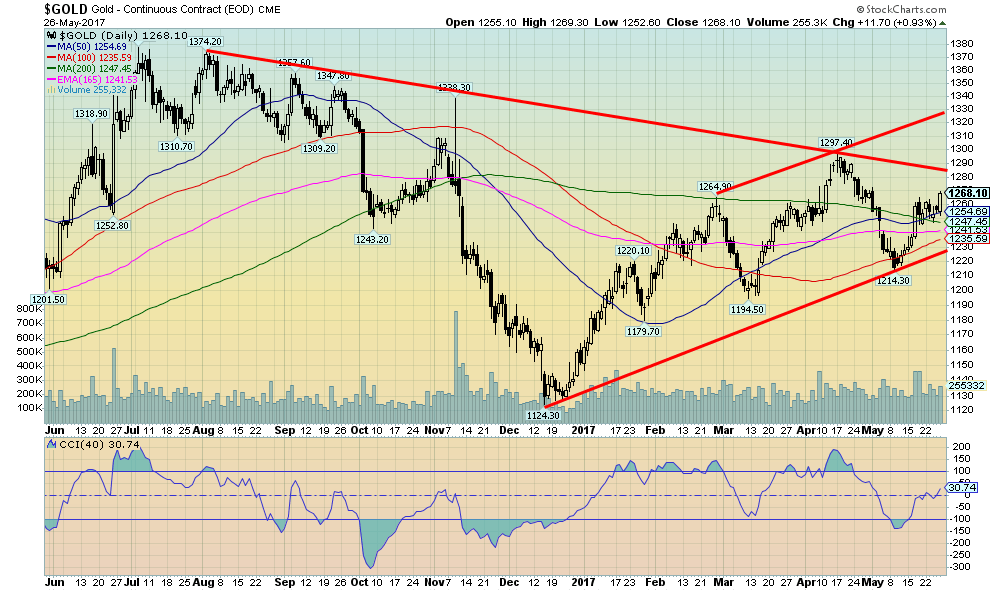
Gold has been trying to clear the next hurdle by taking out $1,265 firmly.
(Source)
Gold closed at the highs of the week hitting $1,269.30. Silver also jumped, hitting a high of $17.38. If gold can sustain over $1,265, then odds favor another run at the recent high of $1,297. Once over $1,300 gold could start an even stronger run to take out the 2016 high of $1,377. The same for silver. Its recent high was seen at $18.65 and the 2016 high was at $21.23. We continue to believe those highs will eventually fall as a powerful rally unfolds. But there will be setbacks along the way.
Could there be a roadblock on the way? It was noteworthy that while both gold and silver enjoyed gains this past week of 1.2% and 3.1% respectively the gold stocks did not follow. Not only did the gold stocks not follow, but they were collectively down on the week with the Gold Bugs Index losing 1.2% and the TSX Gold Index (TGD) down 1.1%. Not surprisingly, our own gold stock portfolio lost 1.1% this past week. In a bull market, we want the gold stocks to lead. So, a down week when both gold and silver were up was somewhat concerning. We note the commercial COT slipped this past week to 28% from 31% as the commercials added about 30,000 short positions. The silver commercial COT also slipped to 31% from 33%. Still, the commercial short position remains well above its lows so this could be just a temporary setback, something that is not unusual in the nascent stage of new up move.
(Source)
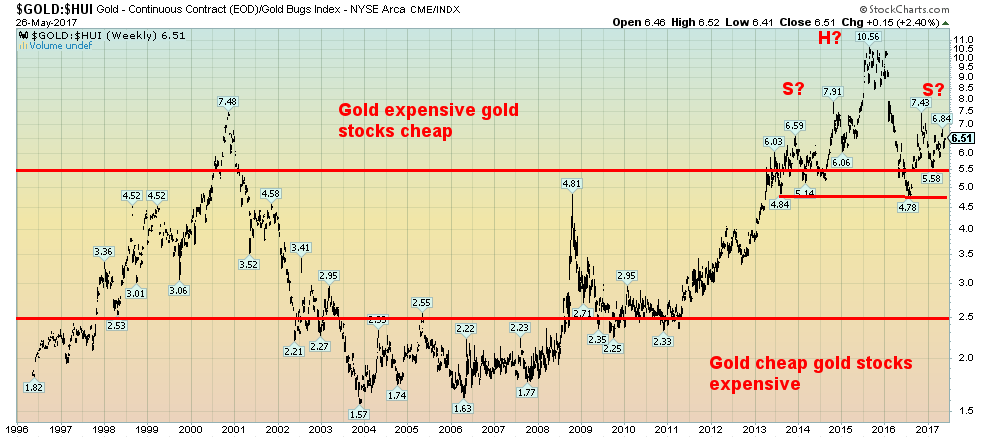
As our chart of the Gold HUI ratio shows, gold stocks remain cheap compared to gold. Note how gold stocks were cheap in relation to gold at the 2000 2001 lows. Gold stocks were expensive and stayed that way for a considerable time from 2002 through 2008. Gold stocks tend to lead in both up and down markets. During the bear market of 2011 to 2015, gold stocks fell sharply and at the recent high in August September 2015, gold stocks had become exceedingly cheap in relation to gold. They remain so today despite the rebound that has taken place.
The ratio may be forming a large head and shoulders top pattern. The neckline appears to be around 4.8 and once broken could project down deep into the gold cheap gold stocks expensive zone. There are many saying that it’s better to hold gold over the gold stocks where all sorts of things can go wrong. Gold has no liability but, historically, is relatively stable while gold stocks are volatile and risky. The highest reward is holding gold stocks but it is also the highest risk. Nonetheless, we are encouraged by the action. Once 2017 is out of the way, we expect gold could embark on a considerable run and challenge once again the highs of 2011 and possibly higher.
—
DISCLAIMER: This article expresses my own ideas and opinions. Any information I have shared are from sources that I believe to be reliable and accurate. I did not receive any financial compensation in writing this post, nor do I own any shares in any company I’ve mentioned. I encourage any reader to do their own diligent research first before making any investment decisions.


Morocco’s Growth Holds at 4.6% as Agriculture Offsets Economic Pressures
Morocco’s economy grew 4.6% in Q1 2026, driven by a strong agricultural rebound offsetting declines in industry. Services expanded moderately...


Abivax Shares Surge as New Trial Data Eases Safety Concerns Over Ulcerative Colitis Drug
Abivax shares surged nearly 36% after positive updated trial results for its ulcerative colitis drug obefazimod reassured investors following earlier...


El Dorado Raises $9M to Expand Cross-Border Fintech Platform
El Dorado, a Latin American fintech improving cross-border financial services, raised a $9 million Series A led by Paradigm with...


Bitcoin Stalls Near $60K as Strategy Moves, ETFs Outflow, and EU MiCA Rules Take Effect
Bitcoin hovers near $60,000 with ETF outflows, while Strategy boosts reserves, sells BTC, and raises dividends to reassure investors. Ethereum...


Cannabis Dominates Global Drug Use: Trends, Risks, and Shifting Markets
Cannabis remains the world’s most widely used illicit drug, with 256 million users in 2024, surpassing all others combined. Growth...
 |
|
 |  |
 |
|
-

 Business1 week ago
Markets Diverge as Oil Falls, Rates Hold, and Inflation Persists
-

 Impact Investing6 days ago
Coastal Cities Lead as Heat Strains Italy’s Urban Livability
-

 Fintech2 weeks ago
Trade Republic Brings Back Human Support and Launches Customer Council
-

 Biotech2 days ago
Eli Lilly Hits $1 Trillion Valuation Amid Strong Bullish Momentum
You must be logged in to post a comment Login