Featured
Preparing for market styles changes market equilibrium
The law of supply and demand dictates how a market progresses in order to achieve market equilibrium.

“There are only patterns, patterns on top of patterns, patterns that affect other patterns. Patterns hidden by patterns. Patterns within patterns. If you watch close, history does nothing but repeat itself. What we call chaos is just patterns we haven’t recognized. What we call random is just patterns we can’t decipher. What we can’t understand we call nonsense. What we can’t read we call gibberish. There is no free will. There are no variables.”
– Chuck Palahniuk – Author – Survivor, Fight Club
History has a funny way of sneaking up on you and biting you in the behind. The philosopher George Santayana said, “those who cannot remember the past are condemned to repeat it.” There are many paraphrases of the same statement.
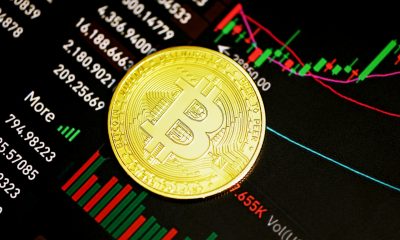
And so it is with markets. Markets are driven by two things—fear and greed. These two fundamental human emotions play themselves out over and over again. The study of markets is just the study of human psychology. When things look really bad, we are all fearful, and when things look really good, we get greedy. Take Bitcoin and the cryptocurrencies as an example. As the market rose, more and more people jumped in figuring they were missing out on the next big thing.
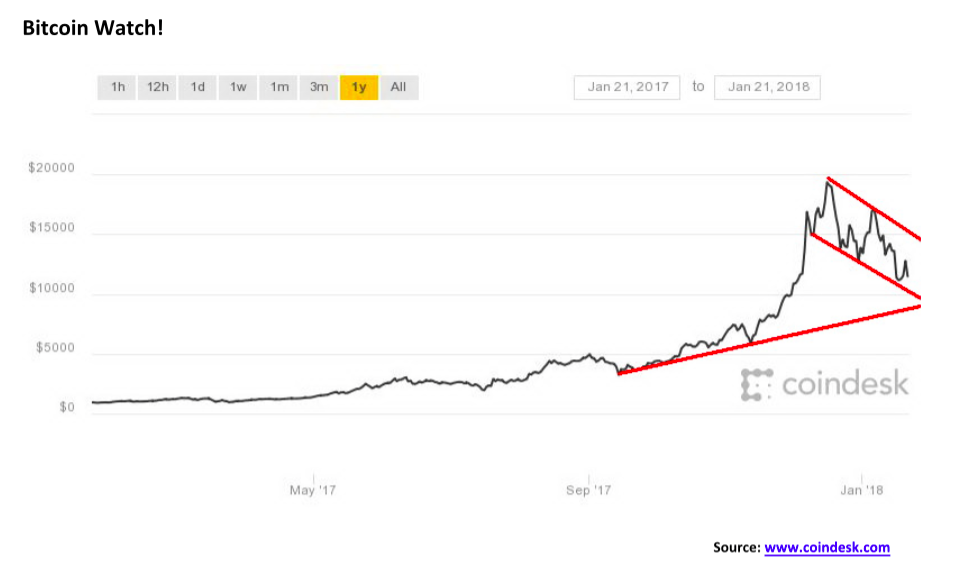
In the past year, Bitcoin rose from under $1,000 to almost $20,000. The market cap soared to over $300 billion. Hundreds of new cryptocurrencies came on stream. There were instant millionaires because their cryptocurrency soared. Ads proliferated to get in on the next big thing so that you don’t miss out. Then it crashed, and suddenly, Bitcoin and other cryptocurrencies were down 50% or more from their highs. Will they recover or fall further? We don’t know, and that is argumentative, but what we do know is that history repeated itself with the rise fueled by greed and the collapse fueled by fear.
As a technical analyst, I am taught there are three basic premises on which the technical approach is based:
- Market action discounts everything.
- Prices move in trends.
- History repeats itself.
The last time fear was at its maximum was 2009 following the financial crash of 2008. With the exception of corrections as a result of the EU debt crisis of 2011 and the end of QE in 2015, the market has been rising steadily on the premise that the global economy is growing—albeit somewhat grudgingly—some corporations have recovered, while are making record profits, and tax cuts will fuel a further rise in the market. Everything else is just noise. The trend is firmly to the upside. But invariably, the market gets greedy and moves to levels that are no longer supported by the fundamentals. Then the collapse and panic will follow. A few will get rich. Many will be left poorer.
So what will be the trigger that changes the course of the market? Some triggers are quite obvious, like the Watergate crisis of 1972–1974 and the Arab Oil embargo of 1973 that led to the stock market collapse of 1973–1974 as the Dow Jones Industrials (DJI) fell 45%. Overlooked in that collapse was what was known as the “Nixon Shock” as the Bretton Woods system came to an end and a massive U.S. Dollar devaluation under the Smithsonian Agreement got underway. What may have started as a snowball became an avalanche.
The 2008 financial crisis came about as a result of the housing bubble and the collapse of the structured finance market, including subprime loans and credit default swaps. The collapse of two Bear Stearns hedge funds that were involved in mortgage-backed securities (MBS) in June/July 2007 was the start of a financial panic that saw the disappearance of numerous banks and some venerable old Wall Street investment banking firms, Bear Stearns and Lehman Brothers. As Wall Street collapsed, Main Street lost their homes and went bankrupt. The DJI fell 55%. Wall Street was bailed out. Main Street was left to fend for themselves.
This past week saw the collapse of Carillion PLC, the UK’s second largest construction company. Carillion PLC’s collapse could reverberate around the world. The company has 43,000 employees worldwide, including 6,000 in Canada. The company is involved in an estimated 450 projects, including numerous government contracts, and provides maintenance services such as cleaning and catering to over 900 schools, prisons, libraries, and others. The company has over US$2.6 billion in debt and upwards of US$1 billion pension deficit. Its market cap has collapsed by 95%. Already numerous sub-contractors are being forced out of business by their banks because of the default of payments owing from Carillion and resulting in the layoffs of more people. The UK government has said they won’t be stepping in to rescue Carillion.
Is Carillion the canary in the coal mine in a debt-laden world? Debt has reached astronomical proportions, estimated by the Institute of International Finance (IIF) at over $233 trillion, a rise of $80 to $90 trillion since the financial crisis of 2008. Naturally, we don’t know, but it is a potential “shot across the bow.”
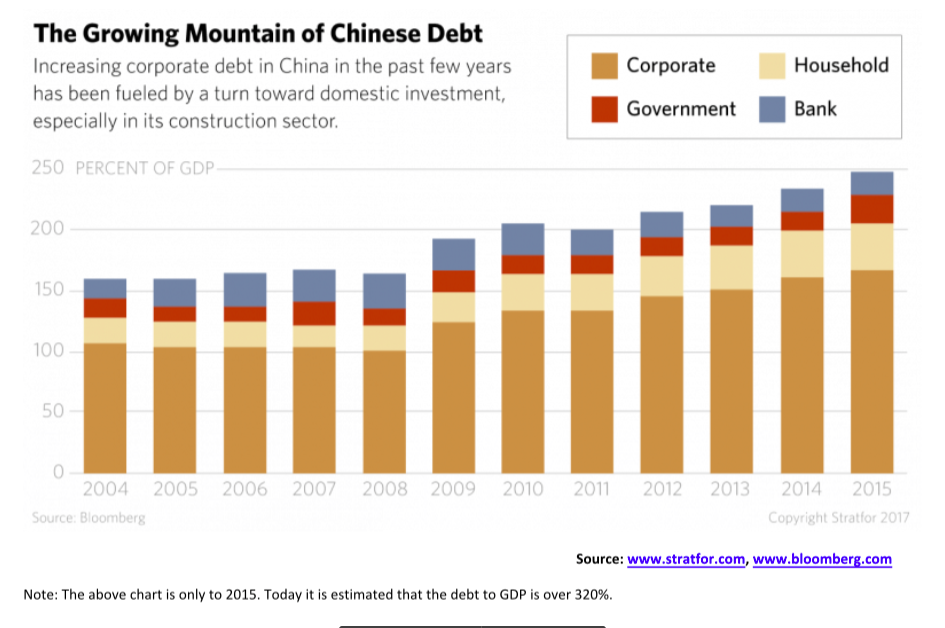
China has seen a massive growth of its shadow banking system, particularly since 2008. China is now struggling under a mountain of debt, particularly in its corporate sector as a result of the massive growth of its real estate sector. Total debt that was barely above 150% of GDP back in 2008 is today as much as 320% of GDP. China has taken steps to try and cool the bubble real estate sector including tightening the shadow banking sector and putting in place regulations. With upwards of half of the corporate debt maturing in 2018, a financial collapse in China could have global implications. At best, the Chinese government would hope to contain any collapse and given that China’s national debt to GDP is under 45% vs. the U.S.’s national debt GDP of almost 105% the Chinese government has room to maneuver.
Here in Canada, there is a growing concern about the housing market as the “punch bowl” is pulled away. The Bank of Canada (BofC) has now hiked interest rates three times in the past year. The bank rate now stands at 1.25%. That is still under the annualized rate of inflation, which most recently stands at 2.1%. Rising interest rates, coupled with tightened mortgage rules, could have a negative impact on Canada’s hot housing market, particularly the overheated markets of Toronto and Vancouver. Canada, surprisingly, has the highest household debt to GDP in the world at 101%, according to the OECD. The U.S. stands at 80%, and the UK stands at almost 88%. There are signs in the UK that the hot London housing market is starting to unravel. Consumers, it seems, are always too overleveraged at the top of the market.
© David Chapman
The dysfunction of the U.S. government is coming to a head over a stopgap spending bill. The rancor in the U.S. Congress and Senate has only grown since President Trump’s alleged comments about Haiti and African countries (now being called Shithole gate). The result is that rather than pushing off the debate once again for what would only amount to another two or three weeks, it is coming to a head now. No wonder China’s Dagong Global Credit Rating Co. (DGCR) has downgraded the U.S.’s credit rating to BBB+ from A-. Dagong, a major rival to the big three of S&P, Moody’s, and Fitch, cited the recent tax plan and the potential for sharply increasing the U.S. debt. Dagong gave the U.S. sovereign debt a negative outlook as well. Furthermore, they cited the U.S. for “political deficiencies.”
Failure to pass the stopgap would mean all non-essential government employees could face an indefinite furlough. It would also mean the debt ceiling is not increased even though the U.S. has already surpassed the most recent debt ceiling. Each side is blaming the other for the impasse, but the judge would come in the markets where the U.S. Dollar has fallen, gold has moved higher, and the U.S. stock markets are well hesitating following another record run.
Then, there is the ongoing investigation into the President Trump’s links to Russia where recent testimony has alleged that the Trump organization may have engaged in money laundering, using properties bearing the Trump name. This included the former Trump International Hotel and Tower in downtown Toronto. The testimony followed statements attributed to Trump’s former chief strategist, Steve Bannon, who had suggested that the Mueller investigation would lead to allegations of money laundering. The Trump organization had routinely been rejected for bank loans in the early 2000s following a series of bankruptcies. Coming to the rescue were Russian and Ukrainian banks with potential ties to the Russian Mafia. The question now is where does this go and will it blow up, leading to more indictments and right into the heart of the U.S. presidency.
Lurking in the background, however, is a story that Republicans are prepared to release a memo detailing extensive Foreign Intelligence Surveillance Act (FISA) court abuse that could impact the Mueller investigation, the FBI, and the Department of Justice (DOJ). Whether this allegation is true or not is beside the point in the increasingly “Game of Thrones” scenario that is unfolding in Washington. The memo is alleged to show illegal collusion between the Obama Administration, the FBI, the DOJ, and the Clinton campaign.
One could argue that these are all just snowballs. But as we have seen in the past, snowballs can suddenly come together and morph into an avalanche. Then, there are the ongoing global geopolitical tensions with North Korea, with China, in Eastern Europe along the Russian border, in Syria where U.S. troops are becoming entrenched, and with Iran. China is leading the way to end U.S. dollar hegemony and the petrodollar as they launch the trading of oil in yuan, another source of friction with the US. One could put together a picture that is potentially far bigger than any previous crisis seen in 1973–1974, 1980–1982, 2000–2002 and 2007–2009.
Does history repeat itself? One response, attributed to Mark Twain, is “History does not repeat itself, but it does rhyme.” Many balk at the notion that history can repeat itself. But as we have often seen over and over again, the people, events, and reasons may change, but the results are the same. Debt builds, becomes unmanageable, and collapses. Stock markets soar as fear turns to greed, and then, it turns back to fear. We have seen this picture before—many times—as the same patterns play themselves over and over again.
All of this makes the “Stormy Daniels” story seem rather mundane. Investors should be wary.
© David Chapman
Is the crypto party over? From a high of $19,783 on December 17, 2017, to a low of $9,199 on January 17, 2018, bitcoin and many other cryptocurrencies fell over 50%. One can only term this a crash, a crash that many believed was inevitable. In the space of a month (actually it was more like three days), over $300 billion in market cap was wiped out.
So what sparked the crash, a stomach-churning event for many new investors. For the skeptics, it was no surprise when the governments of China and Korea were hammering on shutting down exchanges, hammering on banks and their relationships in the crypto market, and hammering on speculators in the market. We have noted all along that at some point, governments were going to get involved as the potential for money laundering and tax evasion, in particular, were just too great. And when the governments got involved, it was going to put a damper on trading. That it was the Chinese and the Koreans that appear to have started the ball rolling might be a surprise, but it was going to come to the U.S., Canada, the EU, and elsewhere as well.
Wildly moving markets attract speculators whose only interest is in making money. The introduction of crypto futures may have expanded the market, but they brought in the potential for numerous games to be played by sophisticated speculators who understand the game and arbitrage between markets. They don’t care whether the market goes up or down as long as it is volatile. The first expiration of bitcoin futures occurred this week, and the market was quite volatile.
Finally, the market has seen a huge influx of new users, and in some cases, they were overwhelming the exchanges. Many of these investors were novices attracted by the potential to get rich quick as the numerous ads touted. They were also leveraged with an estimated 20% of funds coming into the market having been borrowed. Leverage works great in a rising market but can wipe you out in a falling market. And fall it has.
There were stories that trading was halted in some cryptos such as Kraken and others who just effectively closed shop like BitConnect. Investors were left holding the bag, unable to cash out or get out.
But we have been noting the potential for this to happen for weeks. Anything that goes up as fast as bitcoin and the other cryptos did was just an accident waiting to happen. It is no surprise, however, that many are telling everyone to hold on or to get back in or that this is a great time to buy. They should be ignored.
There are, or were, over 1,400 different cryptocurrencies listed on Coin Market Cap. Many of these cryptos were never going to survive, and some like Dogecoin were in some respects just a hoax, or parody as it was called, and others like Dentacoin were just presented as a unique business opportunity. Some opportunity. Dogecoin and Dentacoin have both fallen to roughly half their peak.
This past week was the cryptocurrency conference in Miami. Naturally, there was considerable enthusiasm and a bullish outlook for cryptocurrencies even though the market had fallen. Bullish elation takes some time to wear off. The market has still not fallen far enough to cause the bulls to really panic and realize that they are trapped.
Bitcoin needs to regain back above $12,500 and to hold above that level to even begin to suggest that this bounce is no more than a “dead cat bounce.” If real panic begins to grip the market, and that can’t be dismissed, then based on previous crashes in history where massive speculation gripped markets, bitcoin and others will lose upwards of 99% of their value. And that is for the ones that will survive.
© David Chapman
© David Chapman
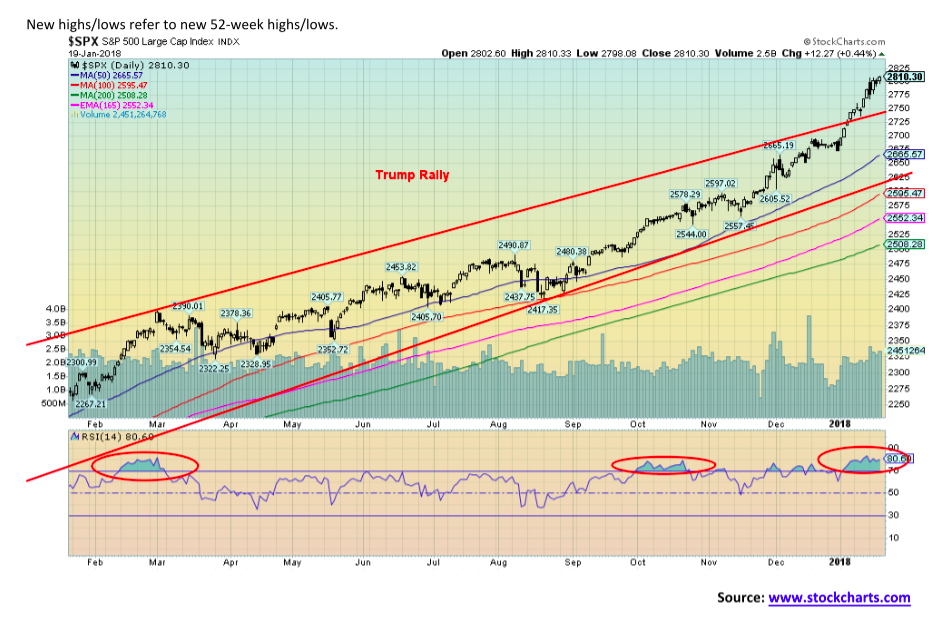
The climb continues. Where it stops, nobody knows. The RSI indicator persists above 80 on the daily, weekly, and monthly charts. Sentiment indicators sit at record or near record highs. On that basis alone, it is extremely difficult to find a bear anywhere or at least one that is still alive. Market extremes may be a signal that a change is coming, but it doesn’t guarantee that it will happen. The market has gone parabolic. Markets going parabolic are what one sees at the end of the cycle, not at the beginning. But it matters not as long as it is going up. And indeed, there are few signs that this is over it unless something comes out of the blue and knocks the market for a loop.
On Friday, the S&P 500 and the NASDAQ both made new all-time highs (again), but the Dow Jones Industrials (DJI) did not. A minor divergence. The Dow Jones Transportations (DJT) made new highs earlier in the week but reversed and actually closed lower on the week. Another divergence. But is it meaningful? Not yet anyway. Sentiment and the markets for cryptocurrencies peaked in mid-December, and now, they are down 40%. At the time, we noted the extreme positive sentiment towards cryptocurrencies. Now, it is not so much, and losses have been in the billions.
Other markets have been making new highs as well. China’s Shanghai Index (SSEC) leaped to new 52-week highs this past week. But here’s a reminder: that index remains down almost 33% from its 2015 all-time high. Japan’s Tokyo Nikkei Dow (TKN) also jumped to new 52-week highs this past week. That’s great, but it is still down 39% from its all-time high seen in 1990! The present may appear to be great, but when measured against the past, it is not so great. The UK’s London FTSE made new all-time highs a week ago but finished this week to the downside.
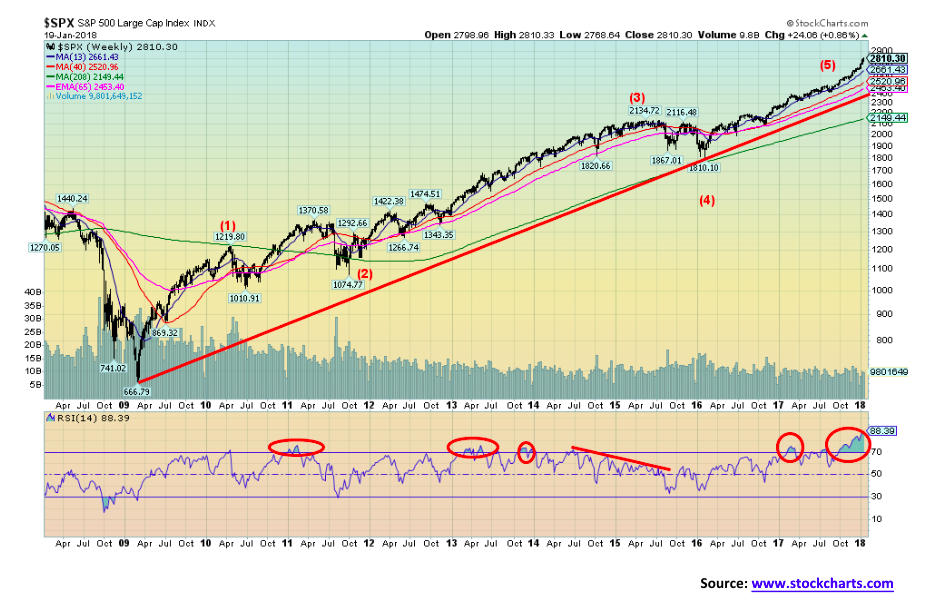
Based on the 2015/2016 market correction, our next target for the S&P 500 is 2,980. Currently, we are in 2,810. It doesn’t mean we have to achieve that target. Indeed, failure would probably indicate that we have finally topped. The best we can say right now is a break under 2,750 would most likely indicate at least a temporary top. A break under 2,675 and especially under 2,550. But a major breakdown would not occur until we broke under 2,250. Otherwise, it is up, up and away. Where it stops, nobody knows.
© David Chapman
Here is the big picture once again from the 2009 financial crisis low. The market has gone up in five distinct waves. The first correction was the EU debt crisis of 2011, while the second correction occurred in 2015/2016 as QE came to an end. Both corrections were under 20%, thereby not constituting an official bear market. This year would mark the 9th anniversary of the bull market 2009–2018. If we survive past June 2018, this bull would be record-setting. With a weekly RSI at 88+, that is also record-setting. We can warn, but the reality is we need a trigger to change the direction.
© David Chapman
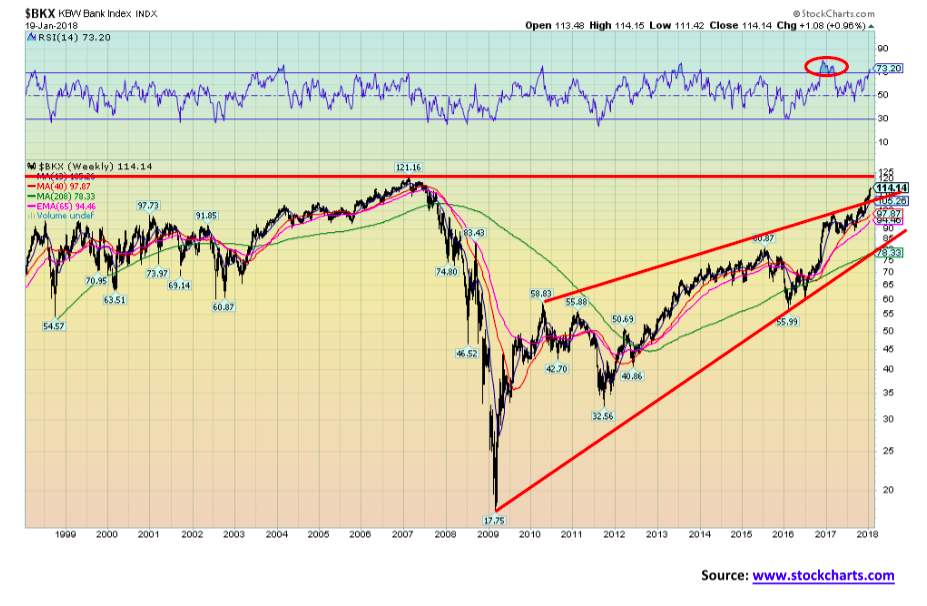
The fact that the KBW Bank Index (BKX) remains below its all-time high seen in 2007 is a source of amazement given the market keeps making new highs. Maybe this will become a multi-year double top although that kind of pattern is extremely rare. The BKX appeared to be forming a huge ascending wedge triangle up from the 2009 low. However, we have now overthrown that pattern thus negating it. Still, this index could turn down quickly if it were to fall back under 100. Note that weekly extremes on the RSI are not remotely in the same category as the S&P 500 although at 73 it is high but not extreme.
© David Chapman
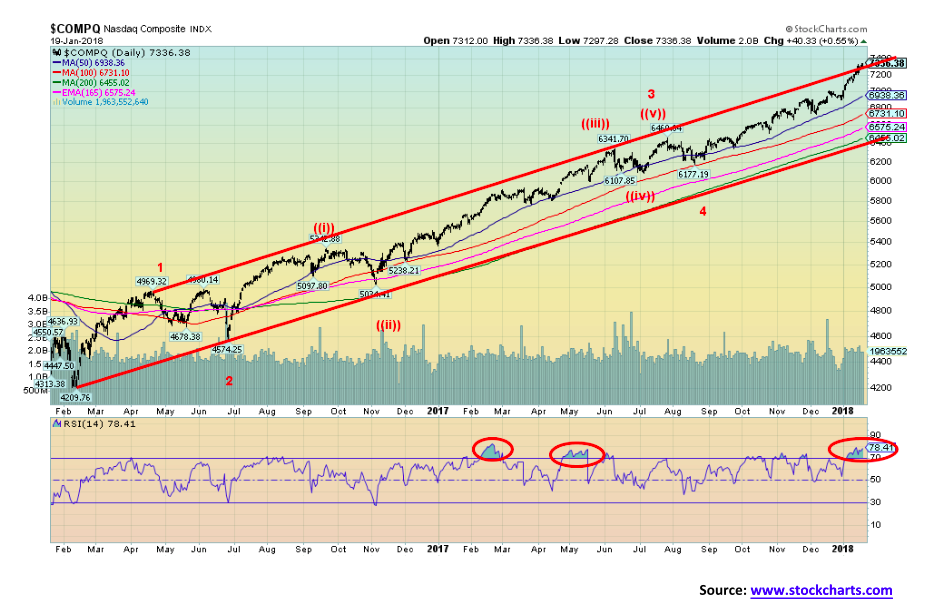
The NASDAQ also keeps making new all-time highs. We have labeled the NASDAQ with Elliott Wave International’s wave count. While we do defer to their expertise, we can’t say we are overly comfortable with their labeling of minor waves 3 and 4. We have never thought that particular wave 4 was deep or long enough. As well, the minute wave ((v)) was quite short in length. That has given us the thought that we might see a sudden sharp pullback but say under 10% in all then another run to new highs or the proverbial double top to form the final wave up. The current market has no distribution patterns that are typical of a top. Even the 2000 and 2007 markets topped then had a sudden fall only to be followed by one more wave to new highs or just shy of the previous top to form that final top.
© David Chapman
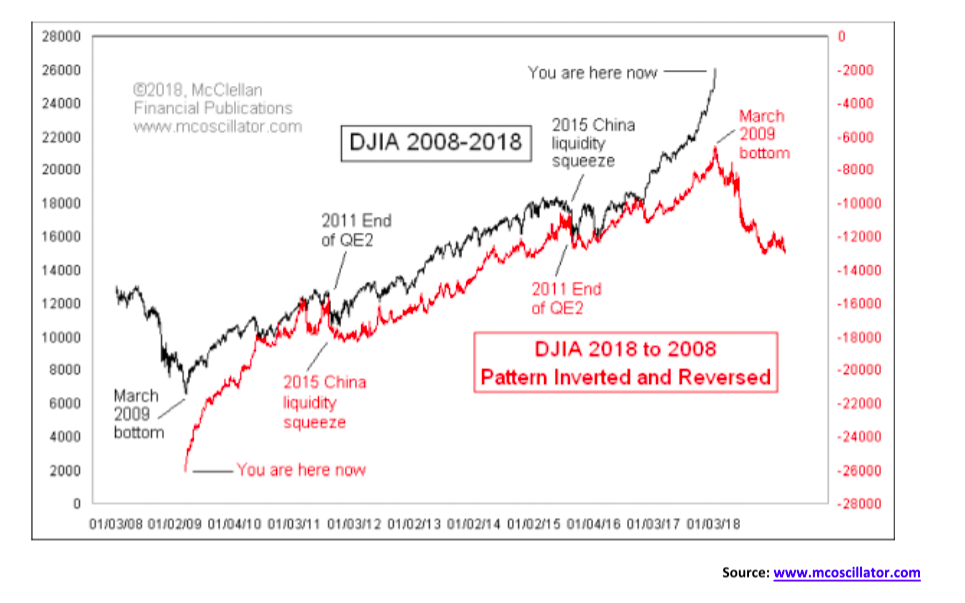
Thanks to Tom McClellan of McClellan Financial Publications and his interesting charts. We found this one rather intriguing. What it does is reverse and invert the DJI from the 2009 major bottom. What Tom calls the 2015 China liquidity squeeze we have noted as the end of QE. Tom calls the end of QE2, while we note it as the EU debt crisis. The two do line up rather neatly. It all may just be a remarkable coincidence, but as we have noted in technical analysis, patterns repeat themselves even if they are upside down and backwards. Of course, if we take that 2009 bottom inverted and reversed, we know what comes next for the current market: a top followed by a sharp decline. As Tom noted, this is a fun chart. And so far, it is working. The bulls had better hope that the comparison doesn’t continue. Next month would mark the 9th anniversary of the March 2009 bottom. Now, wouldn’t it be interesting if we were making a high? However, as Tom noted, his #1 rule of technical analysis is that “a phenomenon will remain in effect only until noticed.” The bulls hope that works this time.
© David Chapman
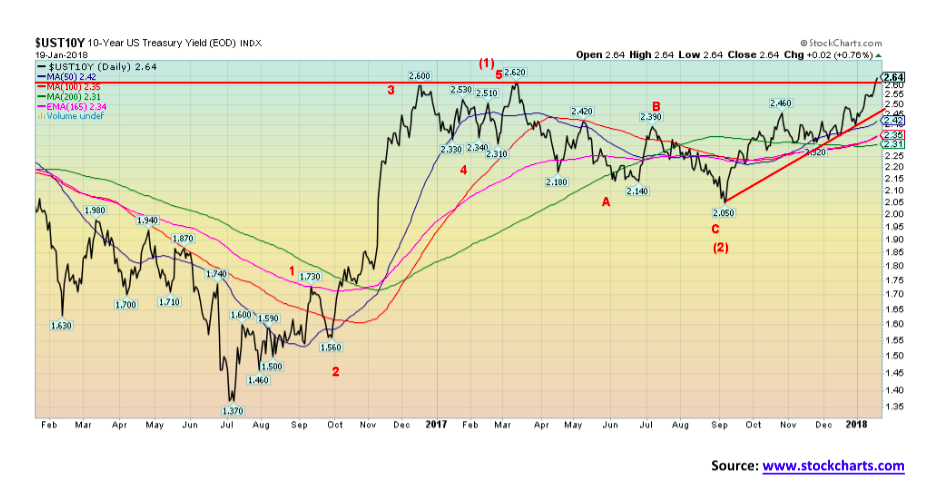
With a government shutdown looming and China saying they are pulling back on buying U.S. Treasuries, this is putting upward pressure on U.S. bond yields (downward pressure on bond prices as prices move inversely to yields). This past week, the U.S. 10-year Treasury note broke out above its December 2016 and March 2017 highs at 2.60% and 2.62% respectively closing at 2.64%. The breakout to new highs suggests a move to as high as 3.20% for the 10-year. That would shake bond markets as bond prices could easily fall another $10 or more from current levels. It has been some time since bond dealers have experienced a strong bear market in bonds. Bill Gross of Janus Investments has been warning of this for some time now. Smart bond funds have cut back their duration and are largely in short-term bonds. The Fed has also indicated they intend on hiking the key Fed rate three more times in 2018. At what point does it cause the market to tip over or cause problems with the mountain of debt that is outstanding.
© David Chapman
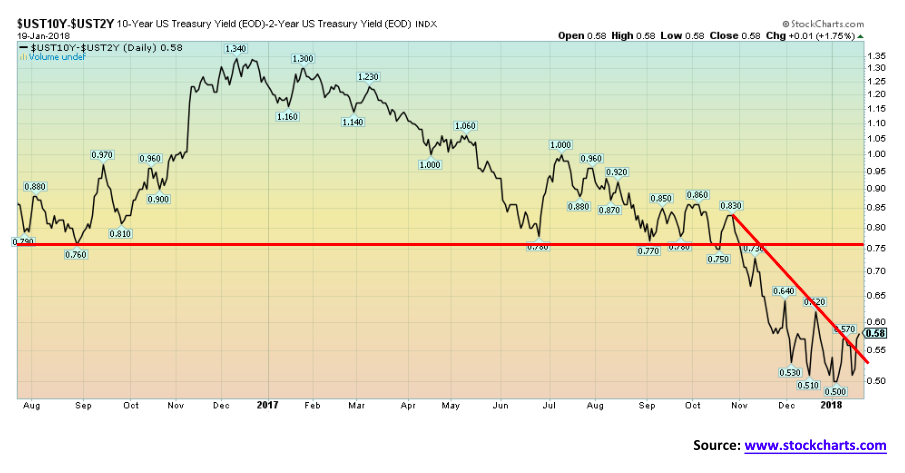
The 2–10 spread widened somewhat this past week and also broke the steep downtrend line from October 2017. The past few weeks’ action did seem to indicate that a corrective up wave could occur. We could get as high as 0.70% on this rebound. We doubt very much it would go much higher. Still, at 0.58%, the 2–10 spread is not indicating any recession. Before both the 2000–2002 and 2007–2009 recession, the 2–10 spread had turned negative. We are still a long way from negative spreads.
© David Chapman
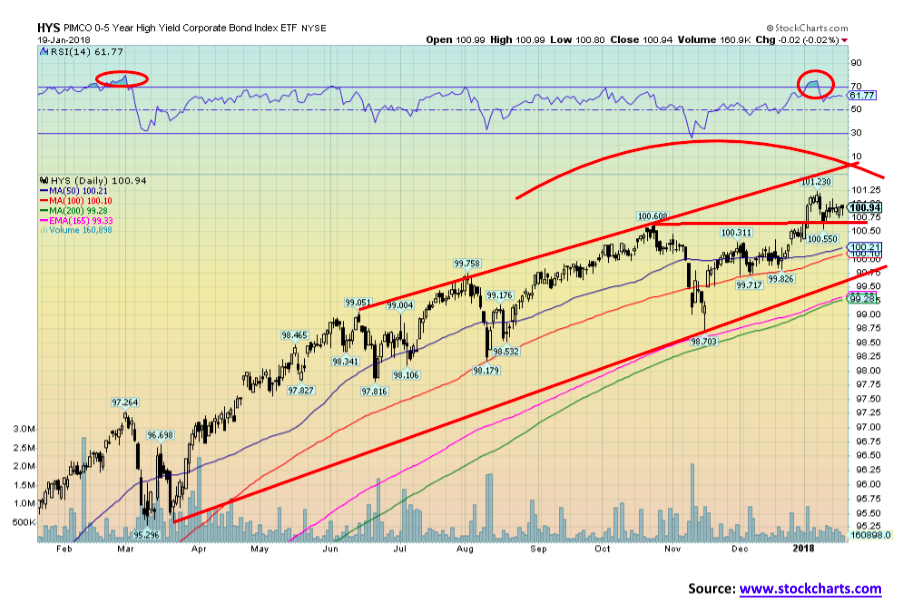
Another indication of impending trouble in the bond markets is for the high-yield market to suddenly fall. While we could argue that the PIMCO 0–5-year high yield Corporate Bond ETF is forming a top pattern, it is holding up remarkably well. Spreads with U.S. Treasuries remain at current low levels. Until we see this ETF fall sharply and spreads with U.S. Treasuries widened, we need not worry too much about an impending recession. But we do note this can change quickly if things start to get out of hand. Given the government shutdown and China easing on buying U.S. Treasuries, it may actually help the corporate bond market where dealers believe there are better value and even safety.
© David Chapman
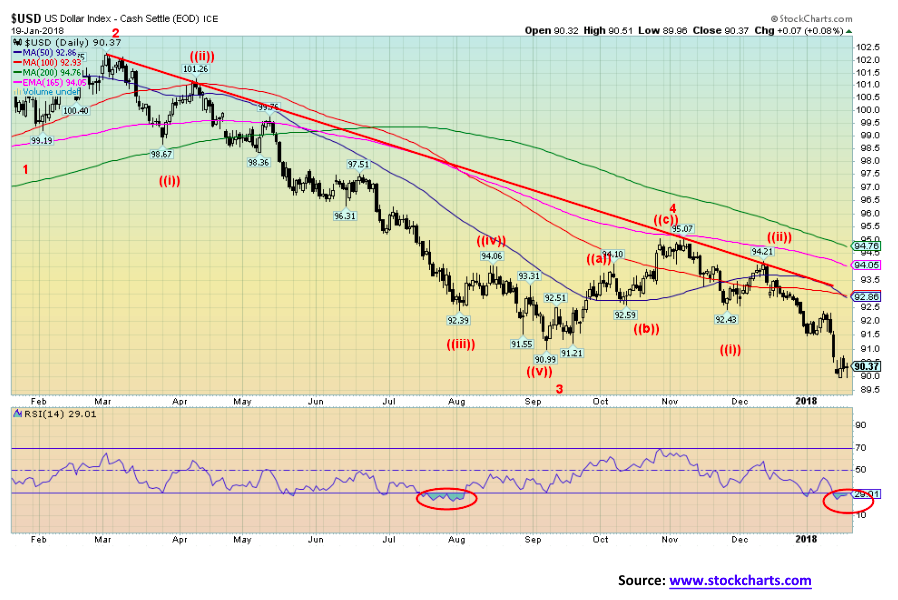
For the 6th consecutive week, the US Dollar Index fell, this time losing 0.4%. The main beneficiaries were the Euro gaining 0.1% and especially the Pound up 0.9%. The Japanese yen also gained about 0.2%. The euro and the pound continued their recent runs, once again posting new 52-week highs. The US Dollar Index did the opposite, posting new 52-week lows. The US dollar is being driven down by fear of endless deficits as a result of the tax reform passed by the Trump Administration, a buyer’s revolt against U.S. Treasuries, and the ongoing dysfunction of the Trump Administration.
Technically, the US Dollar Index appears to be unfolding in a 5th wave down from the highs of almost 104 seen back in January 2017. Interesting that the US Dollar Index has almost been the mirror opposite of the U.S. stock markets that have continually been making new highs throughout 2017 and into 2018. The US Dollar Index has been continually falling, making new 52-week lows. Currently, the US Dollar Index is somewhat over-bought with an RSI below 30, but that doesn’t guarantee a rebound. If this is the 5th wave down, we are in the 3rd wave down from the November 2017 high. The potential targets for the 5th wave down are for a decline to 86.90. Unless something shifts the perceptions emanating from the U.S. government, the odds are that irrespective of any bounce that might develop the US dollar has further to fall.
© David Chapman
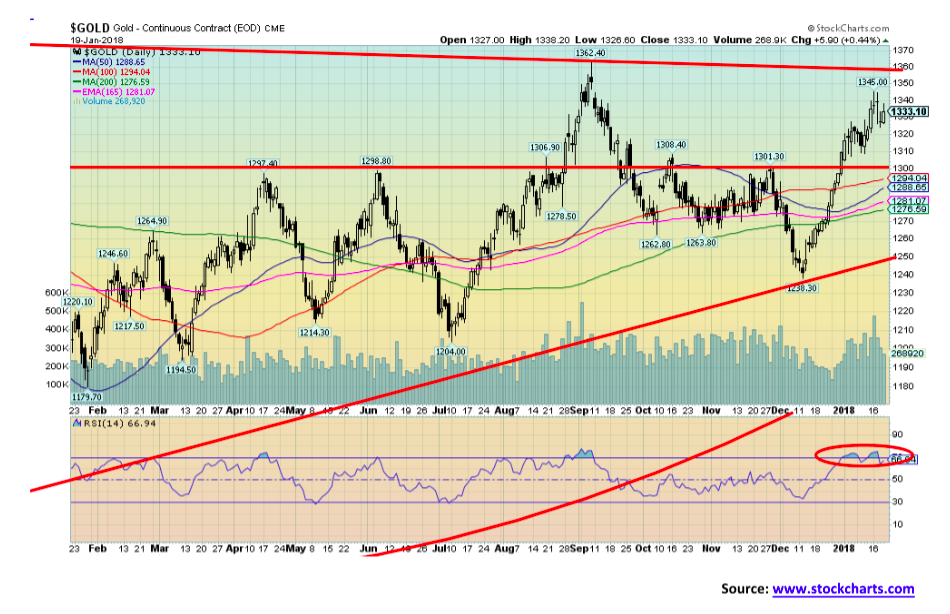
Gold’s recent winning streak was broken this past week despite the weak US dollar. It is possible that gold has completed its first wave up the December 2017 low of $1,238. Overall, we have seen a solid $100+ move to a high of $1,345. A normal correction could see gold pull back to $1,300 to $1,310 without breaching anything major. Only below $1,290 would the pullback have some concern. We have, however, noted a number of divergences that are of some concern. First and foremost, while gold has taken out its October 2017 high, silver has not. Nor have the gold stocks as measured by the Gold Bugs Index (HUI) and the TSX Gold Index (TGD). The weak US dollar has also meant gold as measured in euros and pounds has also not taken out the October 2017 high. Gold has taken out that high in Cdn$ and Swiss francs but barely. Only in Japanese yen has gold made serious progress, not only taking out the October 2017 but recently making new 52-week highs and new 2-year highs. Ahead lie the September 2017 high at $1,362 and the July 2016 high at $1,377. Once gold takes out $1,360, not only should those highs fall but gold should then make a run to $1,400 and possibly higher. For the past five years, gold has been making what appears to be a huge head and shoulders bottom pattern. Our next chart shows that pattern.
© David Chapman
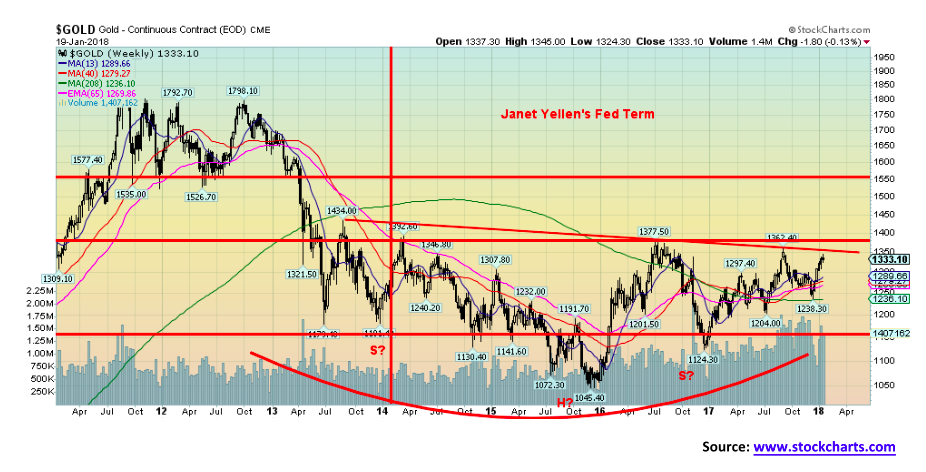
Here is gold shown through what has now amounted to a 6-year bear market. This is a fairly lengthy period for gold to be so weak. Grant you, before that, gold had experienced to what amounted to a 10-year bull market from 2001–2011 where gold gained at the top over 660%. Since the beginning of the new century, gold has been the top performer although one would never know that given the performance of the past several years. Nonetheless, a potential compelling pattern of a huge head-and-shoulders bottom has been forming on gold with the head seen at the 2015 low. A firm breakout above $1,360, the neckline, could lead to a run that takes gold up to as high as $1,750. The current economic, political, and geopolitical conditions are, we believe, setting the stage for a potentially strong run. Things, as they say, could get interesting. Obviously, one would not want to see the December 2017 lows of $1,238 taken out on any pullback. Odds of that happening are low to nil at this time.
© David Chapman
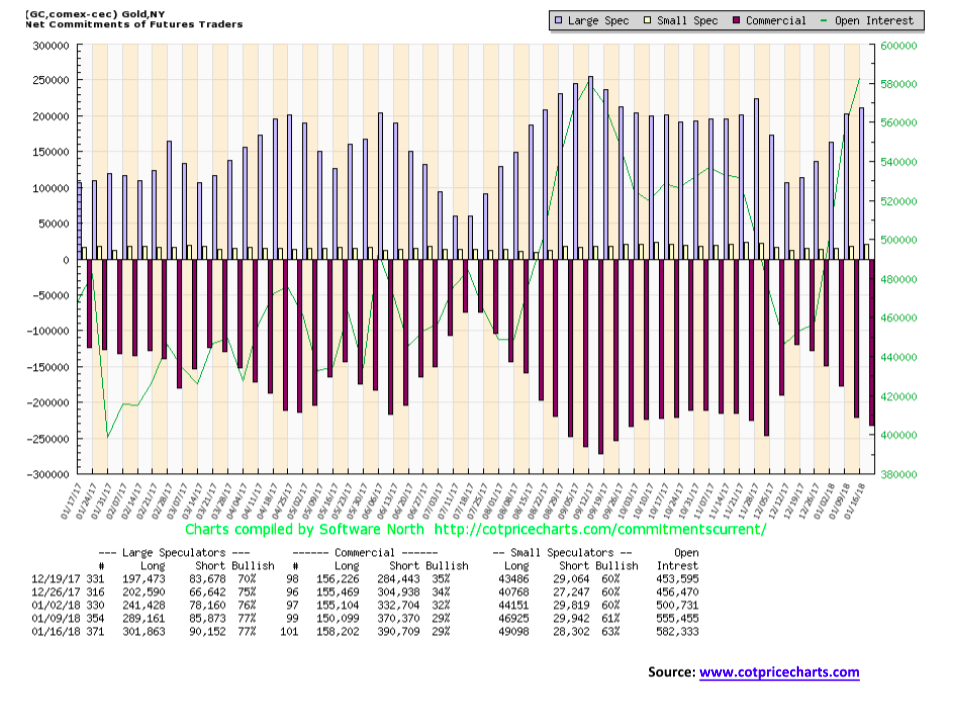
The commercial COT remained largely unchanged this past week at 29%. Short open interest did rise roughly 20,000 contracts, but long open interest was also up, gaining about 8,000 contracts. For the large speculators (hedge funds, managed futures, etc.), their COT also remained unchanged at 77%. While the large speculators’ COT did see a rise in long open interest of over 12,000 contracts, their short open interest also was up, gaining just under 5,000 contracts. While the commercial COT is somewhat more bearish than it had been, it is still not at levels that might suggest a major top in place. The silver commercial COT is not as negative as gold, sitting currently at 37%, also unchanged on the week. There was little in the way of movement, either short or long, for commercials in the past week. The large speculators’ COT for silver was also unchanged at 65% as they trimmed both long and short open interest by roughly 4,000 contracts each. Despite the weakness of silver vis-à-vis gold, the silver COT is more encouraging overall and does not suggest any major drop ahead of us.
© David Chapman
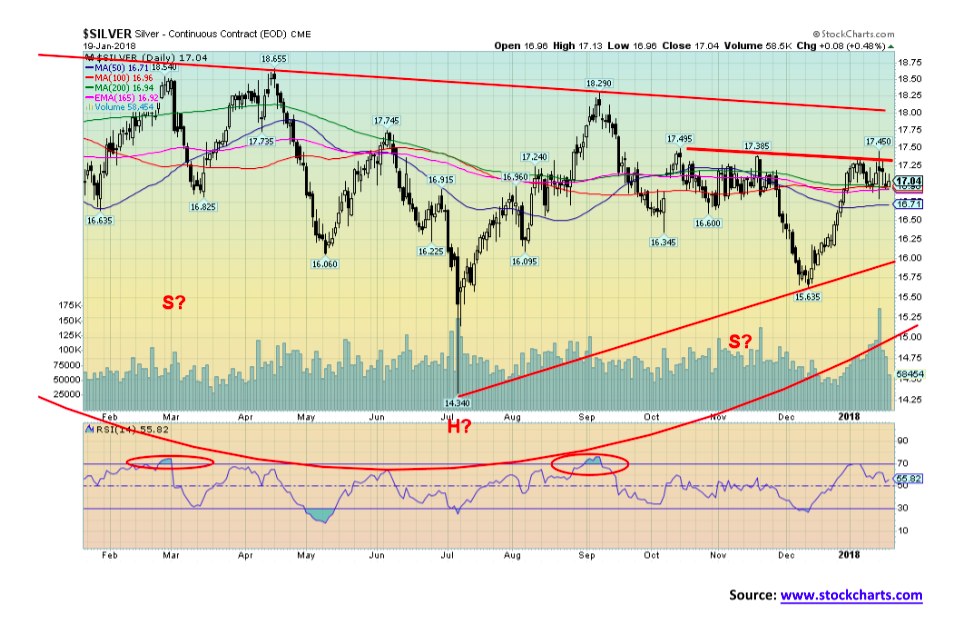
As we have noted, silver has been weak compared to gold and has still not taken out its October 2017 high at $17.50. The high so far is $17.45. Odds are it will happen. As with gold, silver has been making what appears to be a compelling head and shoulders bottom pattern over the past several months. The neckline is currently at $18, and a firm breakout above that level could suggest a move to $22.30. This potential remains in place as long as any pullback can stay above $16.70 at least initially. More important support can be seen down to $16.35 and $16.00. The recent up move for silver did not see it reach as high overbought levels as did gold. This is positive going forward.
© David Chapman
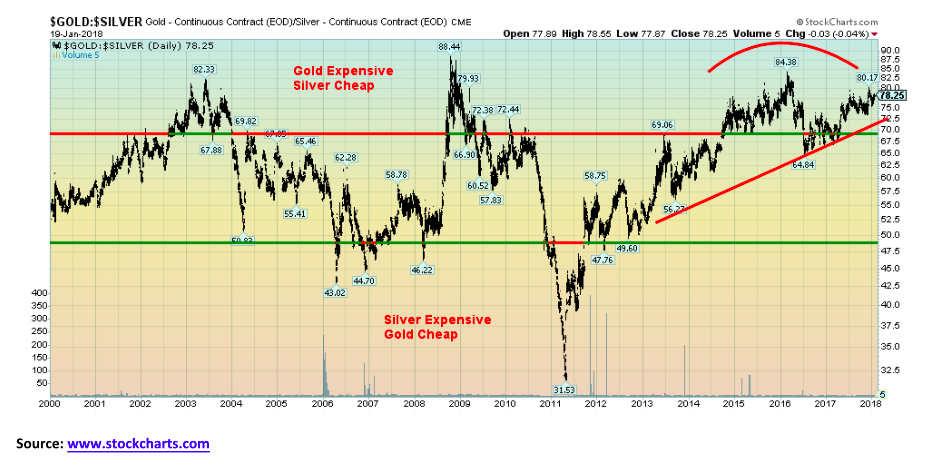
Silver remains cheap when compared to gold. Since 2000, whenever the gold/silver ratio exceeds 70, it signals that silver has become quite cheap compared to gold. This condition has been largely in place since 2014. It is one of the longest periods we have ever seen where silver has stayed so cheap when compared to gold. Indeed, silver becoming expensive compared to gold has been rare in the past 18 years. But that doesn’t mean we can’t reach those levels once again. We continue to favor silver over gold.
© David Chapman
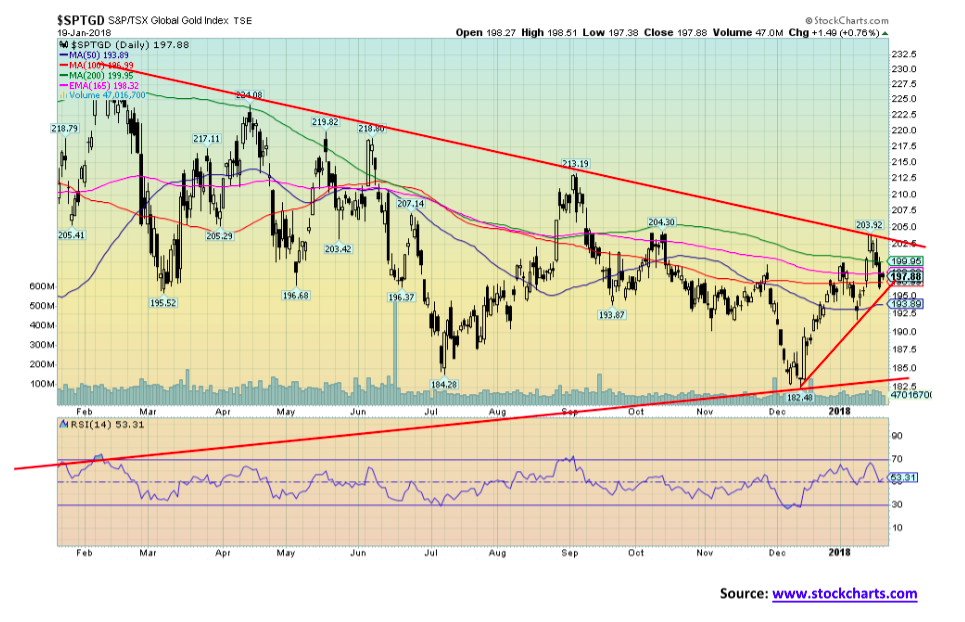
If silver has struggled, then the gold stocks have really struggled. The TSX Gold Index (TGD) came close to taking out its October 2017 high recently but fell just short. We thought that the TGD could be finally breaking out here a week ago, but it fell back once again. The TGD remains down some 56% from its all-time high set back in 2011. The Gold Bugs Index (HUI) has performed even worse and remains down some 69% from its 2011 highs. Misery has defined gold stocks. Gold stocks are usually leaders when the market is rising (and falling as well). But leadership has been woefully absent from the gold stocks thus far. That is why we believe they are exceptionally cheap at these levels. The situation won’t stay that way forever. We continue to need a firm breakout over 202/205 to suggest higher levels for the TGD. Once the TGD firmly busts above 205, there is potential for a rise to 310/320. That would be encouraging. In the interim, the TGD continues to form a large bottom pattern. What we need is a spark.
© David Chapman
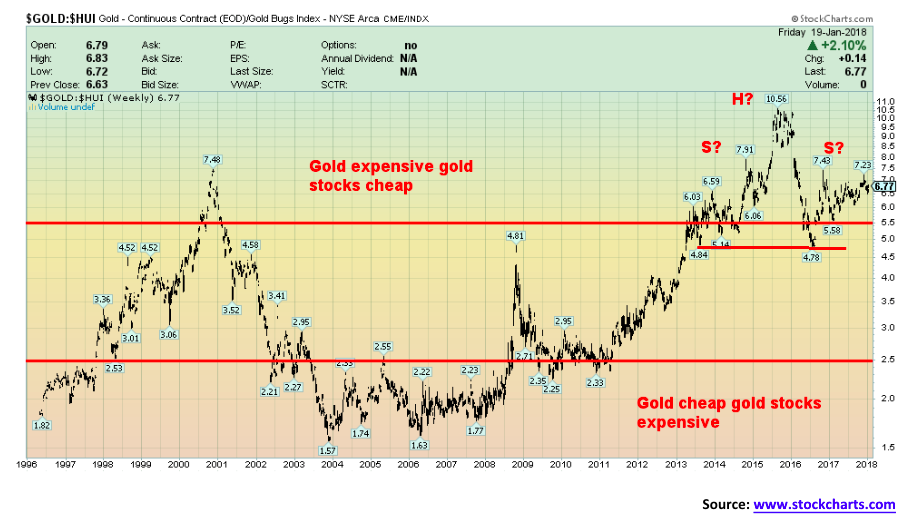
Here is a long-term chart of the Gold/HUI ratio. We used the HUI rather than the TGD as both gold and the HUI are expressed in US dollar. As with the gold/silver, ratio we have never seen such a prolonged period where gold stocks have remained cheap against gold. The Gold/HUI ratio still appears to be forming a huge head-and-shoulders top with the potential for it to fall to levels seen during the 2003 to 2008 period.
© David Chapman
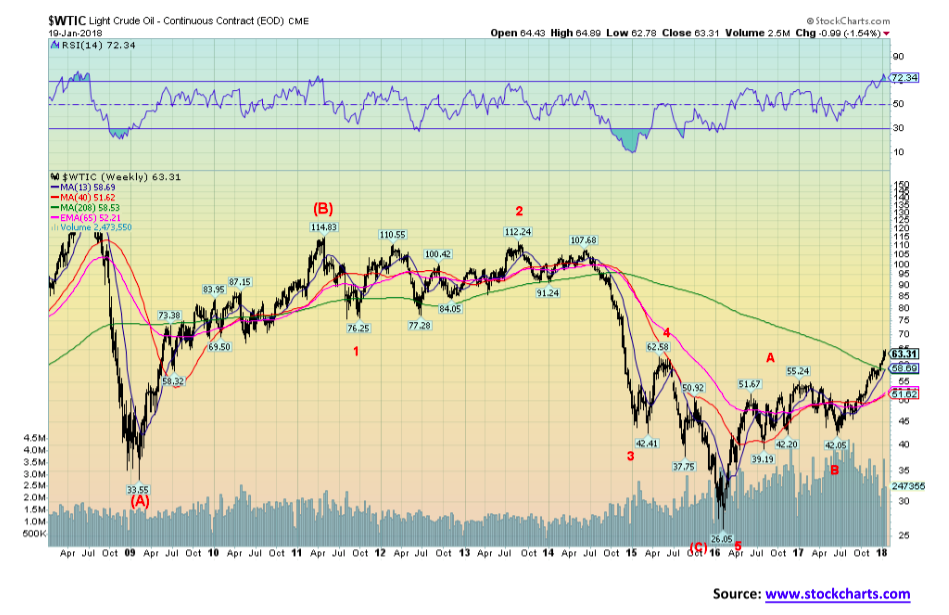
WTI oil prices continue to climb, and for the first time since 2014, WTI oil has climbed over the 4-year MA. It could be that this is merely a test of the 4-year MA before a pullback takes place. We note that WTI oil tested the 4-year MA on a number of occasions from 2010 to 2014 before it finally succumbed to selling in 2014. The climb since the low at $26.05 in January 2016 appears to be corrective, but some might argue it is an impulse wave. WTI oil’s targets were roughly $62.65, and we exceeded that level. The next potential target to the upside could be $67.25. If we achieve that level, it would confirm to us that WTI oil prices have entered a potential longer bull phase, and this is not merely some correction to the huge decline from 2013 to 2016. WTI oil’s all-time high was seen in 2008 at $147. It would most likely take the spark of a Mid-East crisis (war with Iran?) to send WTI oil prices soaring. As long as WTI oil remains above $55, the bull move appears to be intact.
GLOSSARY
Trends
Daily – Short-term trend (For swing traders)
Weekly – Intermediate-term trend (For long-term trend followers)
Monthly – Long-term secular trend (For long-term trend followers)
Up – The trend is up.
Down – The trend is down
Neutral – Indicators are mostly neutral. A trend change might be in the offing.
Weak – The trend is still up or down but it is weakening. It is also a sign that the trend might change.
Topping – Indicators are suggesting that while the trend remains up there are considerable signs that suggest that the market is topping.
Bottoming – Indicators are suggesting that while the trend is down there are considerable signs that suggest that the market is bottoming.
(All charts are courtesy of Stratfor, Coin Desk, Stock Charts, McClellan Financial Publications and COT Price Charts.)
—
DISCLAIMER: David Chapman is not a registered advisory service and is not an exempt market dealer (EMD). We do not and cannot give individualised market advice. The information in this newsletter is intended only for informational and educational purposes. It should not be considered a solicitation of an offer or sale of any security. The reader assumes all risk when trading in securities and David Chapman advises consulting a licensed professional financial advisor before proceeding with any trade or idea presented in this newsletter. We share our ideas and opinions for informational and educational purposes only and expect the reader to perform due diligence before considering a position in any security. That includes consulting with your own licensed professional financial advisor.


The TopRanked.io Guide to 2026’s Biggest and Best Affiliate Opportunities
Want to earn affiliate commissions on literal billions of dollars worth of revenue? Then this week, we've got something special...


Eni Advances Energy Transition with Major Investment and Emissions Cuts
Eni showcased its “Just Transition” report in Rome, highlighting stakeholder collaboration and progress toward decarbonization goals. The company invested over...


The German Fintech Market Shows Resilience and Strong Investment Growth in 2026
Germany’s fintech sector remained resilient in 2026 despite economic crisis and rising insolvencies. Investments reached €14.2 billion, showing strong investor...


Cannabis Legalization in Germany: A Mixed Interim Assessment
Germany’s cannabis legalization has reduced criminal cases and eased pressure on the justice system, while the black market is slowly...


Sustainable Restoration of the Haus Hövener Garden in Brilon
The Brilon Construction Workers Association is restoring the Haus Hövener garden into a cultural community space, funded through a €10,000...
 |
|
 |  |
 |
|
-

 Crowdfunding2 weeks ago
Prestadero Sees Rising Female Loan Participation in Mexico
-
 Business3 days ago
The TopRanked.io Guide to 2026’s Biggest and Best Affiliate Opportunities
-
Business1 week ago
TopRanked.io Weekly Affiliate Digest: What’s Hot in Affiliate Marketing [+ The Best Affiliate Program Directory on the Internet]
-

 Crowdfunding2 weeks ago
Spain’s Crowdfunding Sector Surges as Real Estate and SME Financing Expand
You must be logged in to post a comment Login