Markets
Primer on NYSE 52Wk High – Low Ratio
This week I’m covering a third extreme-market event; when the NYSE 52Wk H-L Net Ratio exceeds +/- 10%. I haven’t yet invented a catchy name for these extreme days, as I have for the two above. Maybe NYSE 10% 52Wk High – Low Ratio Days? As catchy names go, that one is kind of long. Maybe NYSE 10% 52Wk H-L Days, or simply 10% H-L Days to keep it short.

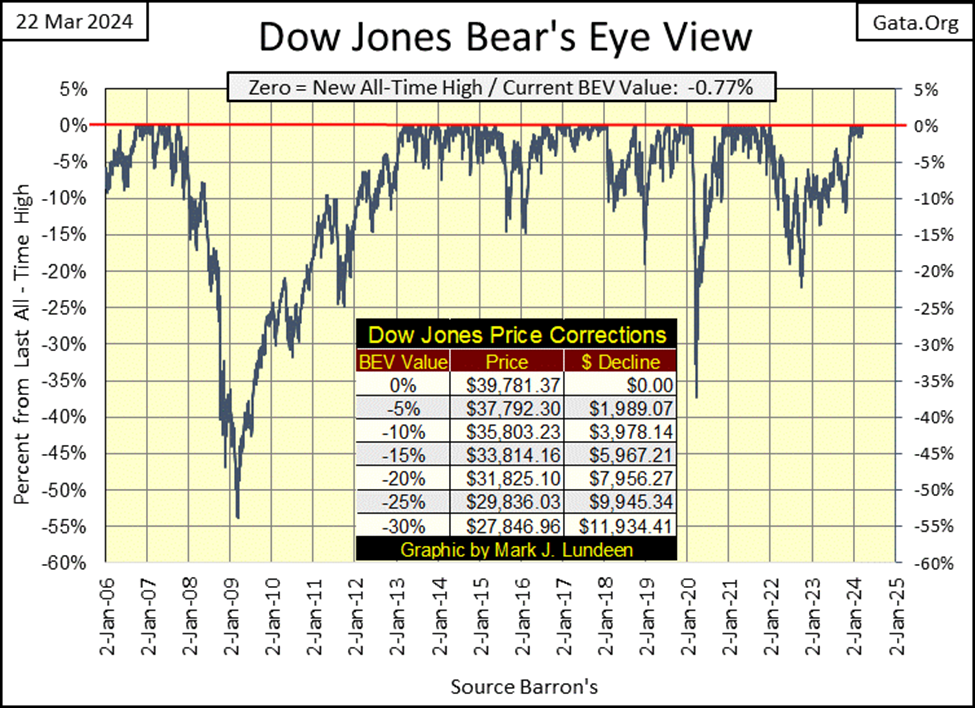
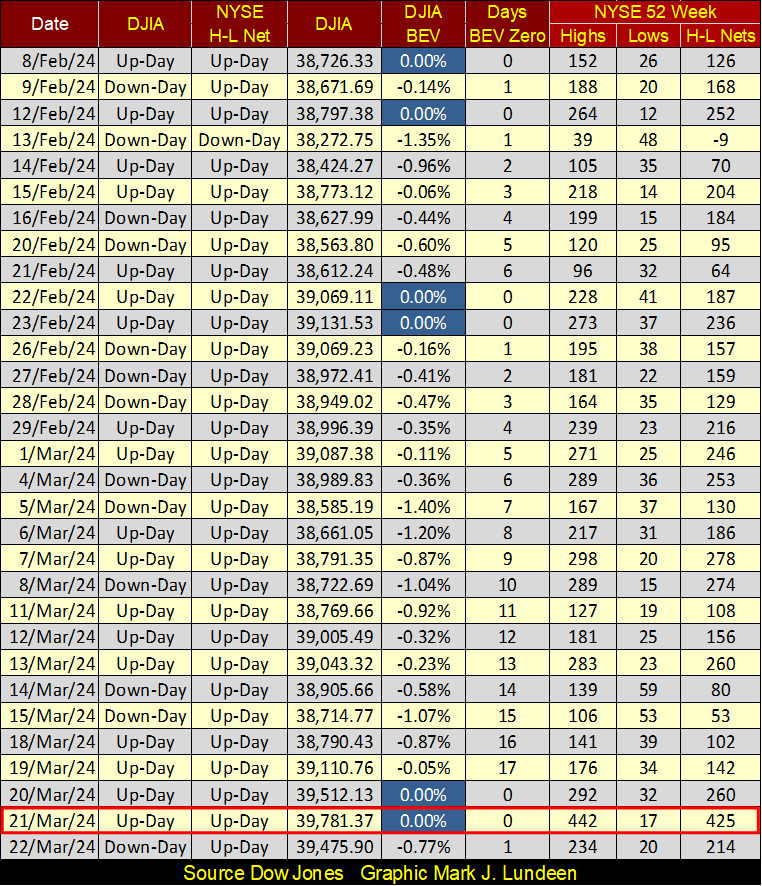
This week (Wednesday & Thursday) added two more Bear’s Eye View (BEV) Zeros (new all-time highs) to the Dow Jones’ BEV chart below, numbers 22 & 23 of the current advance, and closed the week deep into scoring position, with a BEV of -0.77%. At the close of this week, we should anticipate the Dow Jones seeing additional BEV Zeros.
How much higher the Dow Jones can rise in this advance is something a BEV chart can’t say, as every new all-time high (BEV Zero) is equal to only 0.00%, and never more. A Dow Jones close at 40,000 in the chart below, will look the same as its 07 October 2007’s new all-time high of 14,164 = 0.00%, though 25,836 points and four QEs separate them.
That is an amazing gain in the Dow Jones, but is the world better for it? I doubt it. That is the charm of a BEV chart, over time it ignores the inflation the FOMC “injects” into market valuations, by seeing every new all-time high as a Zero Percentage, and never more.
For those data points not a new all-time high, they register as negative percentage claw backs by Mr Bear from their last all-time high. This is a very powerful feature in a BEV chart, allowing for the direct comparison of one bear market bottom to any other in the series being plotted.
The BEV for 09 March 2009, seen below; -53.98%, is the second deepest Dow Jones bear market bottom since 1885, exceeded only by the -89.19% BEV seen on 08 July 1932, at the very bottom of the Great Depression market crash.
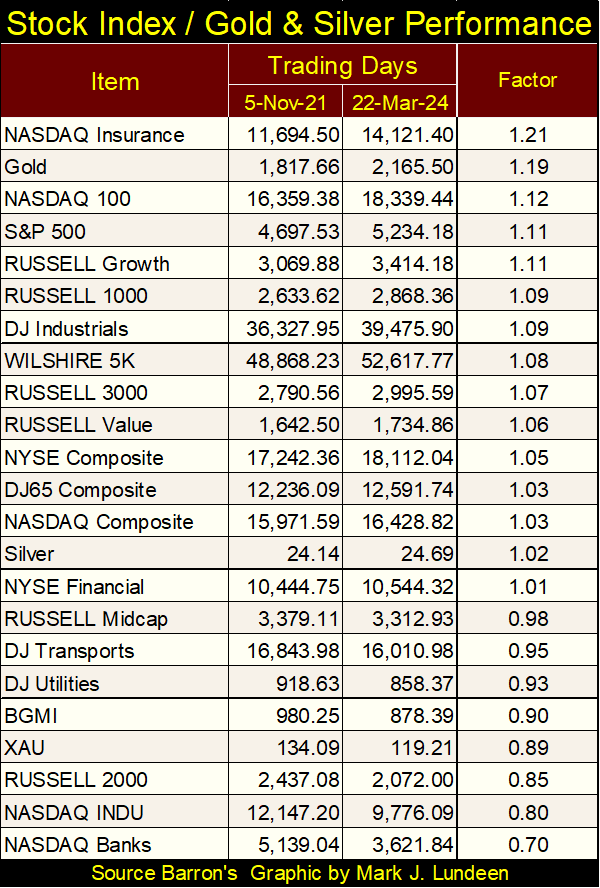
Another nice feature of a BEV plot, is its ability to normalize market valuations among many different market indexes. Below I have the weekly closing values for the various major market indexes I follow, sorted by the factor they’ve increased since 05 November 2021. Yes, it’s nice seeing the actual valuations. But taking this table as a whole, it’s visually chaotic.
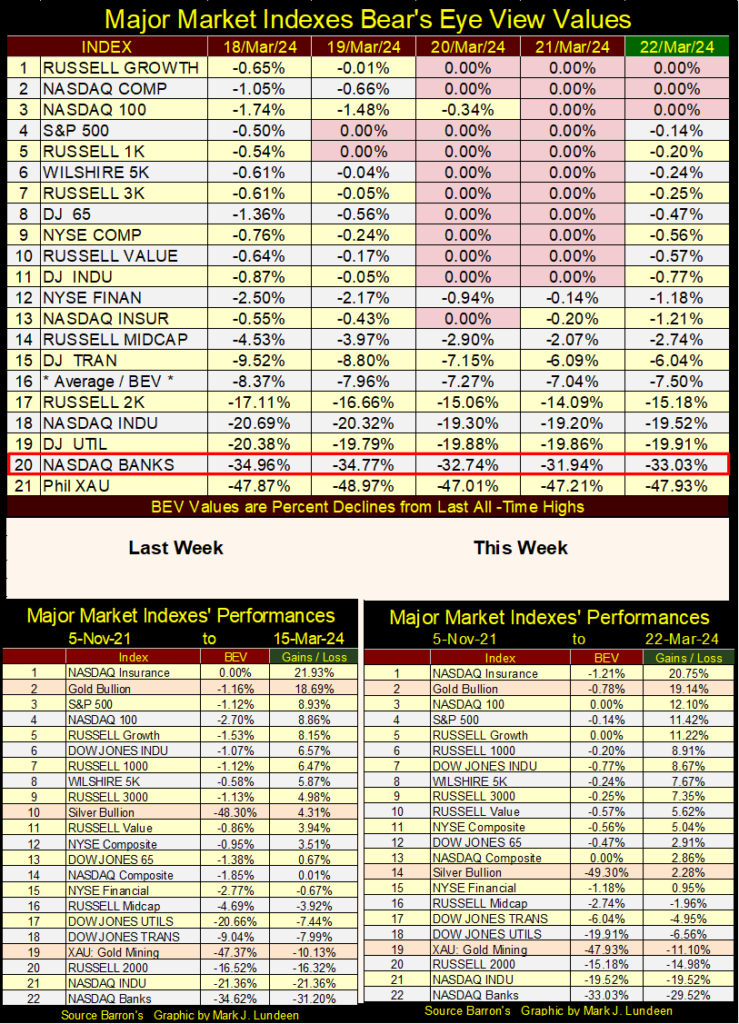
Now compare the table above, with the table below listing these same major market indexes’ BEV values. Those indexes seeing new all-time highs are easily identified, and those indexes lagging the market leaders are notable by how far they are lagging the market’s leadership, in percentage terms. That’s nice.
Unlike the table above showing these indexes’ as published valuations, using these indexes’ BEV values below shows us the market had a very good week; lots of BEV Zeros, and closes in scoring position; BEVs between -0.01% to -4.99%.
Until all these indexes’ BEV values fall below -5.00%, at which point most of them will be far below a BEV of -5.00%, I’m anticipating a continuation of this stock market advance.
Though I’m still not recommending buying anything other than the gold miners, and won’t for a long time to come. Mr Bear has decades of monetary inflation to first wring out of these market valuations, before I’ll once again be interested in the broad market.
In the performance tables above, gold advanced this week, remaining at #2 in the table, while silver fell the week by four rows and over 2% in valuation. The XAU was down a bit this week too. I still believe 2024 will be an excellent year for precious metal assets, but so far, it’s been slow.
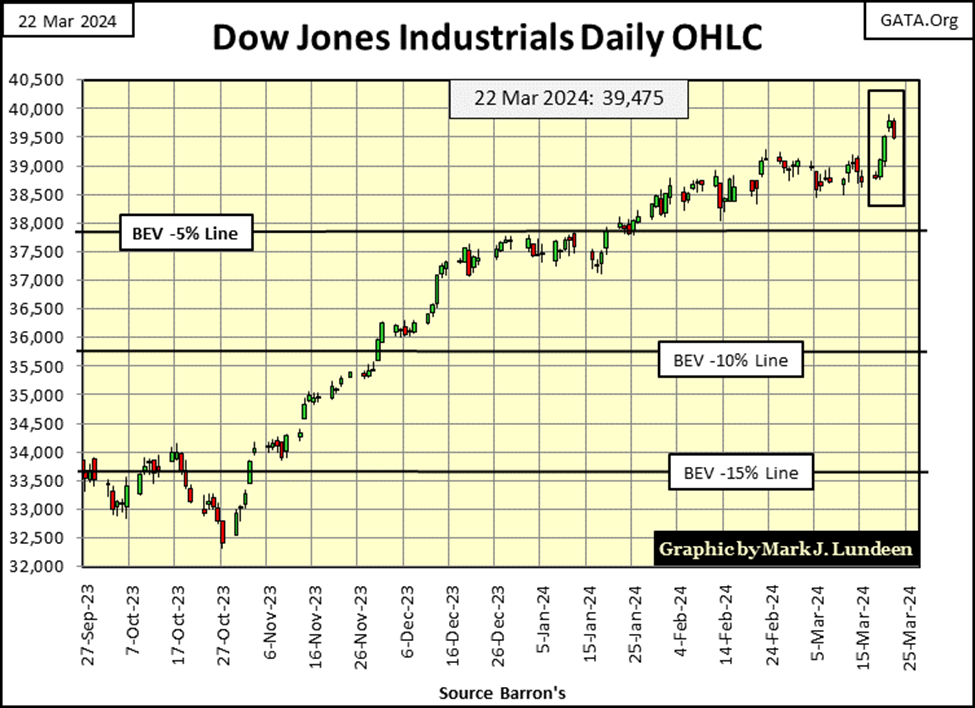
I do like looking at the market via BEV values, but looking at an index’s market valuation is good too, as with the Dow Jones below. This week the Dow Jones blew past its line of resistance at 39,000, and almost broke above 40,000. How much higher can the Dow Jones go? I haven’t a clue, but it may go much higher than any of us currently believes it can.
This isn’t the market to go short or buy puts on. That is coming, but its not here yet. I’d wait until the Dow Jones begins seeing multiple days of extreme volatility; Dow Jones 2% Days, and the NYSE begins seeing 52Wk H-L 70% Days, days of extreme market breadth. Until then, sit back and enjoy watching the bulls have some fun, running wild and free on Wall Street.
Over at the NYSE, on Thursday it saw a 52Wk H-L Net of +425 in the table below; that is pretty good. As seen further down in my coverage of the NYSE 52Wk H-L Net Ratio, my market focus for this week, that H-L net of +425 was equal to a 52Wk H-L Net Ratio of +15%; a very good day for the bulls at the NYSE.
These past few weeks I’ve looked at extreme-market events in the stock market, extreme-market events because when they occur, it’s impossible not noticing something BIG happened. These extreme-market events are also infrequent-market events. When they do become frequent occurrences in the stock market, maybe something important is happening that market watchers should take note of.
So far, I’ve covered;
• Days of extreme market volatility (Dow Jones 2% Days),
• Days of extreme market breadth (NYSE 70% A-D Days).
This week I’m covering a third extreme-market event; when the NYSE 52Wk H-L Net Ratio exceeds +/- 10%. I haven’t yet invented a catchy name for these extreme days, as I have for the two above. Maybe NYSE 10% 52Wk High – Low Ratio Days? As catchy names go, that one is kind of long. Maybe NYSE 10% 52Wk H-L Days, or simply 10% H-L Days to keep it short.
As with the Dow Jones 2% Days, and the NYSE 70% A-D Days, the +/- 10% value for the NYSE 52Wk H-L Ratios is a threshold value, that once crossed indicates an extreme-market event had occurred on that day. What is it about these threshold values, that when exceeded, makes them extreme?
Well, they are my indicators, so I get to say when these market events become extreme. If someone wanted to go through the trouble to use other threshold values – more power to them. From my personal experience watching CNBC over the years, when these indicators crossover their thresholds, to the up or downsides, the programing on CNBC will become either manic or depressive, or so it seems to me. I’m expect this will be true for the future.
But before I go into 10% 52Wk H-L Days, maybe I should explain exactly what a 10% 52Wk H-L Day is. The data for NYSE 52Wk Highs and Lows comes from the Daily Breadth data, published every day by the good folks at the Wall Street Journal, along with NYSE Advance and Decline data.
https://www.wsj.com/market-data/stocks/marketsdiary
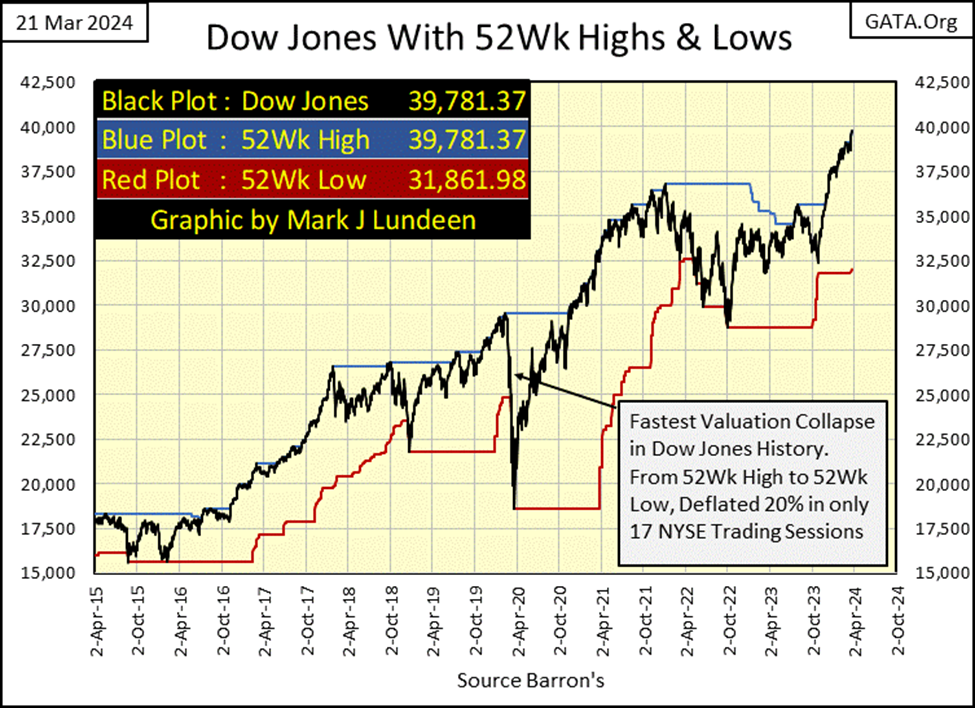
52Wk highs and lows are themselves significant-market advents, even if they are seldom extreme-market events. Below is a chart plotting the Dow Jones (Black Plot) with its 52Wk high (Blue Plot) and 52Wk low lines (Red Plot). Every time the Dow Jones makes a new all-time high, it is also making a new 52Wk high, something the Dow Jones has been doing regularly since last November, and so no big deal.
What would be a big deal, would be seeing the Dow Jones reverse, decoupling from its 52Wk High line, begin trending towards its 52W Low line, and then begin pushing its 52Wk Lows down to lower values. As seen in the chart below, this has happened several times since 2015.
The reverse of this would also be true, after seeing the Dow Jones pushing down its 52Wk Low line for a prolonged period, to decouple from it, begin trending upwards to its 52Wk High Line, and begin pushing 52Wk Highs to higher levels.
So, seeing the Dow Jones switch from making 52Wk Highs, to make 52Wk Lows, and vice-versa are significant market events. Unlike daily advances or declines, market events that take a single day, 52Wk Highs and Lows are market events that TAKES TIME, when moving from one 52Wk extreme to the other.
What we are seeing in the chart below, is money flowing into the Dow Jones when it is making new 52Wk Highs, and money flowing out of the Dow Jones when it is making new 52Wk Lows.
Now think of this happening with every issue (company) trading at the NYSE, market data captured, and published daily by Dow Jones Inc.
As far as this Dow Jones’ data set goes, the next big thing for the Dow Jones to do, some day in the future, is to decouple from its 52Wk high line, and begin pushing down its 52Wk low line. For this to happen, it typically takes three or more months.
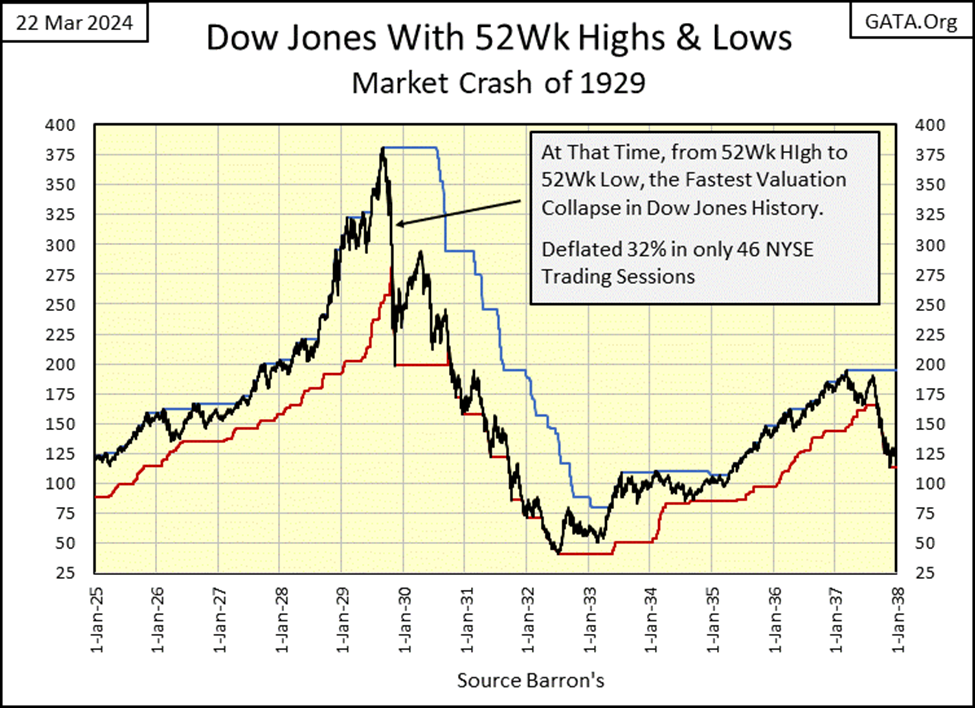
Then maybe not. During a selling panic in the market, as in the autumn of 1929, it took only forty-six NYSE trading sessions, from 03 September 1929, to 28 October 1929, less than two months for the Dow Jones to decouple from its 52Wk High line, and begin pushing down on its 52Wk Low line. The Dow Jones’ valuation deflated by 32% to make that happen. That was during the market crash of 1929.
What happened during the March 2020 Flash Crash (2 charts above) was more extreme. From a new 52Wk high, 12 February 2020, it took the Dow Jones only seventeen NYSE trading sessions, 09 March 2020, less than a month for the Dow Jones to begin pushing down on its 52Wk low line, deflating 20% as it did.
To make this happen in early 2020, just four years ago, the Dow Jones during these seventeen trading days, had to shed 4,736 points, or deflate its valuation by 20% in only seventeen NYSE trading sessions – Wowie, Wow Wow!
Had FOMC Primate Idiot Powell not “stabilized” (aborted the bear market) the financial system with “injections” of “liquidity” by the trillions-of-dollars in March / April 2020, I believe the market crash of 2020 would have exceeded any bear-market extremes of 1929.
As it is, other than myself, no one covers the March 2020 Flash Crash any longer. That is a mistake, as whatever problems the market had in March 2020, are still present, and unresolved today.
What was the problem in early 2020? American corporations were overwhelmed by the debts they’ve assumed in the aftermath of the sub-prime mortgage fiasco, debts many companies took on to finance their share buy-back and dividend programs. A very foolish uses of the debt market, that was destined to have negative consequences for these companies.
A selling panic began in the corporate bond market (rising bond yields), which motivated FOMC Primate Idiot Powell to expand his Not QE#4, where for the first time in Federal Reserve history, the FOMC begin “monetizing” corporate bonds too, to “stabilize” the financial markets.
In a single month, Powell “injected” trillions-of-dollars of “liquidity” into the financial system, to turn the Dow Jones around in late March 2020, as seen two charts above.
Returning to NYSE 52Wk highs and lows, now think of this happening for every issue (company) trading at the NYSE or NASDAQ exchanges, during the ebb and flows of the market, during both bull and bear markets. What does that look like?
First, we need to analyze each days’ data, using the formula below;
NYSE 52Wk Highs – 52Wk Lows / Total NYSE Issues traded that day.
If this formula looks familiar, that is because it’s the same formula I used to calculate NYSE 70% A-D Days, I’m just plugging into it NYSE 52Wk H-L data, and using +/- 10% as a threshold, the results are seen in the chart below. This week on Thursday, the NYSE saw a 10% 52Wk H-L Day, a 15% day, making the bulls happy this week.
But more significant than +10% 52Wk H-L days, are the -10% 52Wk days, that when they fall below their -50% lines, have called peak selling at the NYSE. This happened in the October 1987 flash crash, providing an excellent buy signal.
For the sub-prime mortgage bear market, peak selling (peak 52Wk Lows) happened on 10 October 2008, five months before the Dow Jones bottomed on 09 March 2009. How bad was that day in October 2008? Of the 3306 issues trading on the NYSE that day, 2901 of them saw a new 52Wk Low. That got everybody’s attention, even the US Congress.
Seeing the Dow Jones continue declining from October 2008 to March 2009, as 52Wk Lows at the NYSE were becoming less frequent, a lot less frequent would have been a key factor in calling a bottom was near at hand in early 2009. At the Dow Jones’ March 9th bottom, only 600 issues trading that day at the NYSE made a new 52Wk Low. Days later, NYSE 52Wk Lows dropped to less than 100 every day – the bottom was in.
The same could be said for the March 2020 Flash Crash, after it bottomed on 12 March 2020, with a NYSE 52Wk H-L Ratio below -70%. Soon thereafter, the NYSE stopped seeing negative 10% H-L days, as “liquidity” from Powell’s Not QE#4 flooded into the market.
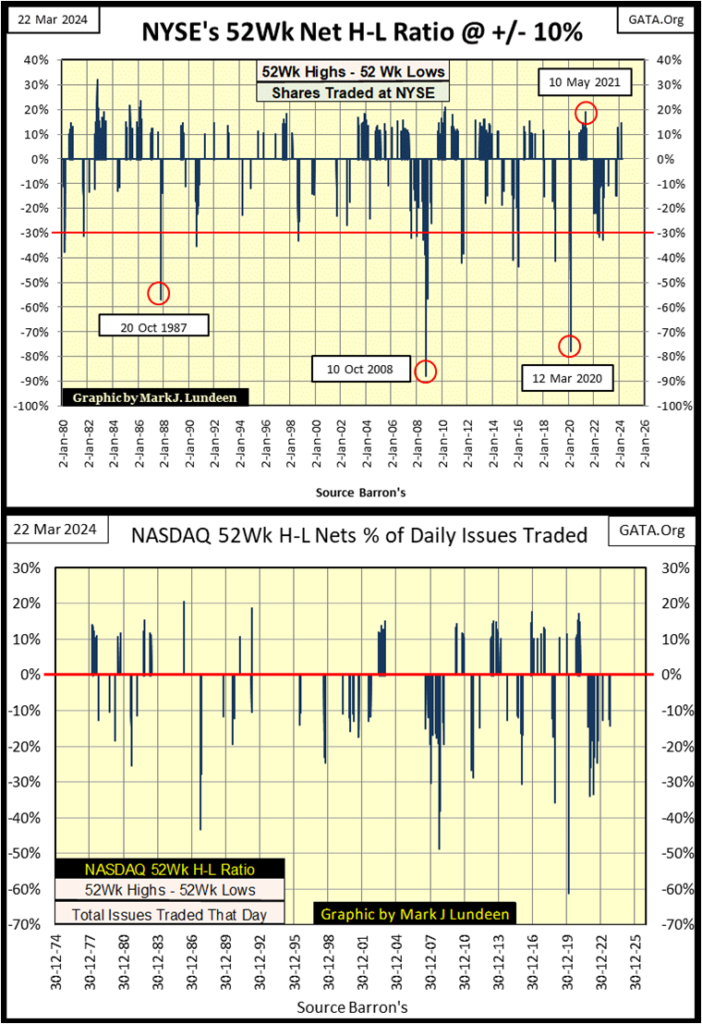
The bottom chart is for 52Wk Highs and Lows for the NASDAQ Exchange. I maintain this data, but I don’t do much with it. I cover enough already.
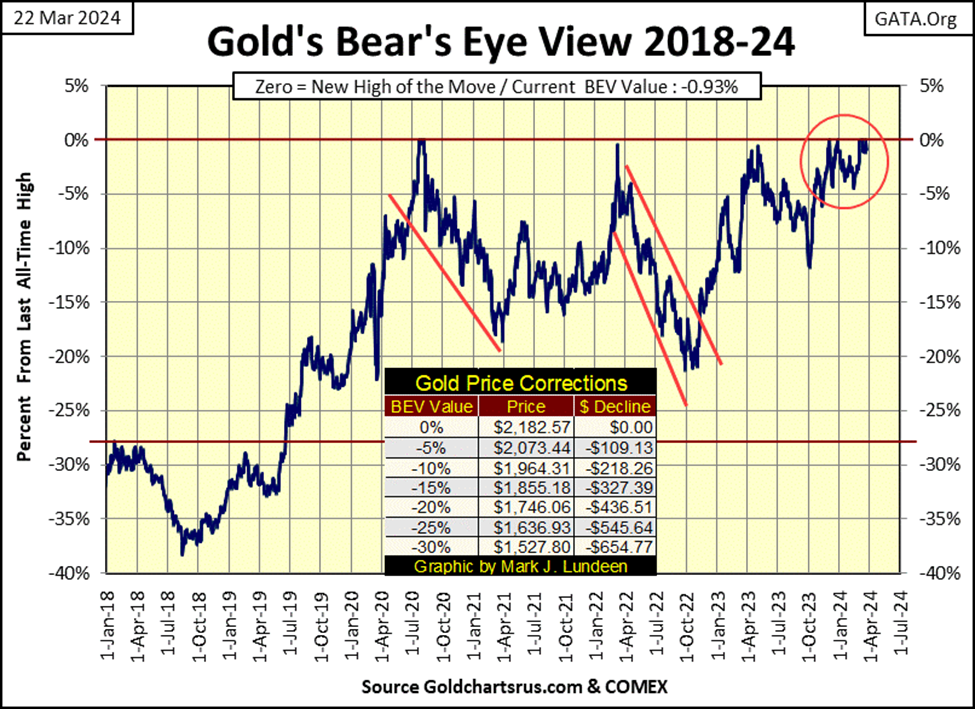
Let’s look at gold BEV chart. Gold saw a new BEV Zero this week on Wednesday, its ninth since mid-November when it entered scoring position, staying there since. The Dow Jones has remained in scoring position as long as gold has, four months now. But the Dow Jones has seen 23 new BEV Zeros, while gold has seen only 9.
I want to complain to someone about this, an advance in gold with so few new all-time highs, but nobody cares. So, I’ll just have to find comfort in seeing how gold for the past four months has refused to close below its BEV -5% line, stubbornly remaining in scoring position, where all new BEV Zeros come from. This advance in gold isn’t finished yet.
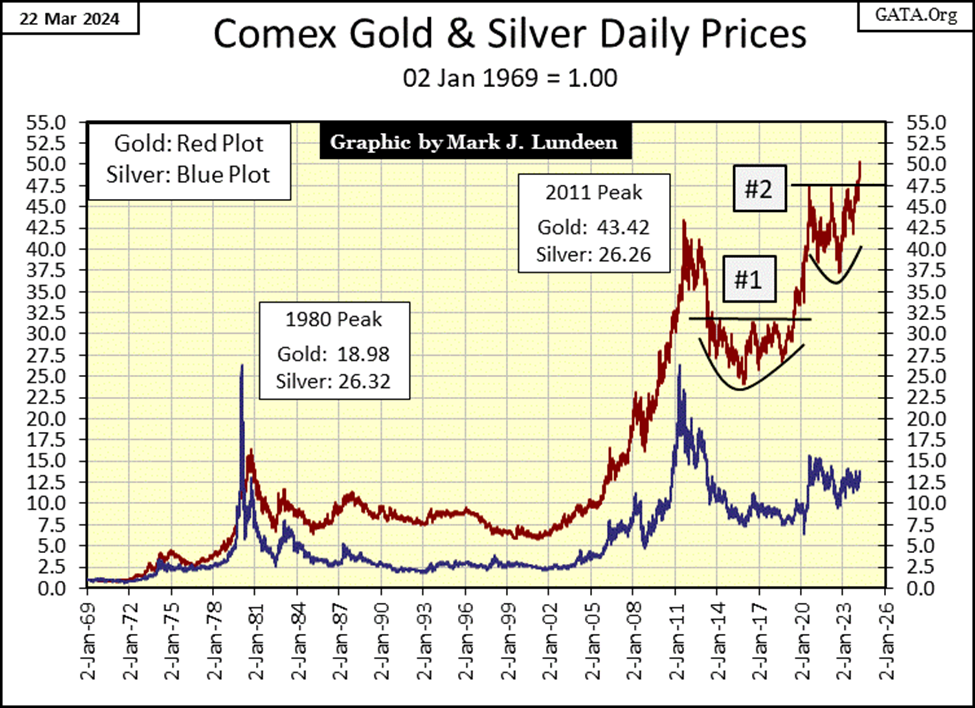
Moving on to gold and silver below, plotting their indexed values with 02 January 1969 = 1.00, gold looks good. I identified two technical chart patterns for gold. If I were some kind of “market expert” I’d know their proper name. Being only a market enthusiast, I’m going to call these formations “Bowls and Breakouts,” or B&Bs.
B&B #1 was the post August 2011 bear market bottom. From 2013 to the summer of 2019, gold attempted to break above, and stay above its 32.3 level ($1370) – but failed several times. Then came the summer of 2019, when after six years of trying, gold finally broke out to its highs of August 2020. That was a nice one-year gain.
B&B #2 broke out a few weeks ago. Where it will ultimately top out is anyone’s guess, hopefully far above the 55.0 line in the chart. Emotionally though, I have this feeling that isn’t going to happen. But then, I remember that is exactly how I felt in the summer of 2019, when B&B #1 broke out above its bowl.
So, I’m going to do something I should never do, and predict gold will close above its 55.0 line ($2,400) seen below, by the end of August of this year. I have no good reason for making this call, other than when we see breakouts from such a technical pattern, it’s good for the bulls, and bad for the bears.
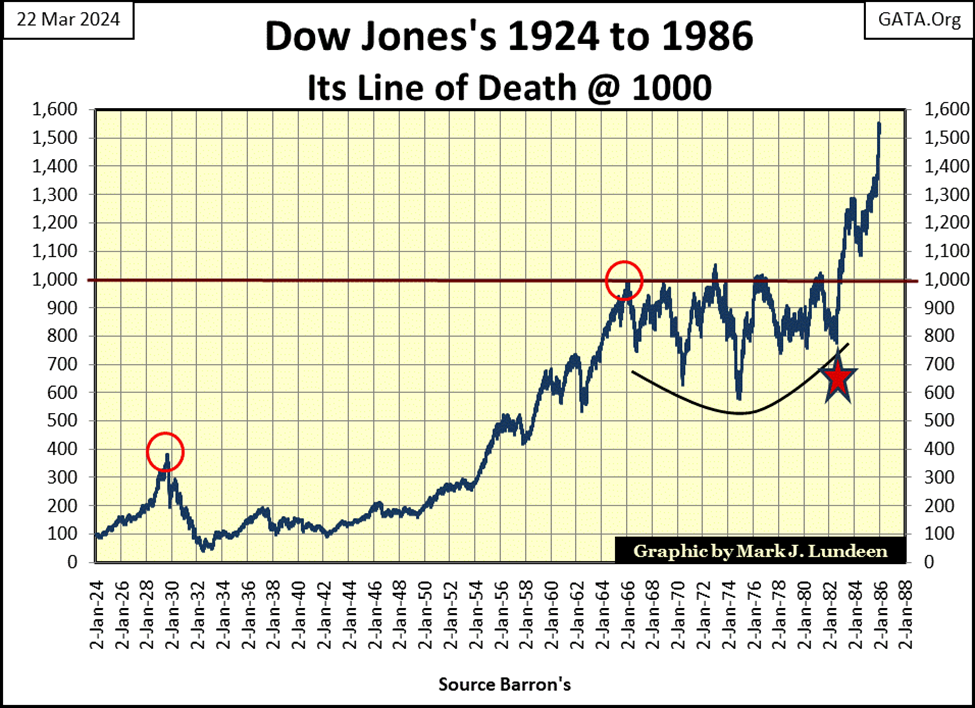
Our current Dow Jones bull market began as a B&B chart pattern, as seen below. When the Dow Jones broke out of this pattern in autumn 1982 by breaking above, and finally staying above 1000, after five failed attempts since 1966, a historic bull market was born. Forty-two years later, this week the Dow Jones is trading above 39,000!
Of course, when the Dow Jones broke above this B&B formation in September 1982, US currency-in-circulation (CinC) was only $150 billion dollars. Today, with the Dow Jones trading over 39,000, CinC, the supply of paper-dollars in circulation has bloated to $2,340 billion dollars, and has inflated market valuations enormously these past four decades.
Something that would be a huge help for gold breaking out BIG this summer, would be seeing silver above breaking out above its 17.5 line ($32.5), two charts above, and then keep going toward new all-time highs. This is going to happen sometime. Why not this summer?
One factor that comes to my mind arguing against that, is silver’s last all-time high ($48.70), is still from January 1980, forty-four years ago. On that day, 17 January 1980, the Dow Jones closed at 863.57. Today the Dow Jones closed at 39,475.90. Silver closed today at 24.69, or half of silver’s price from when Jimmy Carter was still President. Even horse shoes and buggy whips cost more today than they did in 1980. Why is silver so cheap in 2024?
The paper shorts at the COMEX Silver future’s market, are real jack-booted thugs. For over four decades, anyone who went long in the silver market, saw those jack-boots, up close and personal. But why do this for silver, if not for horse shoes and buggy whips?
Silver is so useful, for solar power and many other industrial items. If silver were allowed to rise to its unmanipulated valuations, probably many hundreds of dollars more than it sells for today, it would make boondoggle projects like solar powered electrical grids, spanning continents impossible.
This too shall change – but this year? Maybe, let’s hope so.
On gold’s step sum table below, it saw a new BEV Zero on Wednesday, #9 of this advance. A nice surprise after seeing gold down for four trading day following its previous BEV Zero. Seeing gold declining on Thursday and Friday, but to only a BEV value of -0.93%, indicates gold could very well make a few new BEV Zeros next week. I got my fingers crossed.
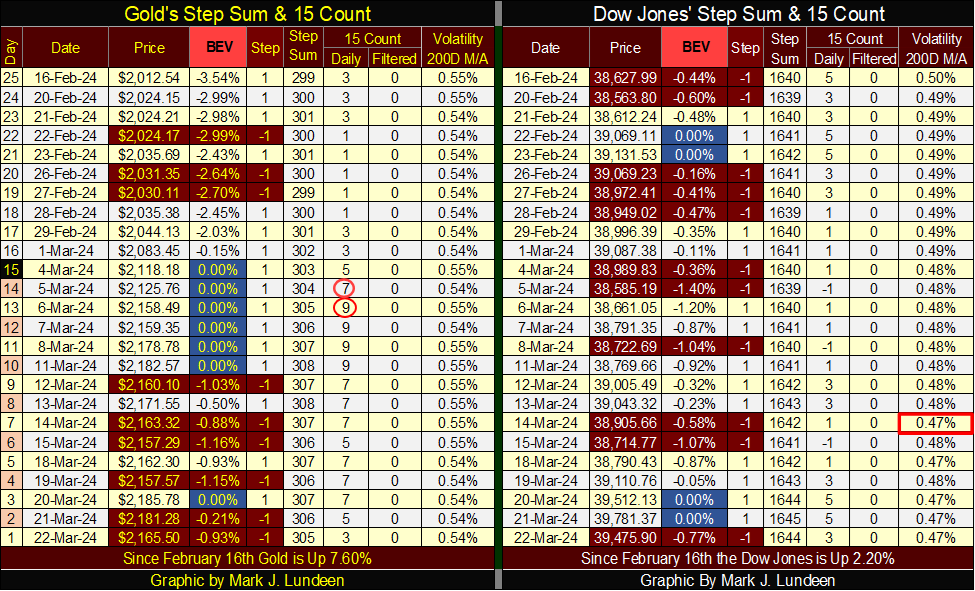
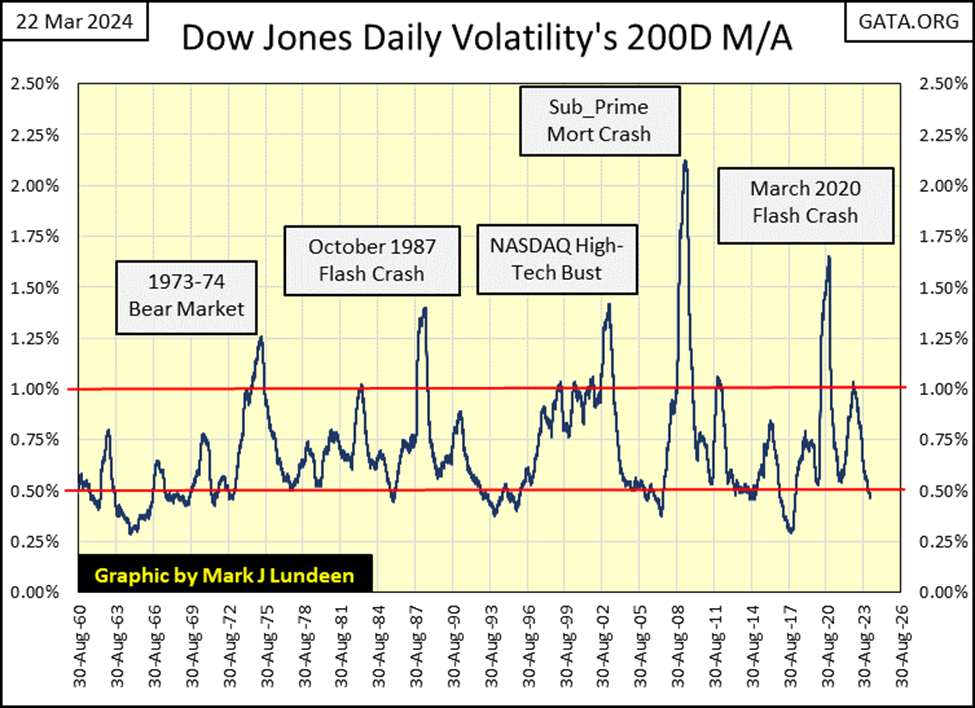
The Dow Jones on its side of the step sum table is looking good too. Closing the week deep into scoring position, with its Friday’s BEV of -0.77%, and seeing its daily volatility continuing to decline, closing Friday at 0.47%, provides us with good reason to believe this advance hasn’t topped out yet.
However, when looking at daily volatility for the Dow Jones in the chart below, seeing the Dow Jones’ daily volatility’s 200D M/A drop below 0.50%, indicates the stock market is approaching a major top. Making this a time to sell, NOT BUY into this market’s strength.
__
(Featured image by Patrick Weissenberger via Unsplash)
DISCLAIMER: This article was written by a third party contributor and does not reflect the opinion of Born2Invest, its management, staff or its associates. Please review our disclaimer for more information.
This article may include forward-looking statements. These forward-looking statements generally are identified by the words “believe,” “project,” “estimate,” “become,” “plan,” “will,” and similar expressions. These forward-looking statements involve known and unknown risks as well as uncertainties, including those discussed in the following cautionary statements and elsewhere in this article and on this site. Although the Company may believe that its expectations are based on reasonable assumptions, the actual results that the Company may achieve may differ materially from any forward-looking statements, which reflect the opinions of the management of the Company only as of the date hereof. Additionally, please make sure to read these important disclosures.


Switzerland’s Medical Cannabis Reform Advances Access, But Barriers Remain
Switzerland’s 2022 medical cannabis reform improved patient access by removing federal approval requirements, but challenges remain. MEDCAN highlights barriers including...


Swisscanto Launches Catastrophe Bond Fund for Portfolio Diversification
Swisscanto launches a Luxembourg UCITS catastrophe bond fund, giving qualified investors access to insurance-linked securities tied to extreme natural events....


AI Agents Transform Payments as Visa, Mastercard, and Qonto Tackle Trust, Liability, and Regulation
Visa and Mastercard are advancing AI-driven autonomous payments, shifting focus to trust, liability, and regulation when agents act without real-time...


Bitcoin ETFs Lead as German Stock Exchange Debuts Mining ETF
Bitcoin and Ethereum remain largely flat, with BTC near 66,600 and ETH around 1,920, while ETFs see steady inflows. A...


Ali G Makes Surprise Wimbledon Appearance with Cannabis-Themed Satire
Sacha Baron Cohen revived his iconic Ali G character at Wimbledon’s men’s final, blending satire with British high society. Dressed...
 |
|
 |  |
 |
|
-

 Impact Investing2 weeks ago
ICSC Raises €500M Social Bond, Expanding Sustainable Investment Reach
-

 Fintech4 days ago
FinTech Matures as AI and Infrastructure Drive the Next Growth Phase
-
 Fintech2 weeks ago
Withings Achieves Profitability in 2025 with 90% Growth Since 2018
-
 Cannabis17 hours ago
Switzerland’s Medical Cannabis Reform Advances Access, But Barriers Remain