Business
Problems for the Stock-Market Bulls in 2023
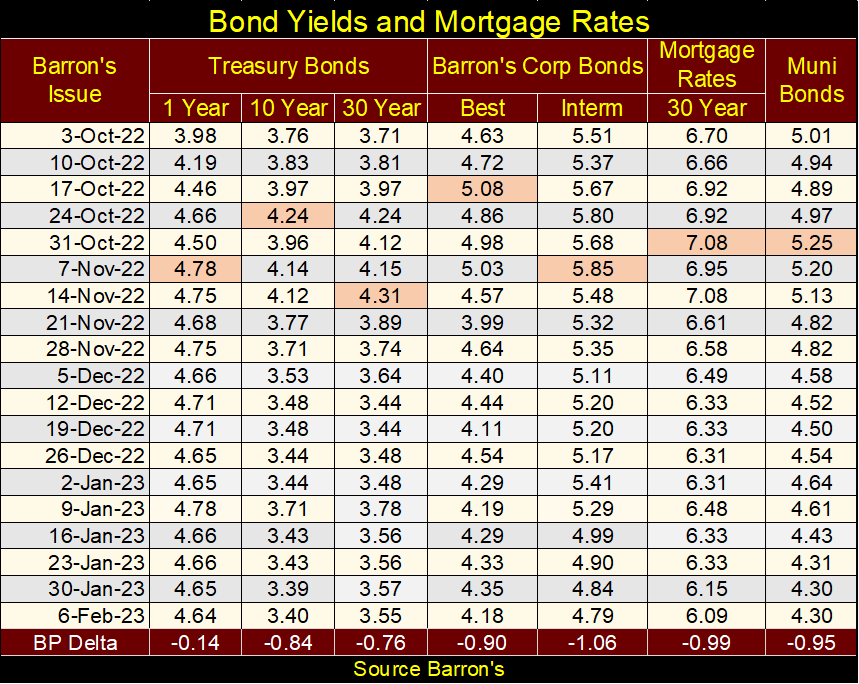
One current trend supporting the stock market; bond yields and interest rates have come down nicely since they peaked last October and November. Looking at the BP Delta row, the change in yields in basis-points (1% = 100 Basis Points), may not seem significant. But all of the yields have at least stopped going up, as they had from January 2022 to their highs in late autumn.

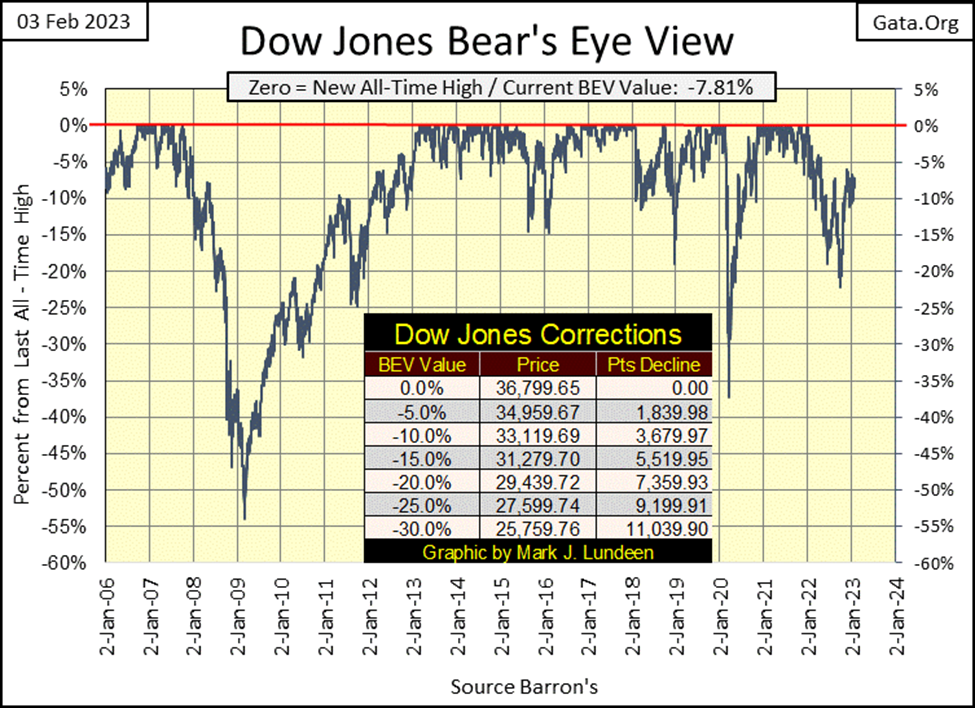
Since early November, the Dow Jones has remained in a trading range; between its BEV -5% & -10% lines in the chart below. What’s with that? I guess the Dow Jones is thinking about what it should do next in a world where “liquidity” available to the market is becoming ever scarcer, as seen in the shrinking values for NYSE margin debt, and the FOMC’s continuing QT.
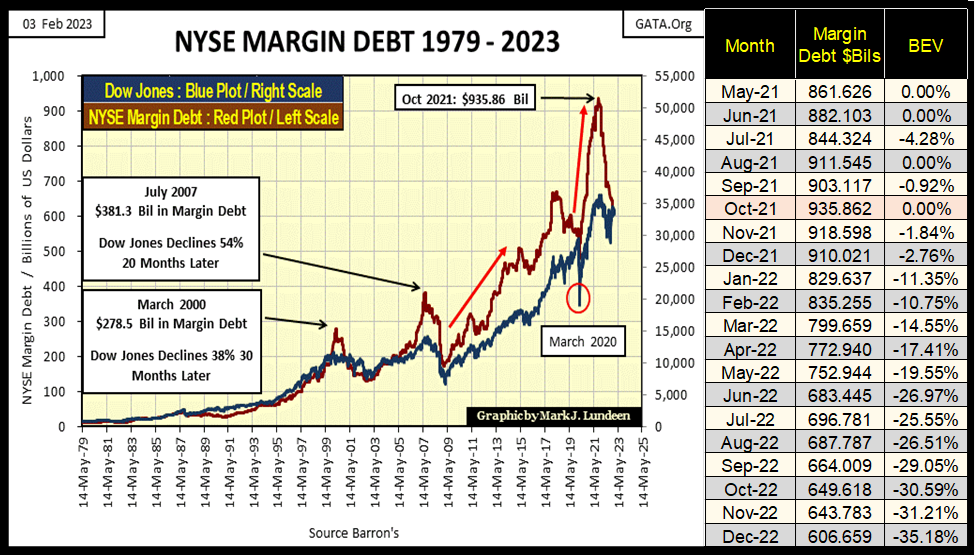
Since its peak in October 2021, NYSE margin debt is down $329 billion dollars, a reduction of 35%, as seen in the chart below. In the past, as noted below, such a reduction in margin debt resulted in a significant decline in the Dow Jones;
- -38% in 2002,
- -54% in 2009.
But so far, the Dow Jones has shrugged off this loss of buoyancy in the market. So far that is.
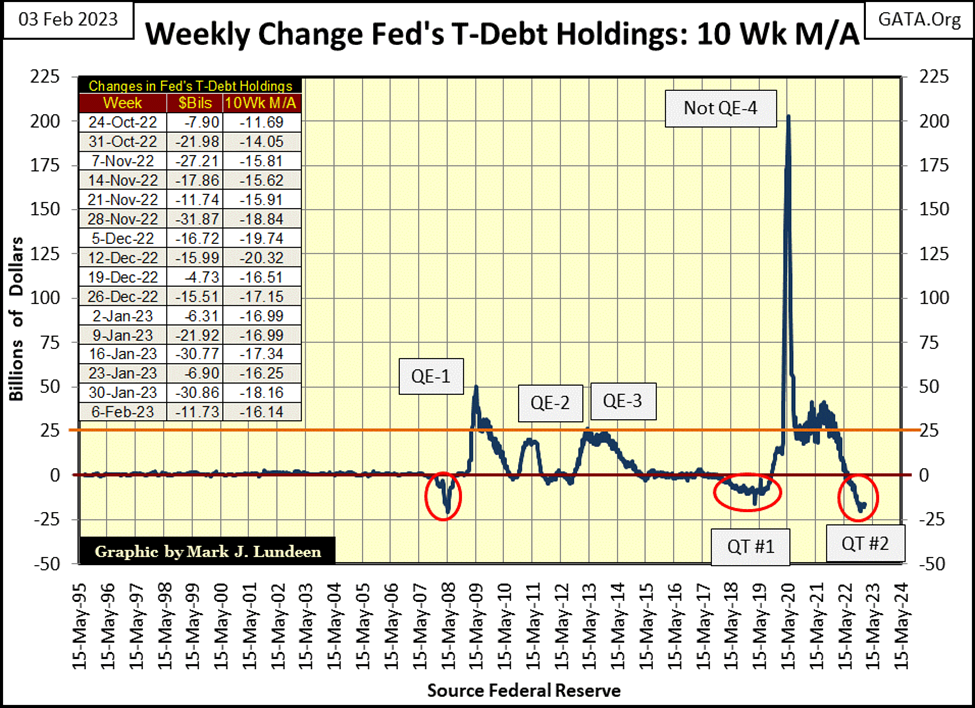
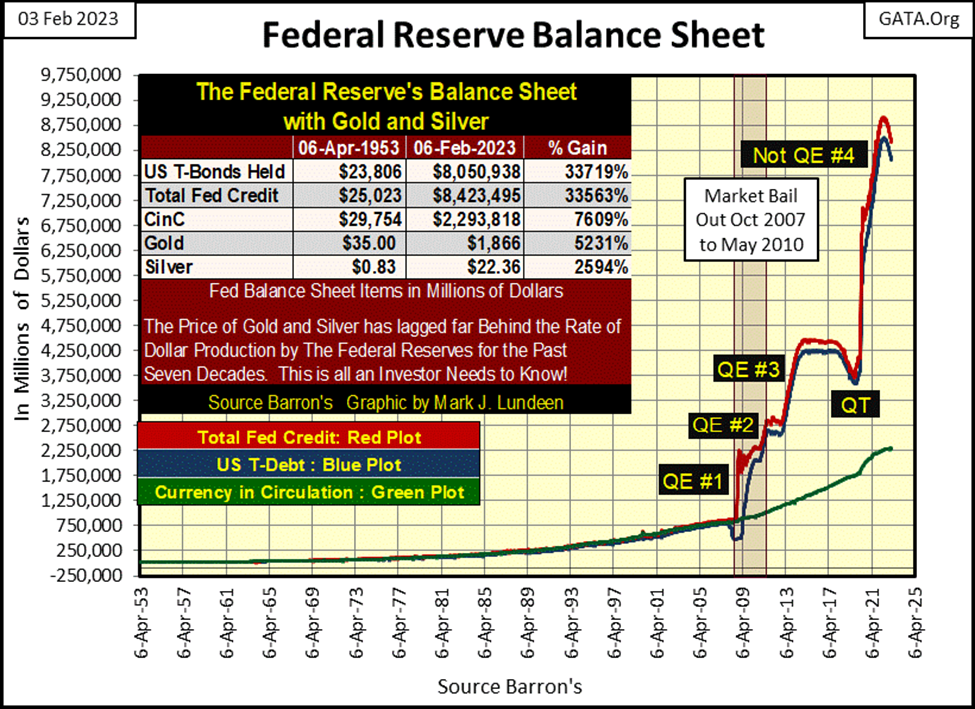
Then there is the quantitative easing the FOMC began implementing last May; QT#2 in the chart below. Since last May, the idiots at the FOMC have pulled out $495 billion dollars from the financial system.
Something not mentioned in the mainstream media, is the idiot’s first QT resulted in the March 2020 38% flash crash in the Dow Jones, which was probably the most traumatic twenty-eight NYSE trading days in history. Few people remember March 2020 that way, because of what we see below. Fed Chairman Powell, with his Not QE#4, “injected” a couple of trillion of dollars into the market to make the pain go away.
No doubt about it, bad things happened when the FOMC’s balance sheet undergoes a big reduction (red circles), as in 2008 and again in 2018 & 19. Can this current reduction in the FOMC’s balance sheet, not result in a market panic? Maybe, but if it does, will the FOMC begin another QE to stop the pain? Maybe not. But I’m thinking it will be more of the same, another QE sometime in the not-too-distant future to quell yet another panic in the market.
But when? I haven’t a clue. Sometime this year, or even before June seems reasonable.
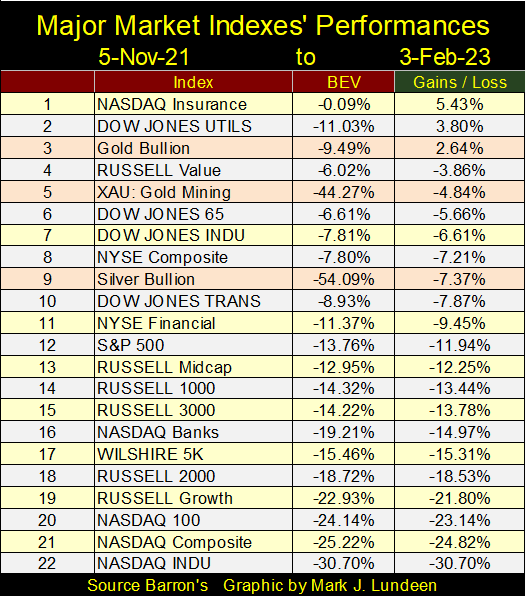
Here are the Bear’s Eye View values for the major market indexes I follow. The NASDAQ Insurance index (#1) saw two BEV Zeros (new all-time highs) this week on Tuesday and Thursday. That’s good. But I noticed that none of the other indexes closed this week in scoring position, a BEV of less than 5%.
That’s important, as when an index is advancing into market history, not every trading day closes at a BEV Zero. For most days in a bull market advance, an index closes within scoring position; between the 0.0% and -5.0% BEV lines. Closing in scoring position is where the bulls go to refresh themselves between new all-time highs. As you can see below, the other indexes have some work to do before we think about them in terms of making new bull market all-time highs.
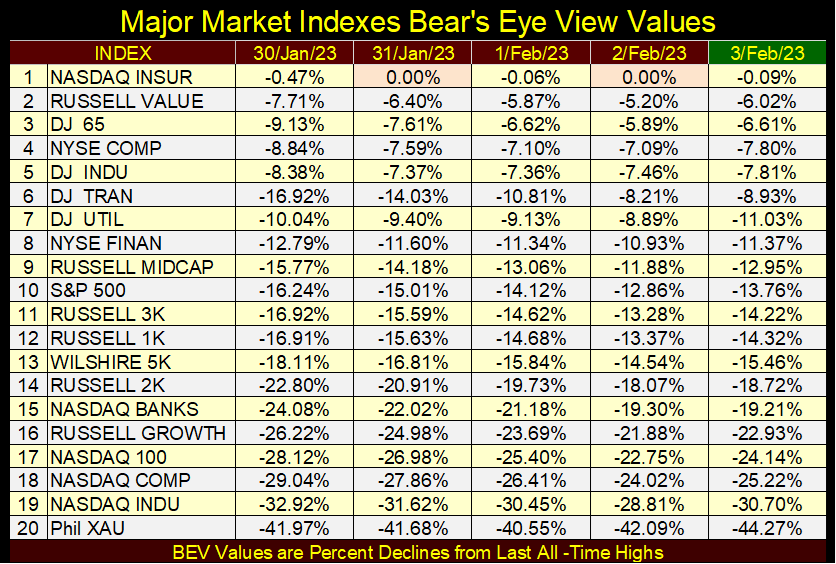
Last week the XAU (#20) saw one daily close above its BEV -40% line. This week the Powers-that-Be corrected that lapse in “policy”, with the XAU closing the week with a BEV of -44.27%. The story for the other indexes seen above was different; nice gains were seen on Thursday’s close from where they were on Monday. And Friday may have been down for most of them from Thursday, but note at week’s close, most of these indexes advanced above Monday’s close.
How these indexes are doing this is a bit of a mystery to me, considering the significant reductions in NYSE margin debt and the ongoing QT by the FOMC. But then, who really knows what goes on in the market’s back rooms?
This week was a downer for precious metal assets. Last week they closed within the top five in the table below. This week they all got whacked, with silver closing the week at #9. That’s how things go in the market, one week it’s up, the next it’s down.
No matter, I still believe gold, silver and their miners are going to be top performers for 2023, as the other indexes deflate to ever deeper valuations in continuing bear market that began in late 2021 and early 2022.
Looking at the Dow Jones in daily bars below, one thing that really stands out is how since the FOMC began their QT in May, the Dow Jones has struggled to break above its line of resistance at 34,250. After last August’s failed attempt, it deflated to its lows of 2022 a month later in September. Though it has closed above 34,250 since October, the Dow Jones can’t get above, and then stay above this key level of resistance.
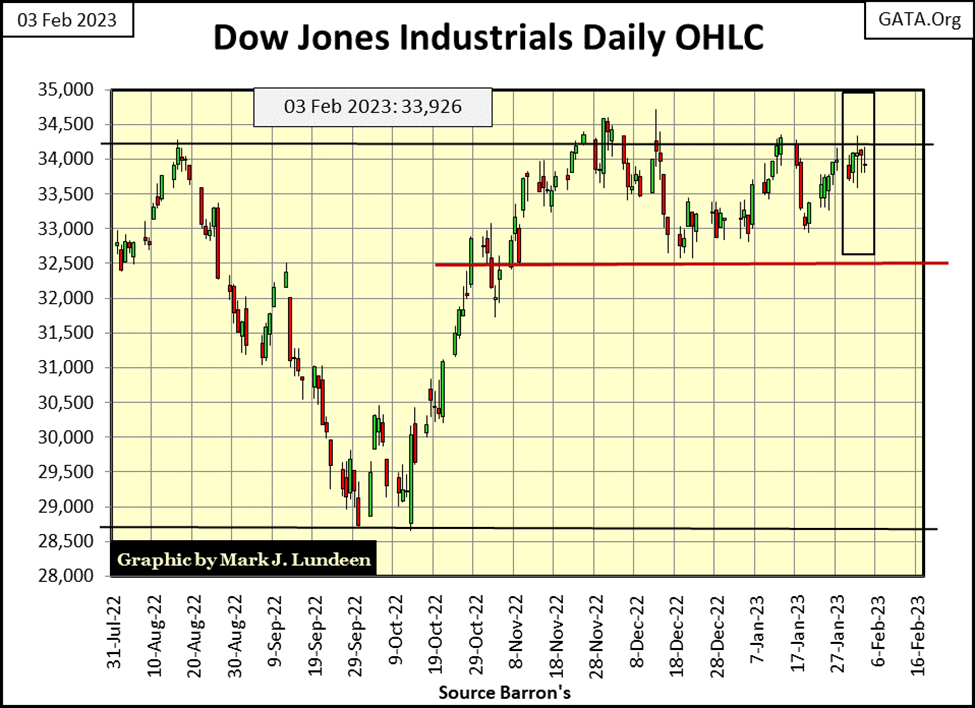
The longer this goes on, the least likely it becomes the Dow Jones will be making a new all-time high anytime soon. Every day this week, the Dow Jones closed close to 34,250, but failed to close above it. And should it do so next week, break above, what then? Hover over 34,250, until it once again breaks below it, as it did in November?
Are we in a bull market? A market where new all-time highs become common place? The bulls have much to do to convince me they have what it takes to make that happen.
I can’t see into the future, so sometimes I have to make assumptions based on what I see in the market. Right now, I’m going to assume the market is in a correction between two bear market declines; one past, and another decline yet to come. In other words; if the stock market can’t go up to new all-time highs in this best of times, when the bad days return, we’ll see the Dow Jones and the other major-market indexes deflate to new bear market lows. But when?
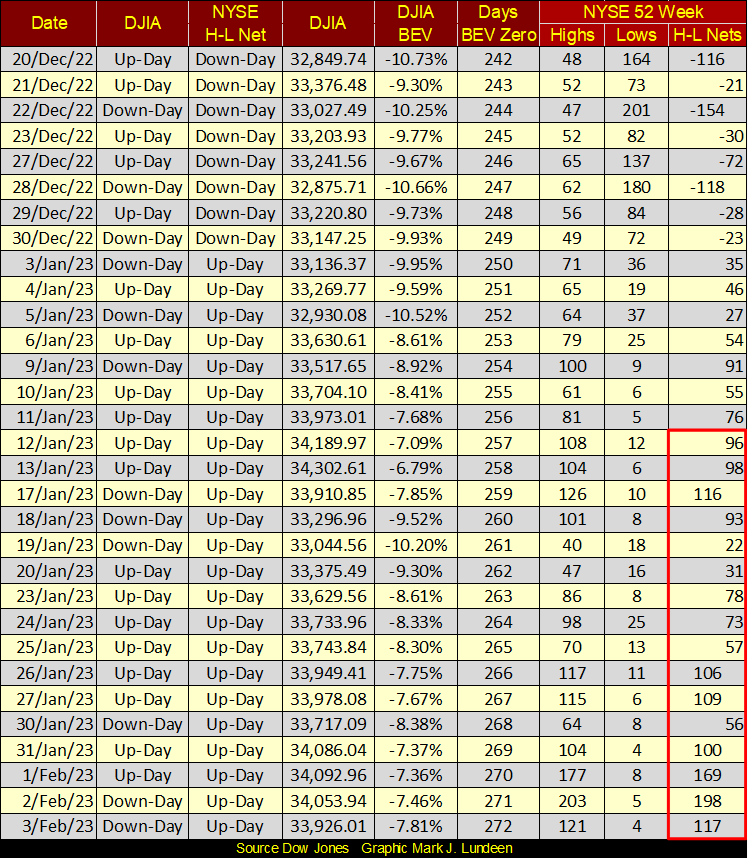
I wish I knew. But looking at the NYSE 52Wk H-L Net table below, at its Days BEV Zero column, we see this week closed at 272. It’s been 272 NYSE trading sessions since the Dow Jones made its last all-time high on 04 January 2022, and I have the feeling this number is going to get a whole lot bigger before we see another all-time high for the Dow Jones.
Looking at the H-L Nets themselves, the NYSE has transitioned from making negative triple digit nets at the end of December, to making positive H-L Nets in the past month. But during strong market advances, we’ll see NYSE H-L Nets of over +300. Can the bulls in this market, with shrinking NYSE margin debt and an ongoing QT do that? Time will tell all, but I believe being a bull on the stock market at this point, is only a bad habit that sometime in the future, Mr Bear is going to cure a lot of people of.
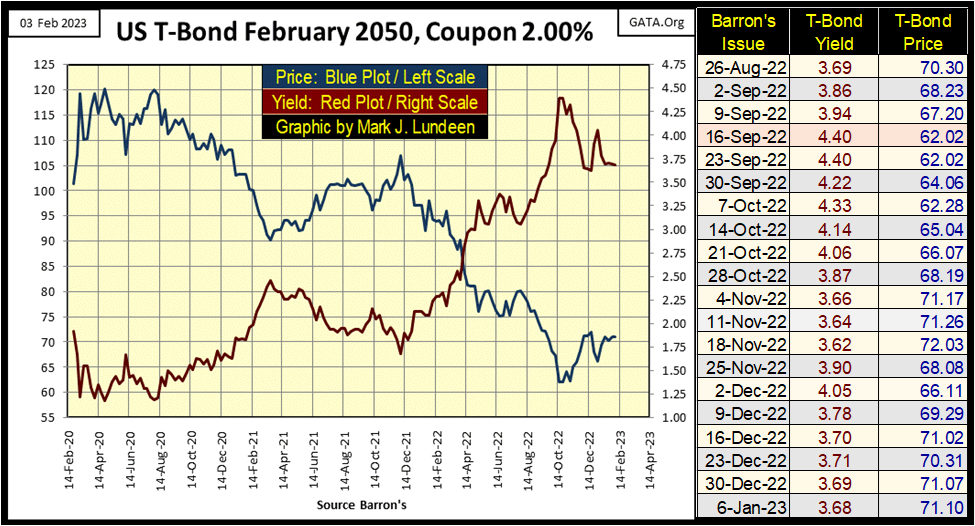
One current trend supporting the stock market; bond yields and interest rates have come down nicely since they peaked last October and November, as seen in the table below. Looking at the BP Delta row, the change in yields in basis-points (1% = 100 Basis Points), may not seem significant. But all of the yields below have at least stopped going up, as they had from January 2022 to their highs in late autumn.
Still for all of that, looking at this 30Yr T-Bond (below); from December 2021 to October 2022, its yield (Red Plot) increased from below 1.75% to above 4.25%, deflating its valuation (Blue Plot) by a whopping 43% in only ten months. It’s no mistake how during these same ten months, the stock market was also having its time of trouble, as you can’t have a bull market in stocks when the bond market is being mauled by Mr Bear.
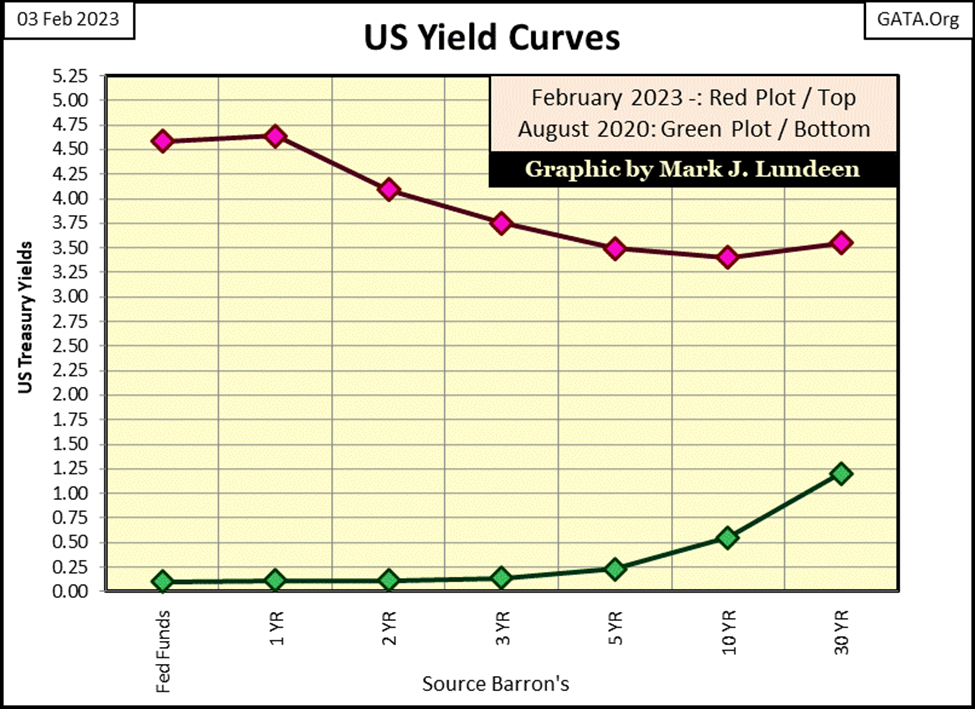
Another obstacle the stock-market bulls must hurdle; the FOMC has inverted the yield curve (next chart). Bond yields bottomed in August 2020 (Green Plot), and look at how they’ve increased since then. And this week the FOMC has once again raised its Fed Funds Rate, up twenty-five basis points. The Fed Funds Rate is now a full percentage point above the yield for the 30Yr T-bond. That’s a lot!
Looking at the current yield curve below (Red Plot), the LAST THING a “market expert” or market enthusiast, such as myself SHOULD THINK OF IS A BULL MARKET ON WALL STREET. Seeing the FOMC’s Fed Funds Rate a full 103 basis points above the yield of a 30Yr T-bond, I’m thinking economic recession, and a pending big-bear market mauling.
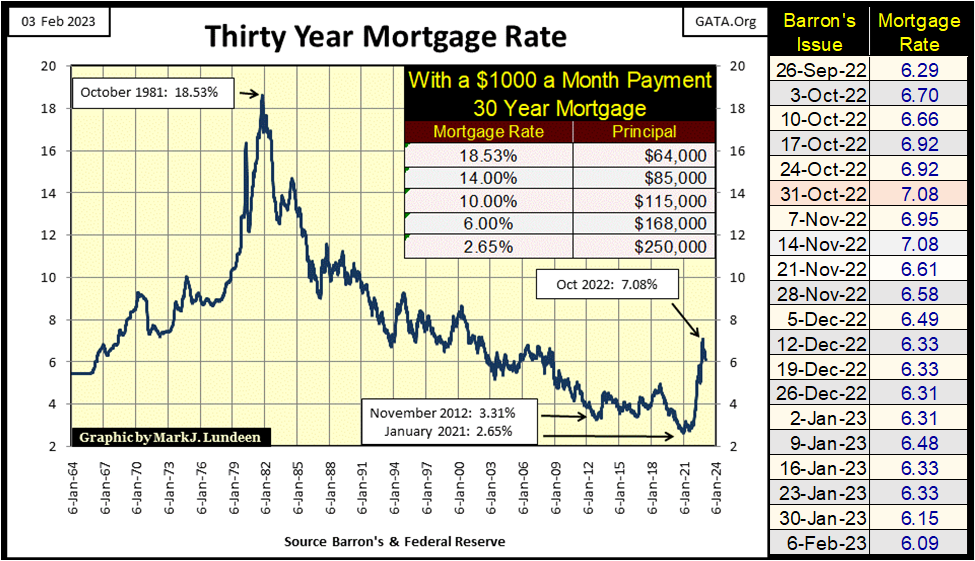
Here’s a chart for mortgage rates. Since the end of October, mortgage rates have declined by about one percentage point. So what? They’re still way above the historic lows of January 2021, and they aren’t ever going back down there. So, expect more deflation in the real-estate market in the years to come.
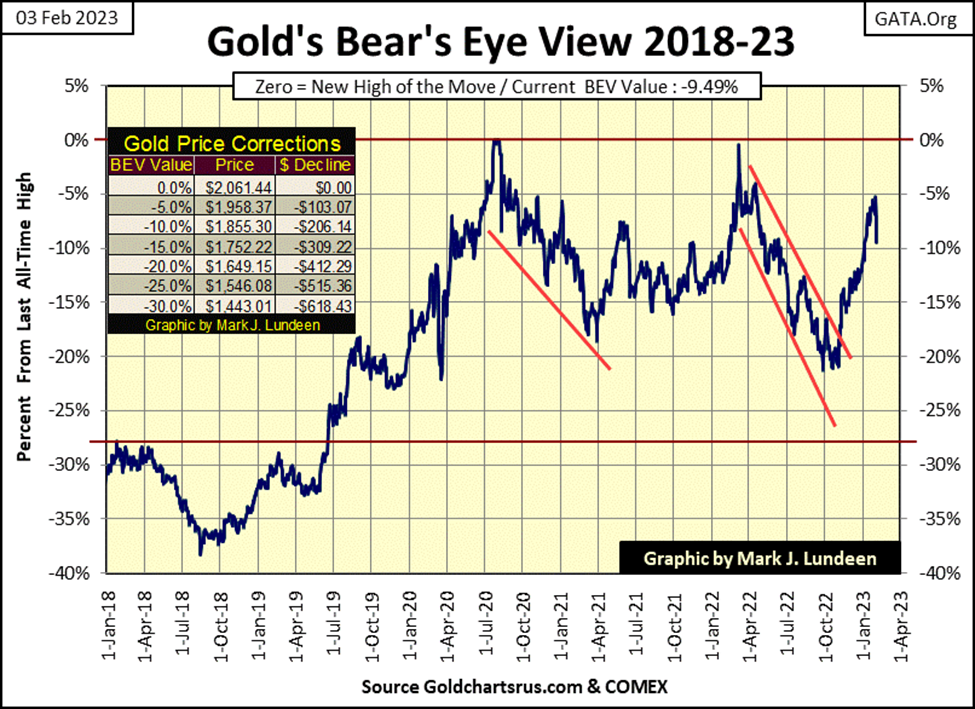
Now on to gold’s BEV chart below. Last week gold appeared to be making a move above its BEV -5% line; this week that almost happen on Wednesday. But then came Thursday and Friday. You can see Thursday and Friday in the chart below, where in two days the COMEX goons took gold down from the BEV -5% line, to just short of breaking below its BEV -10% line.
I’m not surprised. After gold’s advance off its lows of October, it was reasonable expecting a correction before it went on to new all-time highs. But the two-day plunge seen below is yet another outrage gold has had to endure from the “policy makers”, for what seems like forever.
So, what’s next? I remain bullish on gold, silver and the precious metal mining shares. If for no other reason other than Washington and Wall Street seem determined to destroy the American economy and US dollar. For all the frustration investing in precious metal assets can have, in a world like ours, investors really need some exposure to precious metal assets.
I’m going to take a break posting my step sum charts for gold and the Dow Jones for a while. The bear boxes in both of these charts are confusing, as the bulls in the stock market are refusing to toss in the towel and calling it quits, while the bulls in the gold market keep getting whacked. Thanks to the FOMC, the bad guys never run out of dollars, so never consider the possibility of calling it quits, and won’t until the FOMC tells them not to. We’ll look at them again in March or April.
Mark, you’re making the FOMC sound like some kind of bogeyman. Does anything happen in the market independent of these “policy makers?” Well, between those who dictate “policy”, and those who execute it, there must be many degrees of separation to provide reasonable doubt about exactly who is doing what.
But since the sub-prime mortgage crisis, I’d say not much happens in the market without the finger prints of the “policy makers” on it. Look at the Federal Reserve’s balance sheet below. Long gone are the days when the number of dollars in circulation dependent on how much gold the US Treasury held.
Today, the only limiting factor in dollar production is the fear the idiots have of the global financial system’s reaction to a QE#5, should they have to bail-out the market once again. And they will have to bail-out the market once again, and once again they will implement another QE to do so.
How much longer can this B*** S*** go on before the entire global financial system collapses? Longer than you and I might think possible, and then again maybe by the 1st of March. Your guess on the timing is as good as mine. What is not in doubt is in the end, the idiots at the FOMC will destroy all that they touch. Yet the mainstream-financial media will go to these same people to ask them what needs to be done to “restore stability” to the financial system.
My suggestion on how to best restore “stability” after over 100 years of the Federal Reserve having its way over all of us, would be along the lines Martin Luther suggested in dealing with the 16th century German banking dynasty; the Fuggers. The quote below is from an unpublished, and very short article I wrote before the sub-prime mortgage crisis. Luther’s quote is from William Durant’s volume on the Reformation.
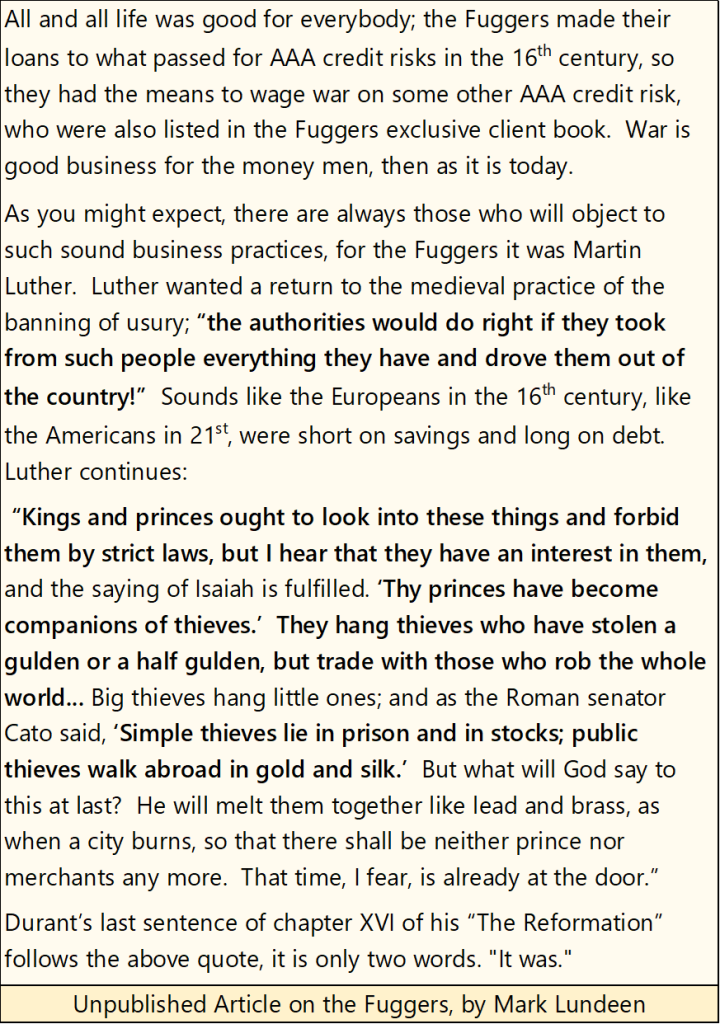
Why was such a fine article not published? It’s pretty simple; I write, someone else publishes. My publishers; who are still there, and reading this, loved the article. It was great! But could I do something about the name of the banking dynasty? What, The Fuggers? Isn’t this a sly way of calling the big guys on Wall Street a bunch of Mother Fuggers? Can’t publish that, Mark. Change the banking dynasty to something from 16th century Renaissance Florence, something on the Medici bankers.
Well, I couldn’t do that as I DID WANT to call the big guys on Wall Street a bunch of Mother Fuggers, because they worked hard to earn it. Maybe when the idiots begin their QE#5, my publishers will see the logic of using the Fuggers as the topic of this article, and then I’ll let the Fuggers fly.
Moving on to gold’s step sum table below, gold had become very overbought in January, with its 15-count rising up to a +9 for five days. Markets don’t like being very overbought, so a sell off is to be expected. My objection to this sell-off is it came from gold’s Wednesday’s high of the move at 1952.99, where in the next two days the COMEX goons shaved $90 off the price of gold.
In years past, we’d see some follow through selling from here. Maybe to where gold would lose 20% to 30% of its previous gains in the next few weeks. But I’m not sure the goons are up to it. Let’s see what happens next week.
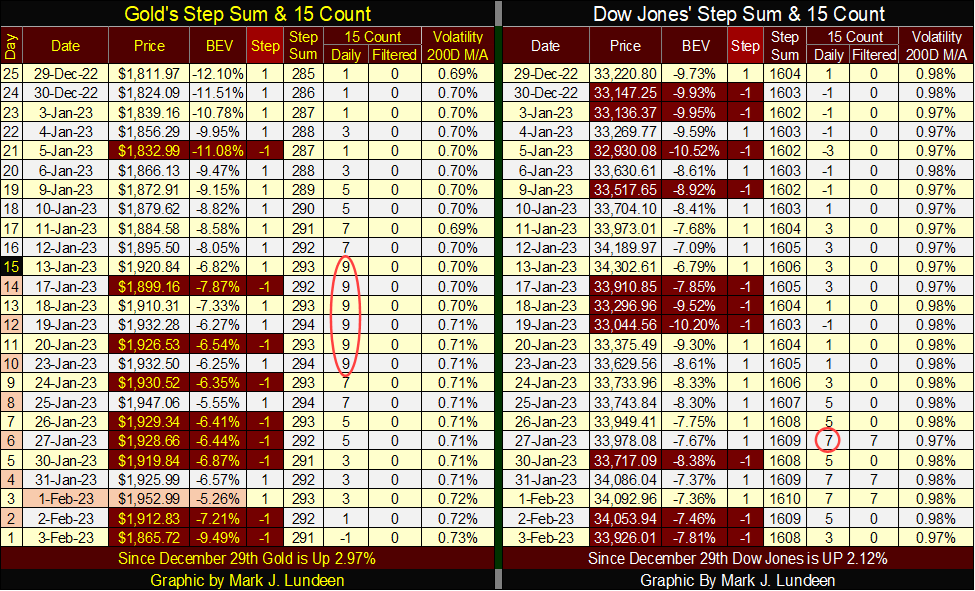
The Dow Jones also became overbought, with a 15-count of +7. Markets don’t like being overbought, and tend to sell off when they are. Next week should be interesting, for both gold and the Dow Jones.
__
(Featured image by sergeitokmakov via Pixabay)
DISCLAIMER: This article was written by a third party contributor and does not reflect the opinion of Born2Invest, its management, staff or its associates. Please review our disclaimer for more information.
This article may include forward-looking statements. These forward-looking statements generally are identified by the words “believe,” “project,” “estimate,” “become,” “plan,” “will,” and similar expressions. These forward-looking statements involve known and unknown risks as well as uncertainties, including those discussed in the following cautionary statements and elsewhere in this article and on this site. Although the Company may believe that its expectations are based on reasonable assumptions, the actual results that the Company may achieve may differ materially from any forward-looking statements, which reflect the opinions of the management of the Company only as of the date hereof. Additionally, please make sure to read these important disclosures.


Blockchain Evolves Toward AI, Finance and Quantum Security
Blockchain is evolving beyond crypto into finance, AI applications, and digital markets, while security and regulation remain challenges. Quantum threats...


The Italian Crowdinvesting Market Faces Sharp Decline in 2026
Italian crowdinvesting market continued to decline in 2026, with fundraising falling 36.8% year-on-year to €164.19 million. Platforms and active campaigns...


Sartorius Stedim Biotech Maintains Growth Momentum in H1 2026
Sartorius Stedim Biotech reported solid H1 2026 results, with revenue reaching €1.527 billion and EBITDA rising to €479 million. Growth...


Bank of Africa Launches BOA MDM Network to Boost Diaspora Investment in Morocco
Bank of Africa launched the BOA MDM Network to channel diaspora remittances into productive investment, aiming to raise their share...


Switzerland’s Medical Cannabis Reform Advances Access, But Barriers Remain
Switzerland’s 2022 medical cannabis reform improved patient access by removing federal approval requirements, but challenges remain. MEDCAN highlights barriers including...
 |
|
 |  |
 |
|
-

 Impact Investing2 weeks ago
ECB Adds Climate Risk Factor to Collateral Rules
-

 Crowdfunding3 days ago
Medelon Shooting Club Restores Hall After Successful Crowdfunding Campaign
-

 Biotech1 week ago
Alzheimer’s Study Reveals Immune Pathway Behind Women’s Higher Vulnerability and Potential New Treatment Approach
-

 Crowdfunding1 week ago
Avant Devices Moves Toward Electric Wheelchair Kit Production with New Funding Drive