Featured
Projecting and protecting your retirement income dividend portfolio
What will your dividend income look like a year from now? How about five years from now? Until now, the small investor never had a simple way to discover the answer to these questions.

What is your current portfolio income and what might that income look like a year from now? Being able to project overall portfolio income five years out might help to get a handle on projected future outgo and expenses. Following these guidelines can help you create your retirement income dividend portfolio.
What will your dividend income look like a year from now? How about five years from now? Until now, the small investor never had a simple way to discover the answer to these questions.
After all, no one has a crystal ball, of course.
Well, you might have one, but does yours tell the future for you? Lacking such a device, we turn to such things as spreadsheets to tell us our current situation.
Dividend stocks bought for growth of income
As a dividend growth investor, by definition, my strategy is tied to investing in stocks that consistently grow their income for me. Why am I so interested in this type of income growth? In a word, “inflation”.
Many of today’s younger investors are not as familiar and concerned about the inflation bogeyman as some of their older counterparts, like me. Some of us who have been around the block have memories of the hyperinflation of the 1970’s-1980’s seared into our brains.
Inflation of those times wasn’t as bad as Weimar, Germany in the 1930’s, when people had to bring a wheelbarrow full of almost worthless currency to the bakery, just to buy a loaf of bread. But the 1970’s and 1980’s were bad, nevertheless.
In reality, the real rise in prices, even in recent times, has been significantly higher than any wage increases. This has caught so many workers and retirees in a vise, causing them to lose purchasing power for the last twenty years.

In the 1930’s in Germany, people needed a wheelbarrow full of almost worthless currency just to buy a loaf of bread. (Source)
Low historical bond rates squeezed investors into equities
The Fed has used low-interest rates as a tool to spur growth in the economy. This low rate environment caused a great migration of investor funds, from CDs and bonds to high yielding stocks.
If we can find high-quality stocks with reliable earnings and dividend growth, then apply some fairly reliable metrics to them, we might have a fighting chance of choosing those companies that fit our criteria and be good candidates to pay our bills for us in retirement.
Real Time Dividend Income Projection
It’s one thing to know what your current dividend income is. But having a way to know what it might be a year from now, two years from now, and five years from now would add a bit of certainty to the equation. Having this information before committing to a particular investment might give us a better way to choose between competing investments, a way to better discern projected outcomes and estimated dividend income for the future to meet our future expenses in retirement.
Sadly, I do not have a crystal ball. I don’t even know anyone who I might borrow one from. But I do have certain metrics that can help me to know the future, to make it come in a little more clearly.
To help me come to better investment decisions I use the Real Time Dividend Income Projector.
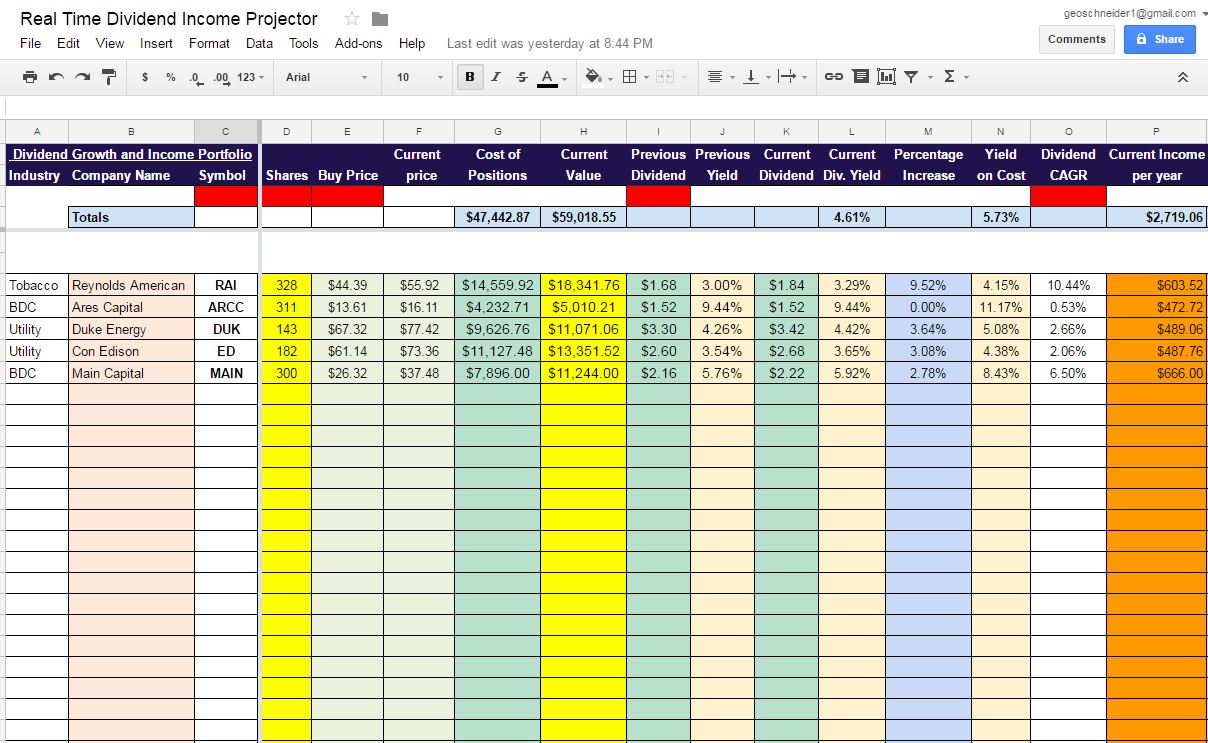
The Real Time Dividend Income Projector. (Source)
The inputs are minimal, yet the output of information is quite prodigious. I simply need to input the company’s ticker symbol, share amount and buy price. The projector automatically sources the current stock price and dividend. Then I simply need to input the previous dividend rate and the 5-year CAGR, easily available at various finance websites, like Yahoo Finance.
Once these few bits of data are input, the algorithms contained in this digital tool automatically calculate the previous dividend yield (where we’ve been), the new, current dividend yield (where we are now) and future dividend amounts appear before our eyes (where we’re going).
Robust features
Here is a list of all the features and functions found in this tracker:
- Current stock price will be automatically updated all day, throughout the day.
- The amount you paid for each position, as well as all your portfolio positions, are automatically totaled for you.
- The current value of each portfolio position and the entire portfolio is automatically updated throughout the day.
- The previous yield on the previous dividend rate is reflected.
- The current dividend rate is sourced automatically for you.
- Current dividend yield is updated all day as a reflection of the current dividend divided by the current stock price.
- The percentage increase, from the previous dividend rate to the new dividend rate is figured automatically, reflecting the strength of your company’s dividend growth. When the dividend is next increased, that parentage increase will be reflected automatically as well.
- Your yield on cost is automatically figured to reflect the current dividend as a reflection of what YOU paid for the stock.
- Once you input the 5-year CAGR, from a supplied source, all the fun begins. This digital tool will then calculate your projected dividend income from each of your stocks for each of the following five years and will total these income amounts for your whole portfolio for you. You will have a complete view of what your projected dividend income should look like, as long as your companies continue to grow their dividends over the next five years as they have over the past five years.
- The percentage increase in your dividend income for the future five year period will be shown, as well as the overall portfolio income percentage increase.
- Helping you to balance your portfolio as to income production, this tool will show you the percentage of portfolio income coming from each portfolio constituent. This becomes a powerful tool to help guard against total portfolio income failure by diversifying your portfolio exposure with a view towards creating equal amounts of dividend income from each stock position.
- Finally, the capital gain (loss) from each stock as well as the total portfolio will be automatically figured for you. This will also be updated in real time throughout the day for you.
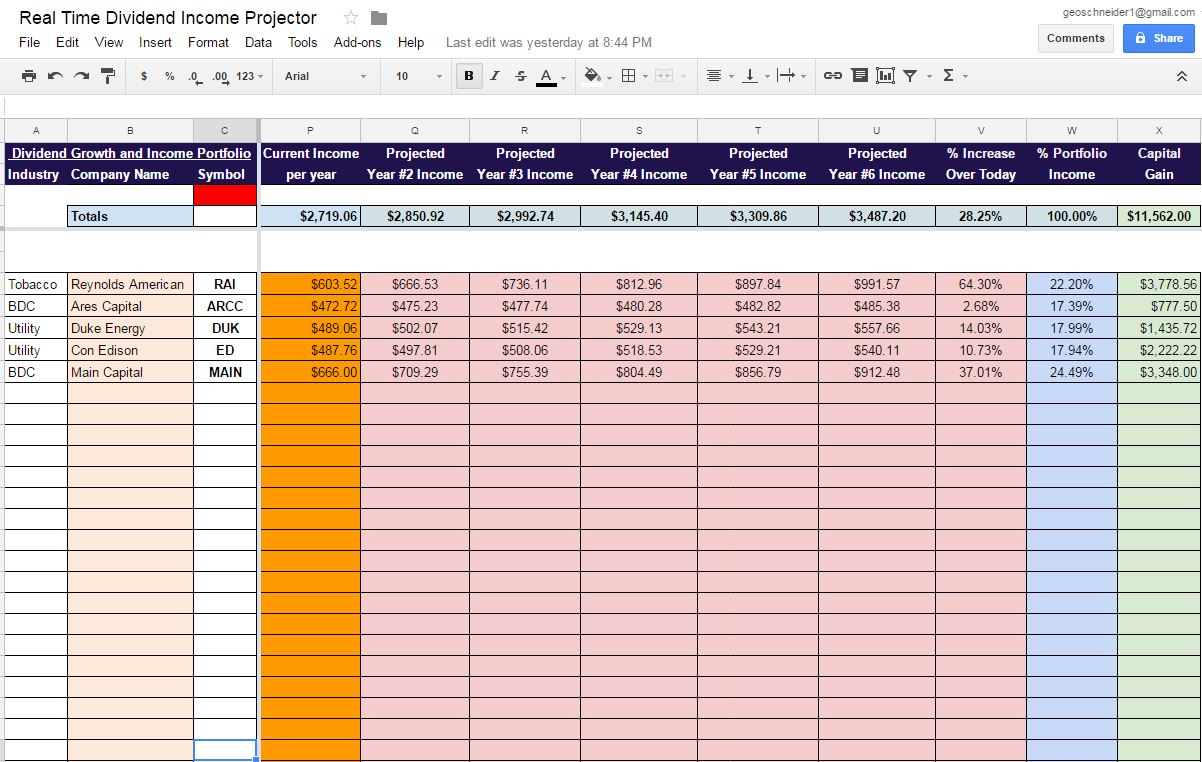
The Real Time Dividend Income Projector. (Source)
You can use this digital tracker as a comparative research tool, to measure different outcomes of several different stocks. The same few inputs made on each stock will give a wealth of information that will enable you to compare the eventual dividend income outcomes of various companies. Though year by year dividend rate comparisons are fruitful, the most important metric will lie in column U, informing us of the increased percentage that each company will accomplish in its dividend growth in the fifth year.
Armed with this very detailed and clear information, it becomes possible to make better investment decisions for those of us who are concerned about matching our income with eventual expenses in retirement and always staying a step ahead of inflation.
The Real Time Portfolio Tracker and other stock market investing applications comprise the full suite of tools I use to enhance my stock market income and performance.
The Real Time Dividend Income Projector. (Source)
Final thoughts
Investors who dismiss the pernicious effects of inflation do so at their own peril. The pervasive loss of purchasing power that it inflicts can turn a comfortable $500,000.00 nest egg into a scrambled egg, just twenty or thirty years into the future. Investing to stay ahead of inflation can help keep this bogeyman away.
—
DISCLAIMER: This article expresses my own ideas and opinions. Any information I have shared are from sources that I believe to be reliable and accurate. I did not receive any financial compensation in writing this post, nor do I own any shares in any company I’ve mentioned. I encourage any reader to do their own diligent research first before making any investment decisions.


Abivax Shares Surge as New Trial Data Eases Safety Concerns Over Ulcerative Colitis Drug
Abivax shares surged nearly 36% after positive updated trial results for its ulcerative colitis drug obefazimod reassured investors following earlier...


El Dorado Raises $9M to Expand Cross-Border Fintech Platform
El Dorado, a Latin American fintech improving cross-border financial services, raised a $9 million Series A led by Paradigm with...


Bitcoin Stalls Near $60K as Strategy Moves, ETFs Outflow, and EU MiCA Rules Take Effect
Bitcoin hovers near $60,000 with ETF outflows, while Strategy boosts reserves, sells BTC, and raises dividends to reassure investors. Ethereum...


Cannabis Dominates Global Drug Use: Trends, Risks, and Shifting Markets
Cannabis remains the world’s most widely used illicit drug, with 256 million users in 2024, surpassing all others combined. Growth...


Italy Approves First Hydrogen-Powered Train for National Rail Network
ANSFISA has approved Italy’s first hydrogen-powered train, the Alstom HMU214, for use on the Brescia–Iseo–Edolo line. Capable of 140 km/h,...
 |
|
 |  |
 |
|
-

 Impact Investing2 weeks ago
SBTi Net-Zero Standard 2.0 Enhances Corporate Climate Action
-

 Crypto5 days ago
Bitcoin and Ethereum Slide as Market Pressure Builds Amid Strategy Concerns and Layer 2 Disruptions
-

 Business2 weeks ago
Fed Policy Shift Raises Concerns Over Debt and Inflation Risks
-
 Crypto22 hours ago
Bitcoin Stalls Near $60K as Strategy Moves, ETFs Outflow, and EU MiCA Rules Take Effect
You must be logged in to post a comment Login