Markets
What are the reasons behind the declining US job growth?
Declining job growth could create a conundrum for the Federal Reserve. Most agree the Fed is likely to hike interest rates again in June. Naturally, the surprise would be that they do not hike interest rates.

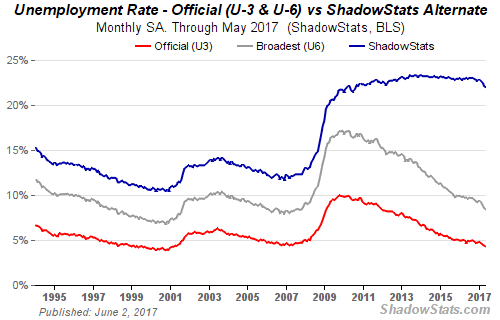
We admit it is difficult, but we are trying to push Donald Trump off as the lead-in. That is how “The Donald” is. He dominates the conversation. However, it is possible the focus should be on what appears to be a slowing in US job growth. The nonfarm payroll for May came in at a less than expected 138,000 jobs. The market had expected 215,000. Job growth is slowing on one hand; however, that was offset by a drop in the headline unemployment rate (U3) to 4.3%. Even when one takes into consideration the broader measure of unemployment (U6) that includes marginally attached workers and involuntary part-time workers, that measure fell to 8.4% the lowest in a decade. The Shadow Stats unemployment rate that is the U6 unemployment rate plus discouraged marginally attached workers unemployed over one year fell to 22% from 22.1%. In January 2017 that figure was at 22.9%.
Before we get too excited, however, it is worth noting that the fall in unemployment was almost solely due to a drop in the labor force participation rate that dropped to 62.7% from 62.9%. Three months ago, it was 63%. A decline in the labor force participation rate means that fewer workers are actually looking for work as they have most likely become discouraged and have dropped out. Interestingly enough, part-time employment rose 133,000 in May accounting for almost the entire nonfarm payrolls rise. Part-time employment is usually low paying, no benefits, and shaky employment at best.
(Source)
Declining job growth could create a conundrum for the Federal Reserve. Most agree the Fed is likely to hike interest rates again in June. Naturally, the surprise would be that they do not hike interest rates. But, not only are there are signs that job growth is slowing, but inflation remains stubbornly low, below the Fed’s 2% target rate. The core inflation rate dropped to 1.5% recently after being as high as 1.8% in February.
With the unemployment rate down to 4., % the expectation is labor conditions are tightening. Tightening labor conditions usually translate into higher inflation. It’s not happening because the unemployment rate is falling—not because more people are working but because fewer people are actually looking for employment, having become discouraged. There are 94.4 million Americans considered not in the labor force. Not all of them are retirees, disabled workers, or stay-at-home mothers (or fathers). There are 51 million US retirees. Retirees are a growth industry in all industrial nations (including Canada), and, as the population ages, it is a natural dampener on the unemployment rate. Despite the fall in the unemployment rate, inflation remains low and in countries like Japan, it translates into deflation.
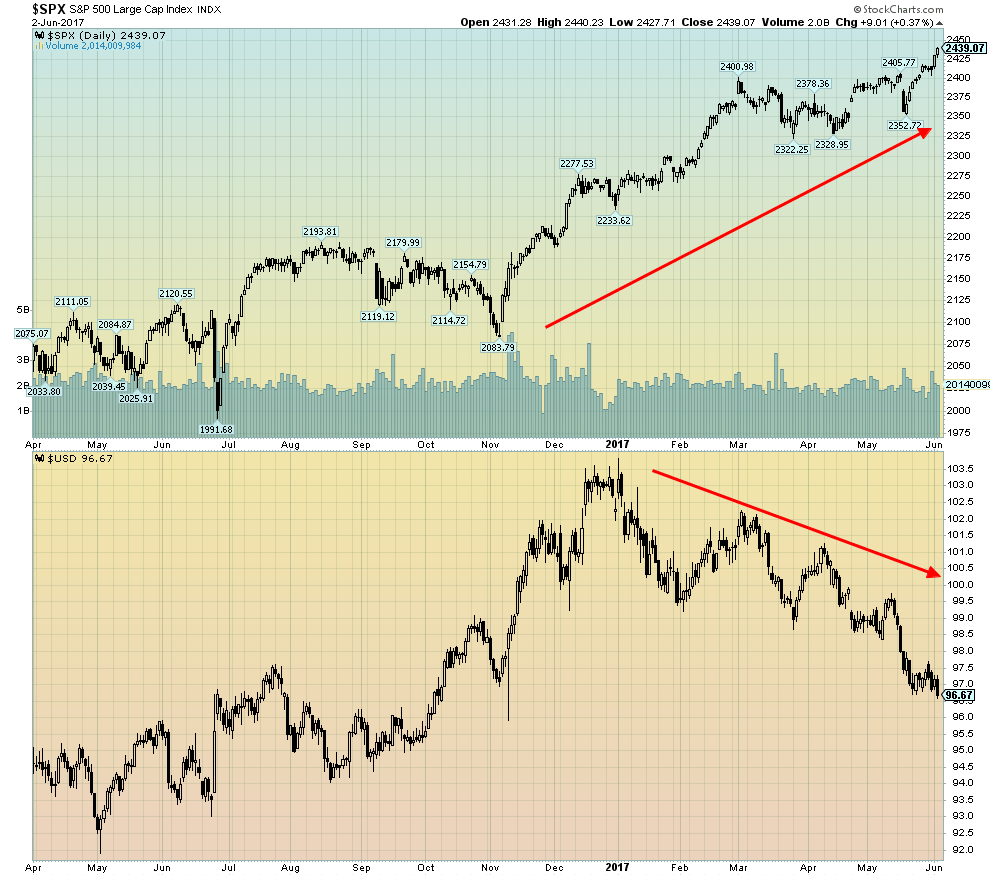
Globally there is also a lot of slack, especially in the industrialized nations. This could also be a dampener on inflation. As the Fed tries to raise interest rates, that in turn puts upward pressure on the US Dollar and the, as a result, the US imports disinflation into its economy. But a funny thing is happening on the way to the forum. The US Dollar has actually started to fall even as it appears money is still flowing into the US stock market, a market that once again hit new all-time highs this past week. We have seen this phenomenon in Japan too—as the Japanese Yen falls the stock market moves higher but when the Yen strengthens the stock market tends to fall. In the US it seems to be dollar up, stocks up, dollar down stocks up.
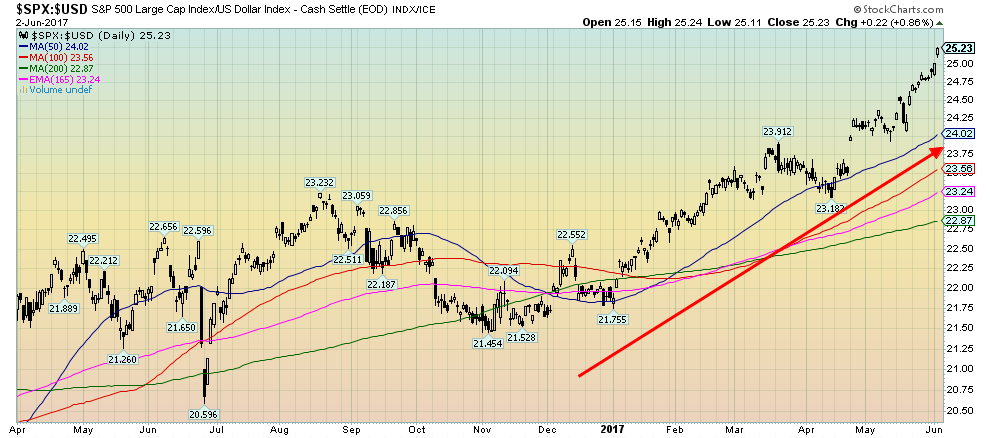
We thought we would show an interesting series of charts involving the US$ Index and the S&P 500. The first chart below shows the S&P 500 and the US$ Index. Since the US$ Index topped in December 2016 the S&P 500 has been on a tear to the upside even as the US$ falls. The second chart shows the S&P 500 and the US$ Index as a ratio. The ratio is rising which is consistent with the S&P 500 outperforming the US$ Index.
The third chart looks at the long-term picture and what we discover is a falling US$ has been reasonably consistent with a rising US stock market. During both the 2000–2002 Internet/High Tech crash and the financial crash of 2007–2009 the US$ Index was rising even as the stock market was falling. What we would probably discover is funds instead were flowing into bonds as protection in a falling stock market. And given a crisis, it was the old adage of a flight to quality including international flows into the US$. When things calm down the flows go elsewhere—into the stock market or back out of the country to other countries.
(Source)

(Source)
(Source)
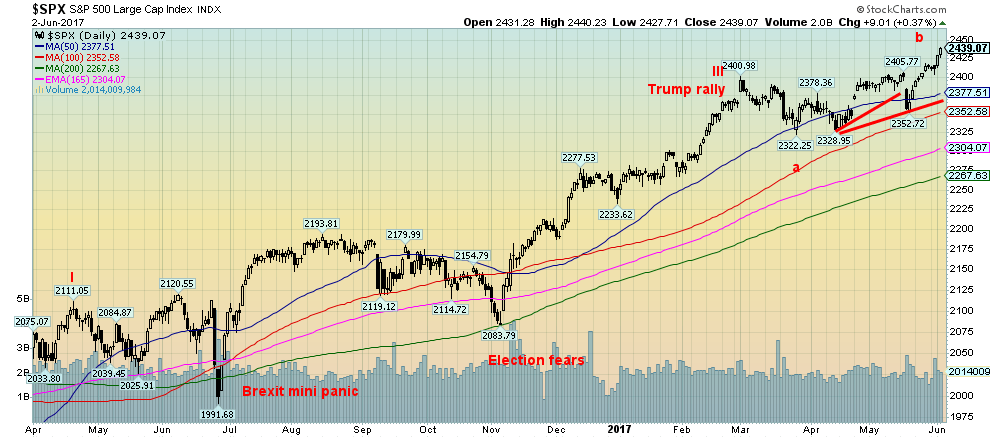
With the US stock market breaking out to new all-time highs one is tempted to believe that the recent correction is over. But it is not unusual to see a higher “b” wave than the previous top. Therefore, the recent correction that got underway in February may not yet be complete. The reality is there is little volume and no momentum behind this rally making it suspect. It is not unusual to see weakness into June before a counter rally develops into July/August. Watch for weakness. The most recent low was at 2,352 and if that breaks we are liable to make the “c” wave low near the “a” wave low of 2,320. After that, the summer rally should develop.
(Source)
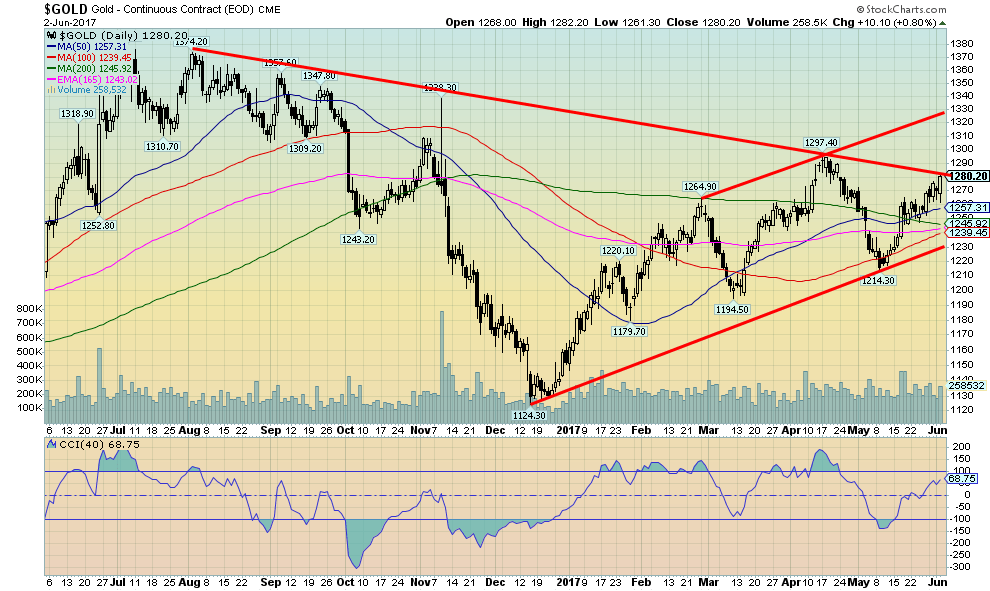
Gold, meanwhile, responded positively to the weak nonfarm payroll numbers on Friday jumping roughly $13. It is interesting to note that April’s nonfarm payroll was revised down to 175,000 from 211,000, but who is paying attention. That is a considerable drop for the first month revision. Further, the March nonfarm payrolls were revised down to 50,000 from 79,000. The past three months average is 121,000, well below the previous year’s 180,000 and barely what is needed to keep pace with population growth. The Fed rate hike in June is looking iffy. Very iffy.
(Source)
Gold is threatening to break out and take out the previous high of $1,297 and most likely $1,300 as well. The next significant resistance is seen up around $1,330. A firm breakout over $1,300 could also result in a challenge of the 2016 high near $1,377. Silver has also improved now to $17.52 but remains ways from a firm breakout over $18.25. Above $18.25 odds favor a return to the 2016 high of $21.23. Silver remains undervalued compared to gold.
If there is a concern it is the gold stocks. Both the Gold Bugs Index (HUI) and the TSX Gold Index (TGD) fell this past week losing 1.7% and 0.4% respectively. This was against the backdrop of gold gaining almost 1% and silver up about 1.2%. Another concern is the commercial COT that slipped this week to 27% from 28%. It was at 31% just two weeks ago. As gold rises it is not unusual for the commercial COT to start to fall. But the commercial COT never got to levels that would leave us comfortable. The silver commercial COT slipped to 30% from 31% and 33% two weeks ago. Neither are a big drop, but it is a concern. If gold and silver should turn back down from these levels, and that cannot be ruled out, there is considerable support for gold down to $1,240 to $1,260. Our expectations are that any pullback would see this zone hold.
One thing we can note about the silver COT. The long open position of the large speculators COT remains near 100,000. This is a very high number for the large speculators. It remains high even as the market has been weak. This is bullish long term as what it is telling us is that there is a large core position being held by the large speculators. If they were weak hands they would be selling or in this case closing their long positions as the market falls. They are not. Instead, they maintain a large core position.
Gold can remain weak through June and even into July before a stronger rally develops. However, it is noteworthy that last year gold rallied strongly in June before topping in July. So it can invert. Continued weakness now for gold could be quite positive later on. Gold stocks are quite cheap at these levels. But current weakness in the gold stocks could be pointing to further corrective action in gold before it regroups and rises again.
Not to ignore “The Donald” but it was another typical week of him dominating the headlines. This time the big story was Trump pulling the US out of the Paris climate accord prompting considerable opposition and criticism led by Germany but also including Republican congressional representatives and CEOs of large US corporations. German leader Angela Merkel was prompted to say that Europe’s days of relying on America are “over to a certain extent” and therefore Germany and its European allies “really must take our fate into our own hands.” Some 195 countries were signatories to the Paris climate accord. The US now joins Syria and Nicaragua as the only countries that didn’t sign on. Ironically, the US can’t really pull out of the accord until 2020 and it still has obligations. Some have noted that the US is turning its back on the West.
Stock markets shrugged their shoulders and moved to new highs. It seems the worse the news gets, the higher the stock market goes. Climbing that wall of worry?
—
DISCLAIMER: This article expresses my own ideas and opinions. Any information I have shared are from sources that I believe to be reliable and accurate. I did not receive any financial compensation in writing this post, nor do I own any shares in any company I’ve mentioned. I encourage any reader to do their own diligent research first before making any investment decisions.


Advances in Biomarkers and Targeted Therapies Transform Kidney Care in Autoimmune Disease
New biomarkers and targeted therapies are reshaping the management of kidney damage in autoimmune diseases like lupus and vasculitis. Experts...


Bitcoin Rises on Iran Deal as Crypto Markets React to AI and SpaceX News
Bitcoin rose above $65,000, gaining about 5% as a tentative Iran war agreement boosted markets. ETFs still show weekly outflows....

Rising Inflation, Fed Uncertainty, and Market Excess Amid War and SpaceX Mania
Rising inflation, driven by war, debt, and money growth, puts the Fed in a difficult position ahead of its meeting....


SpaceX IPO Sparks Déjà Vu as Market Risks Loom and Gold Bulls Stay Hopeful
The author compares the 2000 AOL Time Warner merger to SpaceX’s planned IPO, warning it may signal a market top....


The TopRanked.io Guide to 2026’s Biggest and Best Affiliate Opportunities
Want to earn affiliate commissions on literal billions of dollars worth of revenue? Then this week, we've got something special...
 |
|
 |  |
 |
|
-

 Crowdfunding1 week ago
Historic KiHa 2101 Railcar Restored in Japan Through Community Effort
-

 Fintech2 weeks ago
Barcelona Strengthens Its Position as a Southern European Fintech Hub
-

 Impact Investing4 days ago
EU Approves €23B Italian Renewable Energy Plan to Boost Climate Goals
-

 Biotech2 weeks ago
Early Use of Tirzepatide Shows Strong Results in Type 2 Diabetes Study
You must be logged in to post a comment Login