Featured
Recession, or No Recession, That Is the Question
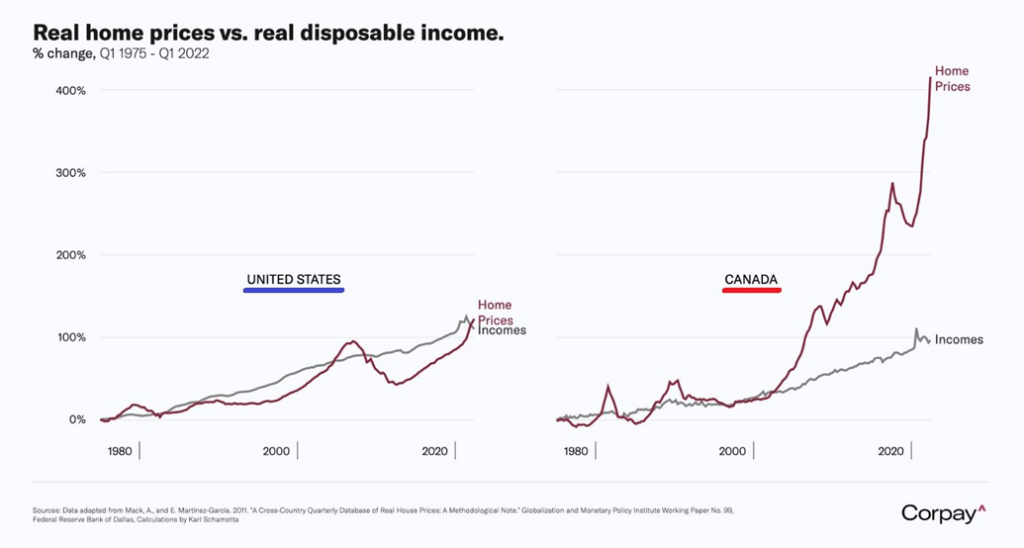
It’s official. We are in a technical recession. No, not an official recession. That’ll be announced later. Although so far Canada is holding better. But Canada’s housing market looks very vulnerable. See chart on real home prices vs. real disposable income. Governments are wobbling (Italy, Argentina, more) and the EU energy crisis continues as all jockey for position.
On July 27, 2022 the Bureau of Economic Analysis reported that the U.S. economy shrank 0.9% in Q2. This is the first estimate. This followed a 1.6% contraction in Q1. Technically the U.S. has entered a recession, although you’d never know it with employment continuing to be high with still lots of job openings, unemployment low, and consumer spending slowing but still robust. Employment is a lagging indicator.
Fed Chair Jerome Powell’s response was he did not believe the U.S. was in recession. President Joe Biden also did not acknowledge that the U.S. could be in a recession. That’s understandable as it would not be politic for either one of them to say that until an official agency has declared a recession.
The National Bureau of Economic Research (NBER) has not weighed in declaring a recession, nor has the Bureau of Economic Analysis. Powell also said inflation was transitory when the first high inflation numbers came out. So, it’s no surprise that he would not yet declare a recession when the official agencies have not yet confirmed it. But from our standpoint, the Greater Recession—and some say it will become the Greater Depression (Nouriel Roubini aka Dr. Gloom)—is now underway. On a year-over-year basis, the U.S. economy is still growing with Q2 GDP up a small 1.6%, down from 3.5% reported in Q1.
So far, this is a technical recession. The Bureau of Economic Analysis (BEA) defines a recession as “a significant decline in economic activity over more than a few months, which is assessed using several indicators, including the labor market, consumer and business spending, industrial production, and incomes.” So, with two consecutive quarters of negative growth, this is a technical recession, not an official one.
Inflation, however, was last reported at 9.1% and the personal consumption expenditures (PCE) price index came in at 6.8%. Average hourly earnings, on the other hand, are up only 5.2% over the past year. But the fact that wages are trying to catch up keeps pressure on the inflation rate. What all this tells us is that we have a slowing economy and high inflation. That equals—stagflation. The last time we saw stagflation, the stock market did nothing for 16 years, falling 46% at one point from January 1973 to its low in December 1974. From 1966 to 1982, the Dow Jones Industrial (DJI) was down 21% but on an inflation-adjusted basis it fell 73%. Gold, meanwhile, soared over 2,300% at one point, although during the same time frame as the DJI it soared 800% or 200% when adjusted for inflation.
Real GDP, CPI, PCE Price Index – 1959–2022
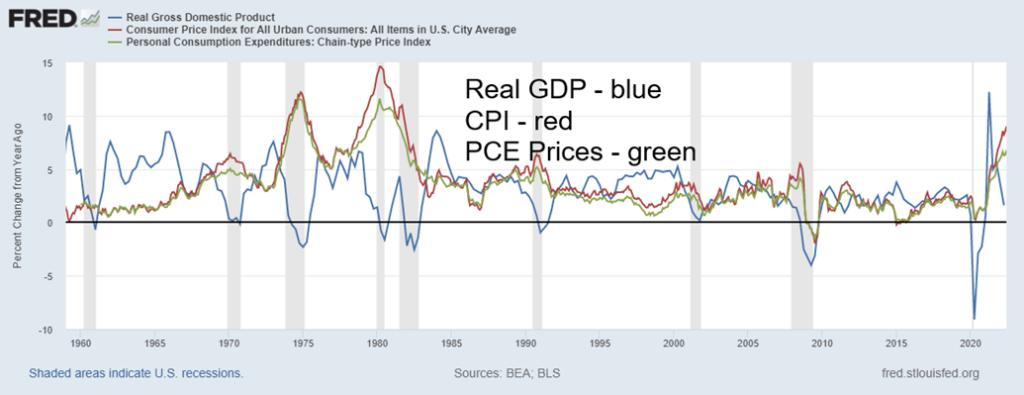
It was no surprise that the Fed raised the key rate 75 bp. That was widely expected. And it is no surprise that the Fed continues to hint at a 50 bp hike in September and 25 bp in November and December. They want to bring down the rate of inflation. Hiking interest rates is a blunt instrument. The Fed acknowledges it could cause a slowdown. They will get their slowdown but it may turn out to be steeper than they would like. GDP growth is now below the rate of inflation, as the chart above shows. Note the last time that happened we had the 2008 financial crisis. To a much lesser extent, the same relationship was prevalent during the pandemic crash and recession. The same relationship existed throughout the 1970s and into the 1980s before GDP growth once again exceeded the inflation rates. So, will it be a soft landing or hard landing? The former is what everyone wants. The latter is what’ll they’ll probably get.
Debt is huge problem, not only in the U.S. but in Canada and the rest of the world as well. Hike interest rates and somebody is going to fall because they are over-leveraged. A 1% hike in U.S. interest rates translates into an additional $300 billion in interest charges to the U.S. federal debt, currently at $30.6 trillion. By the time they reach their goal of 3.5% Fed rate they will have hiked rates 3.25%. That in theory could translate into an additional $975 billion annually in interest the U.S. government has to pay. But it also impacts corporations and households. Multiply that around the world—in Canada, the EU, etc.—and the costs of hiking are enormous. And if the economy tanks, will they go back to slashing rates and pumping billions (trillions?) in QE into the economy to prevent it from collapsing? That has been the formula since the stock market crash of 1987. That and billions (trillions?) in debt drawn down by corporations and households because of ultra-low interest rates.
The question is, as always, who is going to fail? Sri Lanka defaulting is one thing. But pressures in the EU, along with the ongoing sanctions war with Russia and now even gas rationing in the EU, are putting pressure on individual countries’ debt. What about an EU debt crisis involving Italy? The previous EU debt crisis was largely confined to the PIGS (Portugal, Ireland, Greece, and Spain), but Italy’s economy is about the same size as the PIGS combined. Italy’s government debt is currently higher than the PIGS combined. Italy is rated BBB, the lowest investment grade rating. Portugal is also rated BBB. Spain and Ireland are both rated A while Greece is rated BB. For the record, the U.S. is rated AA and Canada is rated AAA, one of the few remaining countries holding a coveted triple A credit rating.
Mario Draghi, a key figure in the Italian government has resigned, putting the entire Italian government on edge and bringing into question Italy’s huge debt. Argentina’s government has effectively collapsed, putting Argentina on the verge of economic collapse once again. The Iraq government is under siege. Others are wobbling. We noted Sri Lanka. Add in Lebanon, Suriname, Zambia—all of which are in default and others potentially on the verge of default like Pakistan. Russia is in default but that was artificially caused by the U.S. refusing to allow Russia to make its payments so as to put them in default. Belarus is on the verge of default and Ukraine, war or no war, was already in economic and debt trouble. As well, Ukraine ranks amongst the most corrupt nations in the world (yes, Russia ranks even lower).
However, we continue to be more concerned about corporate and household debt as opposed to government debt. Governments can inflate (monetize) their way out of the debt problem. Bailouts will come from the IMF or even China. All U.S. debt has increased over 80% since the financial crisis of 2008, up an incredible $41.1 trillion. Of that, federal debt rose 194% or $20.2 trillion, corporate debt was up $13.5 trillion or 65%, while household debt increased $6.4 trillion or 37%.
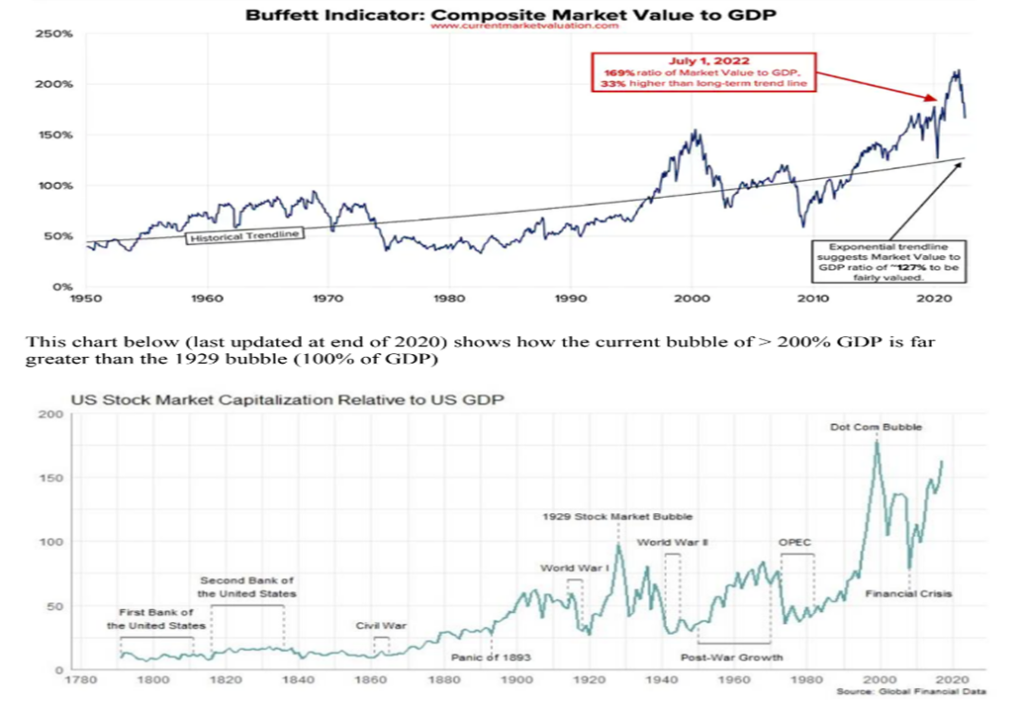
Stock markets have already failed. The number? $35 trillion. That was what was quoted recently in Bloomberg (www.bloomberg.com), representing the amount of global wealth destroyed in the first six months of 2022. The number includes both stocks and bonds. But the trouble is, the stock market still remains too high according to the infamous Buffett Indicator (named after Warren Buffett). Our chart on page 5 shows the Buffett Indicator, along with a chart of U.S. stock market capitalization to GDP. Based on a long-term exponential trendline, the stock market has considerably further to fall to return to the mean. The July 1, 2022 ratio for the Buffett Indicator was 169% of GDP. The exponential trendline is at 127% of GDP. They don’t just return to the mean, they go under for a period to re-balance. One estimate we saw was that global wealth could fall another $35 trillion to bring things back to the long-term mean.
The same thing is going to happen in the housing market. Canada’s household debt to income is, by some standards, an “accident waiting to happen.” According to Trading Economics (www.tradingeconomics.com), Canada’s household debt to income at 180% is the fourth highest in the world, just behind Norway, Denmark, and the Netherlands. Household debt to GDP is also the fourth highest at 106%, just behind Switzerland, Australia, and South Korea. The Royal Bank of Canada (RBC) expects Canada’s average home prices to fall roughly 12% into 2023. RBC says it is the steepest decline in the last five downturns. Except from what we’ve seen, housing prices are already down about that much and we are just getting started. The chart below suggests that home prices vs. real disposable income are so far out of line that a decline in housing prices of 12% may be just be a starting point, not the end point. As the chart shows, the situation in the U.S. is not as bad but they too could see a decline in house prices.
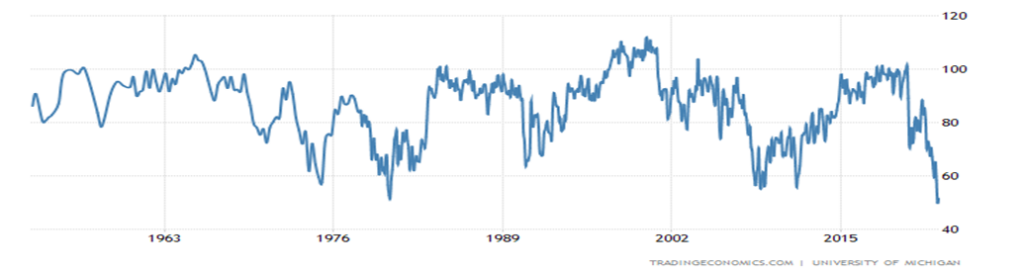
Consumer confidence, as measured by the Michigan Consumer Sentiment Index, is already at its lowest point since 1950. And we are only starting to show signs that we may be in a recession. Canada has a way to go before hitting the depths it saw during the March 2020 pandemic panic. Surprisingly, real consumer spending in Q2 was up 1%. However, it was below the 1.8% in Q1. Retail sales and personal spending continue to be somewhat robust but are falling. The question is, how much is fading from discretionary spending as opposed to necessary spending—i.e., food and energy? When Walmart falters, as was reported this past week, everyone should be concerned. Discretionary spending is falling. But purchase of necessities, such as food and energy, continues.
Michigan Consumer Sentiment Index 1950–2022
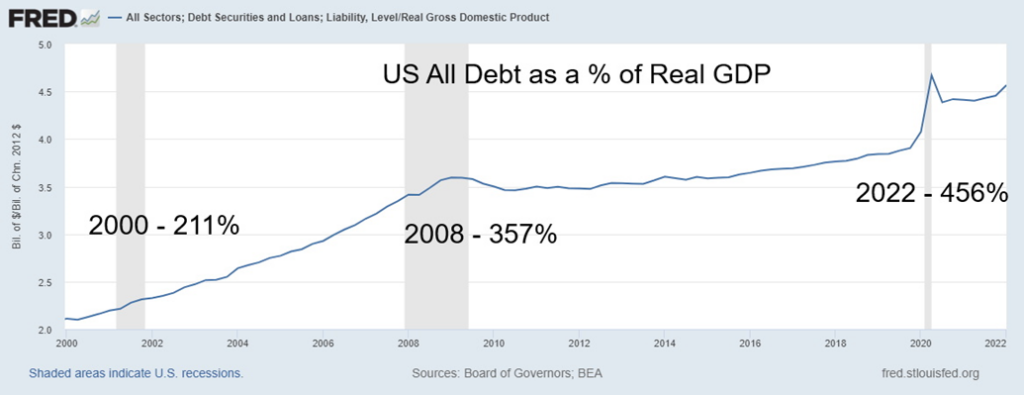
The growth in debt has been phenomenal, especially since the financial crisis of 2008 and what was termed the Great Recession. As the chart below shows, all U.S. debt to Real GDP was 211% in 2000, rose to 357% during the 2008 financial crisis, and now sits at 456%. And that’s down from the pre-March 2020 pandemic panic when it hit its all-time high of 467%. Can it go higher? It is possible but odds are against it. Not when everything is overvalued. A reckoning of considerable proportions is on its way. Oh yes, for the record, the same ratio was 18% back in 1950. Even since 1990 the ratio has gone up over 200%.
U.S. All Debt as a % of Real GDP 2000–2022
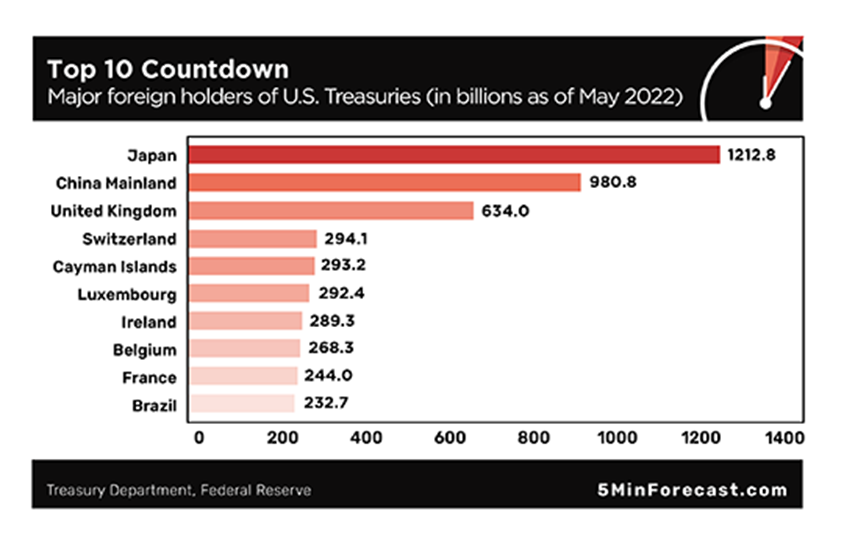
One final item that needs to be pointed out: China’s holdings of U.S. treasuries are slowly being wound down. Or, so it appears. According to the May data (latest available) of the U.S. Treasury (home.treasury.gov), China’s holdings of U.S. treasuries have fallen almost $100 billion in the past year. As a result, China is under $1 trillion for the first time in years. Japan is now the largest holder of U.S. treasuries with $1.2 trillion. In the past year alone, foreign holdings of U.S. treasuries are actually up $277 billion. The holdings of the United Kingdom (U.K.), represented by the Bank of England (BOE), are up $166 billion. Others, including the central bank of Switzerland and holdings in the Cayman Islands, have also increased.
The inevitable question is, why? Does China want to dump its holdings so they have less reliance on U.S. treasury issues as part of their reserves? Do they want to wean themselves off the U.S. dollar? After all, China has seen what happened to Russia when the U.S. placed sanctions on them to freeze assets. And if they are, at least, just allowing the bonds to run off rather than actually selling them, where are they placing the funds? In other foreign currency bonds? In gold?
Jim Rickards (economist, investment banker, author Currency Wars) believes that China is facing a liquidity crisis. There have been runs on banks, particularly in the central province of Henan where thousands of investors lost everything. Unrest followed, resulting in violence. Social unrest is not something China can tolerate. So, it’s possible they need the funds to calm the markets and prevent a bigger crisis from breaking out. Apparently, there is also fraud involved. But the run has made many other banks shaky and is negatively impacting China’s bubble property market.
All of this is coming against the backdrop of China ramping up tensions with the U.S. with regard to Taiwan concerning a proposed visit to the island by U.S. House Speaker Nancy Pelosi. China has warned the U.S. not to “play with fire.” An opening of a second front in Taiwan would put the entire world on edge for World War III. Any war involving Taiwan, China, and the U.S. would be devastating for the world economy because of Taiwan’s world-leading position as a producer of semiconductors. “Taiwan Semiconductor Manufacturing Co. makes 92% of the advanced semiconductors necessary for every smartphone, laptop, and ballistic missile in the world” (Niall Ferguson – The Four Mysteries of Pelosi’s Troublesome Taiwan Trip, Bloomberg – July 29, 2022). It is estimated that overall Taiwan is 66% of the global chip market. In addition, key global shipping lanes would be shut down. Simply put, war with Taiwan would devastate the global economy.
All this is against the backdrop of the BRICS countries—Brazil, Russia, India, China, South Africa—working on not only an alternative global payments system to counter the U.S.-controlled SWIFT, but alternatives as well to U.S.-controlled organizations such as the World Bank and the International Monetary Fund (IMF). In particular, there is a move afoot with the BRICS to create a new reserve currency to challenge the global hegemony of the U.S. dollar as the world’s reserve currency. The new currency would be backed by gold.
More recently, the IMF has increased the Chinese yuan’s position in Special Drawing Rights (SDRs), reflecting the rise of the yuan as a global currency. The current SDR basket is made up of 43.4% U.S. dollar, 29.3%-euro, 12.3% Chinese yuan, 7.6% Japanese yen, and 7.4% British pound sterling.
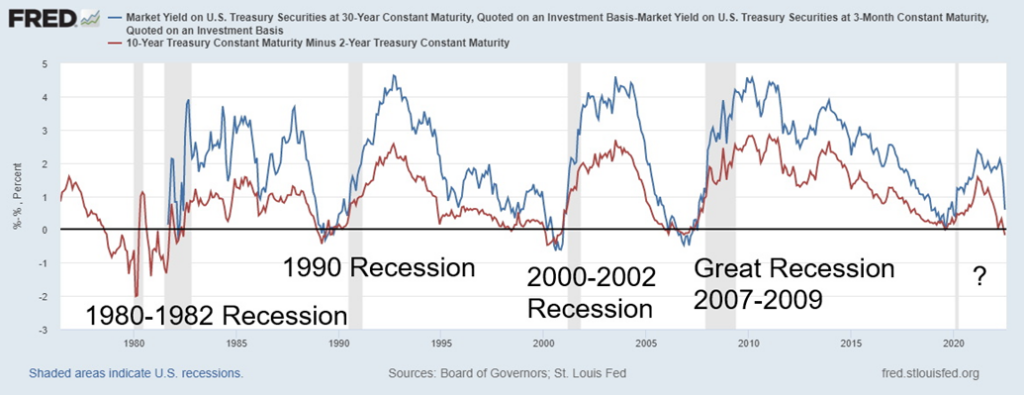
All signs are pointing to a recession, whether one wishes to call it technical or not. Yield spreads continue to narrow and our closely watched 2–10 spread remains in negative territory. Another closely watched yield spread, the 3-month – 30 year has narrowed but has not yet gone negative. Currently, the spread sits around positive 59 bp but has been falling rapidly. As we have noted, the question is not whether we are going into a recession, but how deep will it go? And are the central banks of the world out of bullets to deal with another downturn and potential stock market crash? The world is buried in debt. If banks fail again, there won’t be bail-outs—there will be bail-ins. We could be on the cusp of a Great Reckoning.
30 Year Treasury Bond minus 3-Month T-Bill (blue)
10 Year Treasury Note minus 2-Year Treasury Note (red)
1976-2022
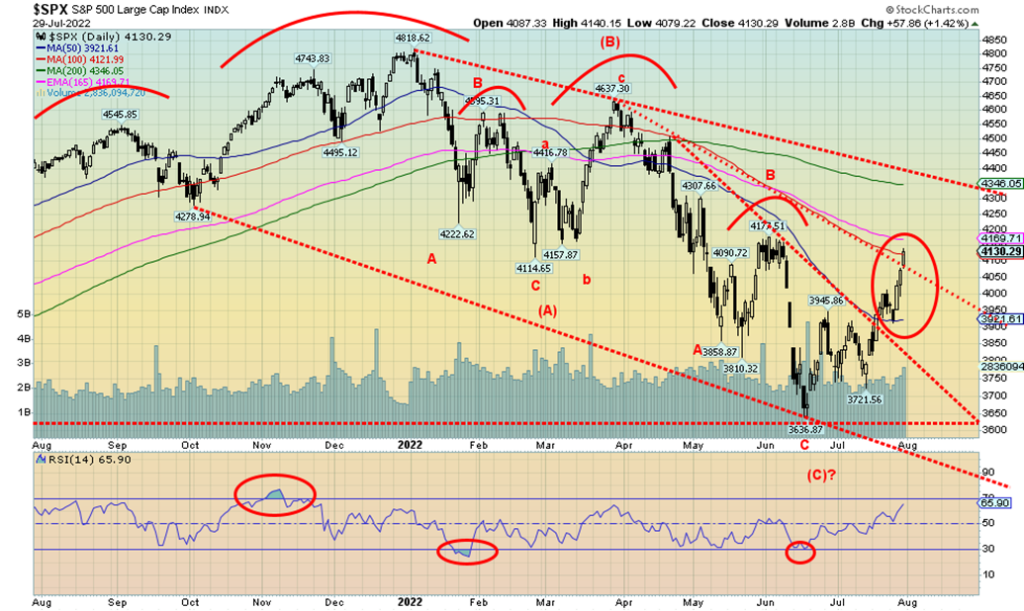
We’ve had six months of a bear market, but July did bring some relief. The S&P 500 gained 9.1%, the best gain so far in 2022 and the best since 2020. Other indices also put in stellar months. It was also a stellar week with the S&P 500 up 4.3%, the Dow Jones Industrials (DJI) up 3%, the Dow Jones Transportations (DJT) gaining 5.8%, and the NASDAQ, led by Amazon gaining 4.7%. In Canada, the TSX Composite was up 3.7% while the TSX Venture Exchange (CDNX) gained 6.3%. Small caps also advanced with the S&P 600 up 4.6%. Globally, the MSCI World Index was up 1.9%. In the EU, the London FTSE gained 2.0%, the Paris CAC 40 +3.7%, and the German DAX +1.7%. But Asia didn’t fare as well with China’s Shanghai Index (SSEC) down 0.5% and the Tokyo Nikkei Dow (TKN) off 0.4%.
The S&P 500 appears to have formed a huge descending wedge triangle. It broke above the triangle about two weeks ago and now it is breaking out above another down trendline. Potential targets as a minimum appear to be the 200-day MA, currently at 4,346 or the top downtrend line closer to 4,400. There appears to be more upside to this rally. The question is, will it be short-lived? Usually, a bear market rally sees investor confidence soar once again, believing that the bear is over and a new bull is underway. But, as we have pointed out, the recent low at 3,636 was merely the A wave down. Now comes the B wave, to be followed by a C wave to the downside. It’s the C wave down that could carry the S&P 500 and other stock markets down 50% or more from the November 2021/January 2022 highs. That’s why it will be important as to where this wave ends. It could even break that up downtrend line and head for new highs. That cannot be ruled out. But that would really get the bulls going that the bear is over. It’s not. It’s just pausing. Bear market rallies are sometimes called sucker rallies.
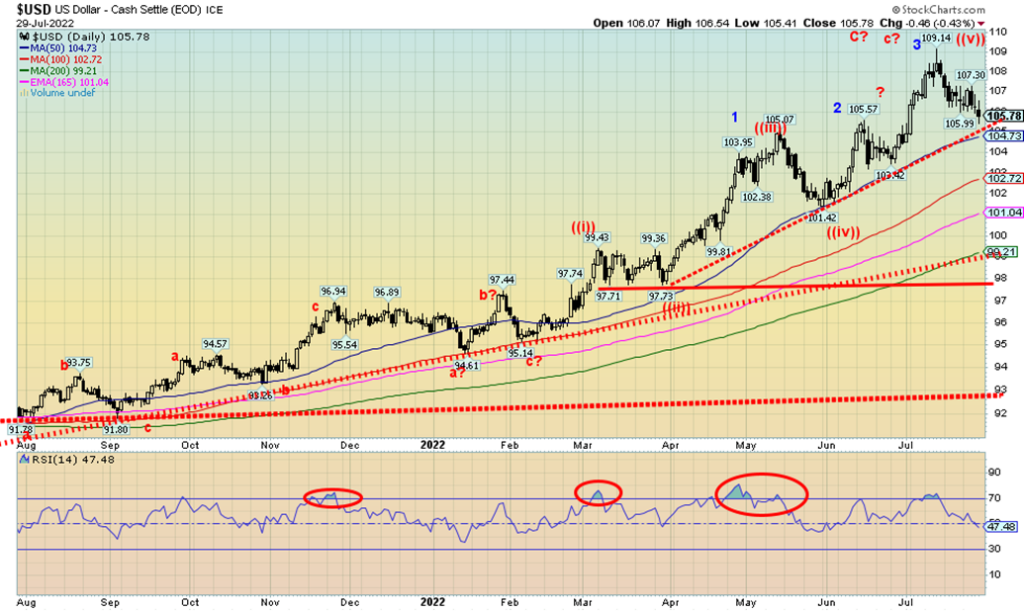
Weakening U.S. economic data has helped push the US$ Index down from its highs. However, the uptrend remains intact at least until it breaks under 104.75 which is near the 50-day MA. A lower U.S. dollar also helps gold. This past week the US$ Index fell 0.8%. That means other currencies rose against the U.S. dollar. The euro was up a paltry 0.1%, the Swiss franc up 1.1%, the pound sterling up 1.6%, and the Japanese yen gained 2.1%. The Canadian dollar was also up, helped by higher oil prices gaining 0.9%. As long as the US$ Index can hold that uptrend line, the trend remains strong to the upside. Breaking it doesn’t end the US$ Index but it suggests that a more substantial corrective period could get underway. We wouldn’t consider the US$ Index entering a bear market until we at least break under 99. Still, we appear to have completed five waves up and we have been on the rise since the lows of 2021 near 89.50. Above 107 the US$ Index is very much alive and could even head for new highs.
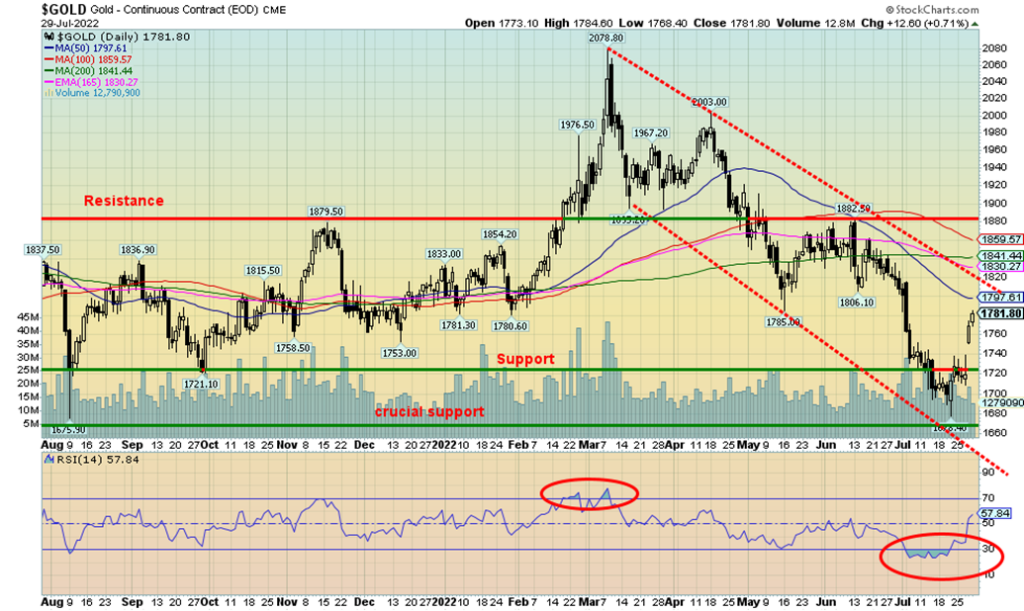
Unlike the stock market, gold had a lousy month, losing 1.4%. Silver was down 0.8%, while the gold stocks, represented by the Gold Bugs Index (HUI), lost 6.1% and the TSX Gold Index (TGD) was down 9.0%. So, this past week brought some relief with gold rebounding up 3.2%, silver having a good week, up 8.5%, and platinum gaining 2.6%. Even the near precious metals were up with palladium gaining 5.5% and copper up 6.7%. The gold stocks, however, were mixed with the HUI up 3% but the TGD losing 0.3%. Gold remains mired in a large down channel and doesn’t appear to firmly break out until it is over $1,820. But, even then, further resistance would be seen above to at least $1,880. The ability after that to establish itself above $1,900 would be crucial. One good thing is we took out first resistance at $1,740 and now that becomes support. Gold, so far at least, has held above crucial support near $1,675. With the low at $1,678 it came very close to the March 2021 low of $1,673 and the August 2021 low of $1,675. Triple bottoms are rare. We won’t rest until we start making new highs above $2,100. The next area of resistance ranges from $1,785 to $1,810. We are currently operating on buy signals, although not all trends have turned higher—yet.
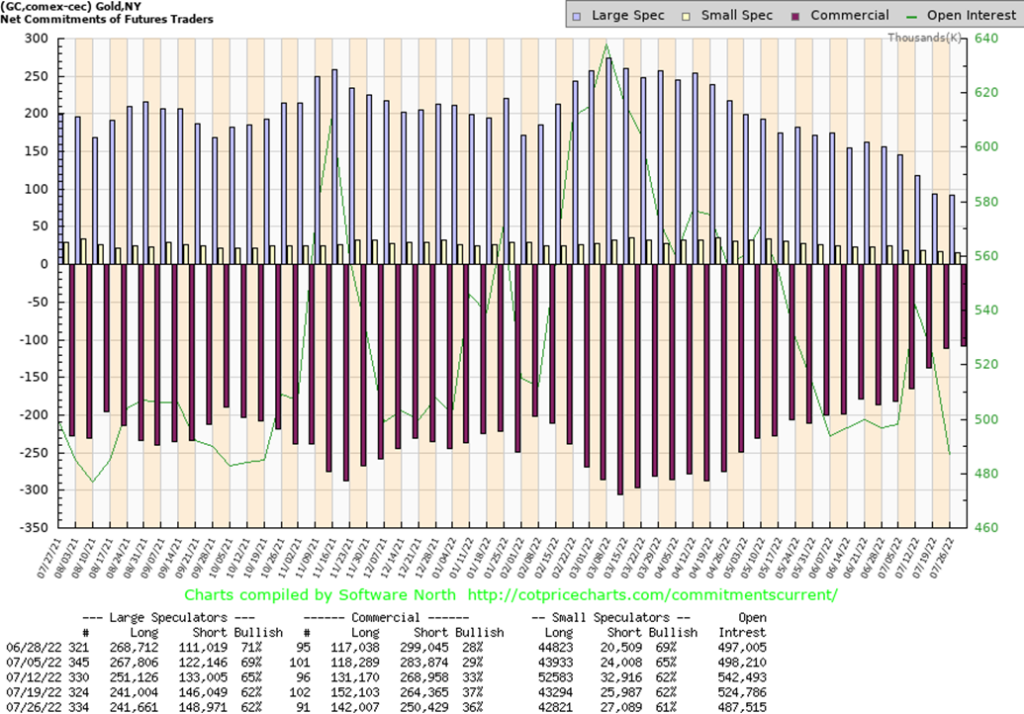
The gold commercial COT (bullion banks and companies) slipped slightly this past week to 36% from 37%. Longs lost about 10,000 contracts but shorts also fell down roughly 14,000 contracts. The large speculators COT (hedge funds, managed futures, etc.) was steady at 62%. Total open interest fell about 37,000 contracts, suggesting to us that this week’s action was all about short covering. Still, it’s the most bullish COT we’ve seen in five years.
The silver commercial COT was actually up to 49% from 47%. Long open interest rose almost 4,000 contracts while short open interest fell about 2,000 contracts. Open interest did rise over 2,000 contracts. The large speculators COT fell further to 48% from 51%. That tells us that the large speculators are still getting short. The silver COT is still suggesting that we could be on the cusp of a good rise in silver prices.
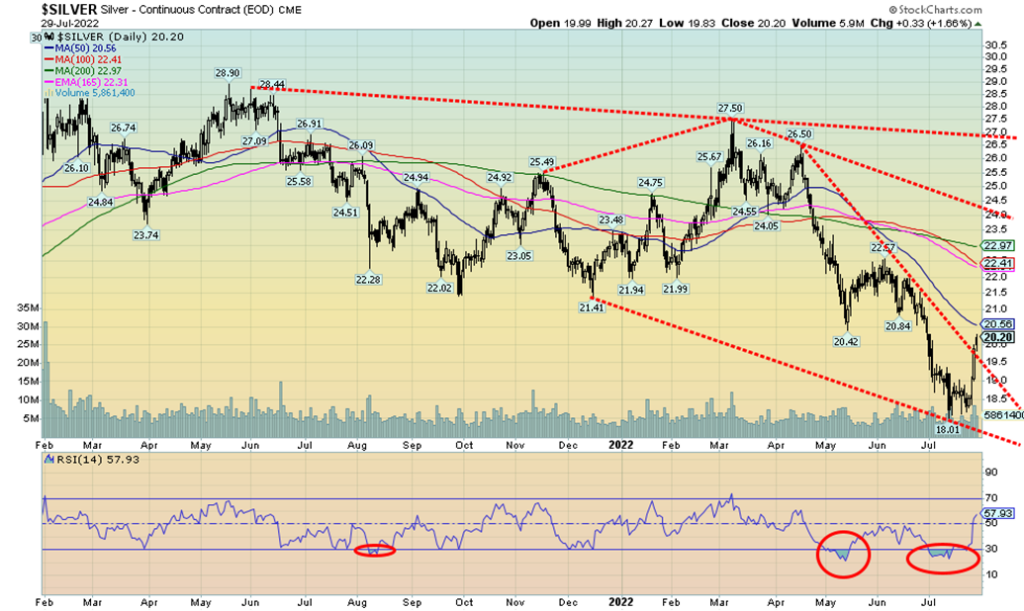
We wanted to show the silver chart (up 8.5% this past week) as silver appears to be breaking out of large descending wedge triangle. If that’s correct, then potential targets could be up to at $24.40. Over $24.50 silver could rise towards $27. Breaking the potential wedge triangle tells us that silver could embark on a decent run here. The question is, how will it go? Support is now down to $18.50, although we’d prefer it remains above $19.50 on any pullback. There is some resistance around $20.60, but above that level the next resistance could be $22 to $23.
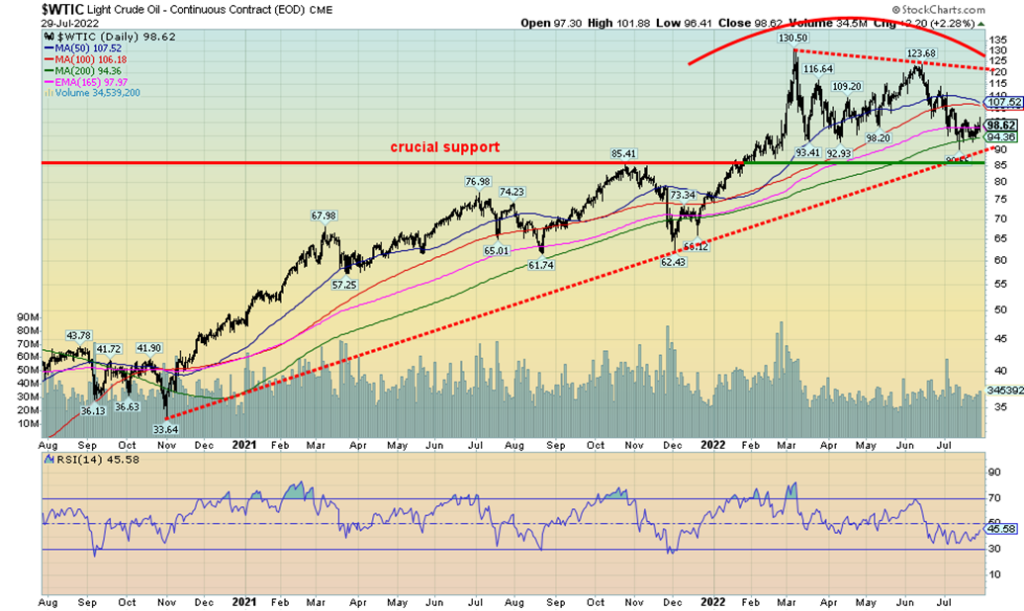
With OPEC holding the lid on hiking production and oil companies reporting bumper profits Q2, oil and the oil stocks enjoyed a solid up week. Oil gained 4.1% and natural gas (NG) was up 0.4% with the on-again off-again situation regarding rationing or cut-offs in the EU. But that was North American natural gas. EU natural gas leaped 19% to its highest levels since March 2022. WTI oil is continuing what appears to be either just a correction or we’ve actually made an important top and we could fall if we were to break down under $90. The fall could be down to around $65 but we’d have further support at $85. Only above $110 do we stand a chance of going higher. We have to regain above $121 to suggest to us that new highs lie ahead. But right now, the focus is on the downside, despite the positive week for oil and gas. The energy stocks had a banner week with the ARCA Oil & Gas Index (XOI) up 9.7% and the TSX Energy Index (TEN) up 11.3%. That has encouraged the bulls, but until we take out the points we noted, the focus should remain on a downside break.
Markets & Trends
| % Gains (Losses) Trends | ||||||||
| Close Dec 31/21 | Close Jul 29/22 | Week | YTD | Daily (Short Term) | Weekly (Intermediate) | Monthly (Long Term) | ||
| Stock Market Indices | ||||||||
| `S&P 500 | 4,766.18 | 4,130.29 | 4.3% | (13.4)% | up | down | up (weak) | |
| Dow Jones Industrials | 36,333.30 | 32,845.13 | 3.0% | (9.6)% | up | down | up (weak) | |
| Dow Jones Transports | 16,478.26 | 14,609.00 | 5.8% | (11.3)% | up | down | up (weak) | |
| NASDAQ | 15,644.97 | 12,390.69 | 4.7% | (20.8)% | up | down | neutral | |
| S&P/TSX Composite | 21,222.84 | 19,692.92 | 3.7% | (7.2)% | up (weak) | down | up (weak) | |
| S&P/TSX Venture (CDNX) | 939.18 | 646.04 | 6.3% | (31.2)% | neutral | down | down (weak) | |
| S&P 600 | 1,401.71 | 1,239.96 | 4.6% | (11.5)% | up | down | up (weak) | |
| MSCI World Index | 2,354.17 | 1,952.52 | 1.9% | (17.9)% | up (weak) | down | down (weak) | |
| NYSE Bitcoin Index | 47,907.71 | 24,158.59 | 2.6% | (49.6)% | neutral | down | neutral | |
| Gold Mining Stock Indices | ||||||||
| Gold Bugs Index (HUI) | 258.87 | 207.34 (new lows) | 3.0% | (19.9)% | down | down | down | |
| TSX Gold Index (TGD) | 292.16 | 238.53 (new lows) | 0.3% | (18.4)% | down | down | down | |
| Fixed Income Yields/Spreads | ||||||||
| U.S. 10-Year Treasury Bond yield | 1.52% | 2.66 | (3.3)% | 75.0% | ||||
| Cdn. 10-Year Bond CGB yield | 1.43% | 2.61 | (8.1)% | 82.5% | ||||
| Recession Watch Spreads | ||||||||
| U.S. 2-year 10-year Treasury spread | 0.79% | (0.23)% (new lows) | (4.6)% | (129.1)% | ||||
| Cdn 2-year 10-year CGB spread | 0.48% | (0.35)% (new lows) | (45.8)% | (172.9)% | ||||
| Currencies | ||||||||
| US$ Index | 95.59 | 105.78 | (0.8)% | 10.7% | up (weak) | up | up | |
| Canadian $ | .7905 | 0.7804 | 0.9% | (1.3)% | up (weak) | down | neutral | |
| Euro | 113.74 | 102.25 | 0.1% | (10.1)% | down | down | down | |
| Swiss Franc | 109.77 | 105.11 | 1.1% | (4.3)% | up | down (weak) | down (weak) | |
| British Pound | 135.45 | 121.83 | 1.6% | (10.1)% | neutral | down | down | |
| Japanese Yen | 86.85 | 75.04 | 2.1% | (13.6)% | up | down | down | |
| Precious Metals | ||||||||
| Gold | 1,828.60 | 1,781.80 | 3.2% | (2.6)% | neutral | down | neutral | |
| Silver | 23.35 | 20.20 | 8.5% | (13.5)% | neutral | down | down | |
| Platinum | 966.20 | 889.80 | 2.6% | (7.9)% | neutral | down | down | |
| Base Metals | ||||||||
| Palladium | 1,912.10 | 2,129.70 | 5.5% | 11.4% | up | neutral | neutral | |
| Copper | 4.46 | 3.57 | 6.7% | (20.0)% | down (weak) | down | neutral | |
| Energy | ||||||||
| WTI Oil | 75.21 | 98.62 | 4.1% | 31.3% | down | neutral | up | |
| Nat Gas | 3.73 | 8.23 | 0.4% | 120.6% | up | up | up | |
New highs/lows refer to new 52-week highs/lows and, in some cases, all-time highs.
Copyright David Chapman, 2022
__
(Featured image by geralt via Pixabay)
DISCLAIMER: This article was written by a third party contributor and does not reflect the opinion of Born2Invest, its management, staff or its associates. Please review our disclaimer for more information.
This article may include forward-looking statements. These forward-looking statements generally are identified by the words “believe,” “project,” “estimate,” “become,” “plan,” “will,” and similar expressions. These forward-looking statements involve known and unknown risks as well as uncertainties, including those discussed in the following cautionary statements and elsewhere in this article and on this site. Although the Company may believe that its expectations are based on reasonable assumptions, the actual results that the Company may achieve may differ materially from any forward-looking statements, which reflect the opinions of the management of the Company only as of the date hereof. Additionally, please make sure to read these important disclosures
David Chapman is not a registered advisory service and is not an exempt market dealer (EMD) nor a licensed financial advisor. He does not and cannot give individualised market advice. David Chapman has worked in the financial industry for over 40 years including large financial corporations, banks, and investment dealers. The information in this newsletter is intended only for informational and educational purposes. It should not be construed as an offer, a solicitation of an offer or sale of any security. Every effort is made to provide accurate and complete information. However, we cannot guarantee that there will be no errors. We make no claims, promises or guarantees about the accuracy, completeness, or adequacy of the contents of this commentary and expressly disclaim liability for errors and omissions in the contents of this commentary. David Chapman will always use his best efforts to ensure the accuracy and timeliness of all information. The reader assumes all risk when trading in securities and David Chapman advises consulting a licensed professional financial advisor or portfolio manager such as Enriched Investing Incorporated before proceeding with any trade or idea presented in this newsletter. David Chapman may own shares in companies mentioned in this newsletter. Before making an investment, prospective investors should review each security’s offering documents which summarize the objectives, fees, expenses and associated risks. David Chapman shares his ideas and opinions for informational and educational purposes only and expects the reader to perform due diligence before considering a position in any security. That includes consulting with your own licensed professional financial advisor such as Enriched Investing Incorporated. Performance is not guaranteed, values change frequently, and past performance may not be repeated.


Blockchain Evolves Toward AI, Finance and Quantum Security
Blockchain is evolving beyond crypto into finance, AI applications, and digital markets, while security and regulation remain challenges. Quantum threats...


The Italian Crowdinvesting Market Faces Sharp Decline in 2026
Italian crowdinvesting market continued to decline in 2026, with fundraising falling 36.8% year-on-year to €164.19 million. Platforms and active campaigns...


Sartorius Stedim Biotech Maintains Growth Momentum in H1 2026
Sartorius Stedim Biotech reported solid H1 2026 results, with revenue reaching €1.527 billion and EBITDA rising to €479 million. Growth...


Bank of Africa Launches BOA MDM Network to Boost Diaspora Investment in Morocco
Bank of Africa launched the BOA MDM Network to channel diaspora remittances into productive investment, aiming to raise their share...


Switzerland’s Medical Cannabis Reform Advances Access, But Barriers Remain
Switzerland’s 2022 medical cannabis reform improved patient access by removing federal approval requirements, but challenges remain. MEDCAN highlights barriers including...
 |
|
 |  |
 |
|
-

 Markets2 weeks ago
Dow Jones Pauses Near Record Highs as Precious Metals Lead
-

 Impact Investing1 day ago
Swisscanto Launches Catastrophe Bond Fund for Portfolio Diversification
-

 Fintech1 week ago
Advanced Blockchain Under Pressure Amid Crypto Market Shifts
-

 Fintech4 days ago
FinTech Matures as AI and Infrastructure Drive the Next Growth Phase