Featured
Stock Markets and Gold Rallied This Past Week
Stock markets rallied this week as did gold although none of them took out key points to suggest that we have a lot higher to go. Gold in particular looks very good here with the best commercial COT we’ve seen since 2017/2018 just before another big rally for gold, silver and the gold stocks. Oil wavered but natural gas (NG) continued to rise both here in North America and in the EU/eurozone.

Europe is in a mess of trouble. Inflation is soaring. The EU’s inflation rate hit 9.6% in June. The eurozone inflation rate (the eurozone is those countries that use the euro) is 8.6%. The EU’s inflation is actually the highest in the G7, although officially the EU is not a member of the G7. The leader in the G7 is the United Kingdom at 9.4%. Japan has a benign 2.5% inflation rate. The European Central Bank (ECB), the EU’s equivalent of the Fed, is only now finally starting to increase interest rates. But it’s most likely too little too late. What’s worse, many EU rates have been negative so raising them even to 0.5% could prove to be a shock to the financial system.
EU and U.S. Inflation Rate 1997–2022
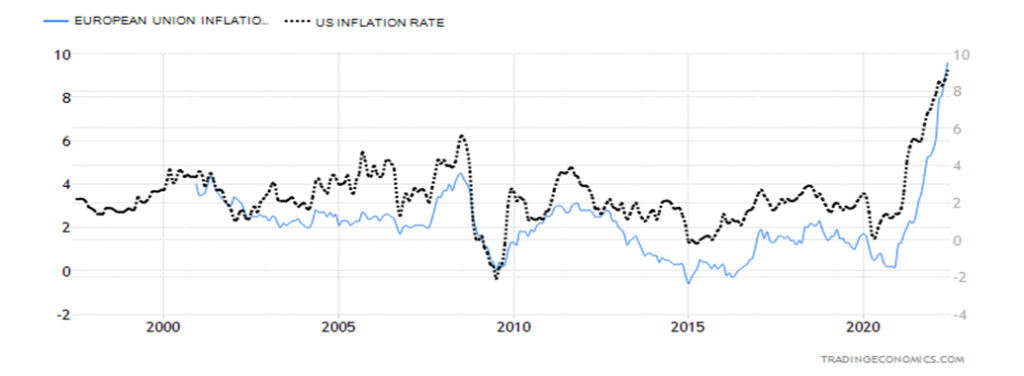
The EU has been hit hard by the economic fallout from Russia’s invasion of Ukraine. It’s become almost like a war of attrition—whoever is willing to suffer the most in order to support the sanctions against Russia. There is wavering, as Germany has noted that if they don’t get those turbines they need from Canada, they could cut off all aid to Ukraine. Others are raising questions as well.
The U.S. initiated the sanctions but the EU suffers the most because of their high dependency on Russian oil and gas, particularly gas. In 2021, Russia supplied 40% of the EU’s natural gas and 25% of its oil. None of it is easy to replace. Instability has been rising in the EU. Italian PM Mario Draghi tried to resign and was blocked, but is now resigning again. Italy is the most indebted country in the EU with a national debt to GDP ratio last at 150.8%, the highest in the EU except for Greece. The fear is that the eurozone’s third largest economy could plunge into political instability at the wrong time, triggering a possible sovereign debt crisis. There has been talk of Italy leaving the euro. There have also been rumblings of key departures at the ECB. All of that could create even more instability.
EU Natural Gas Dutch Hub 2021–2022
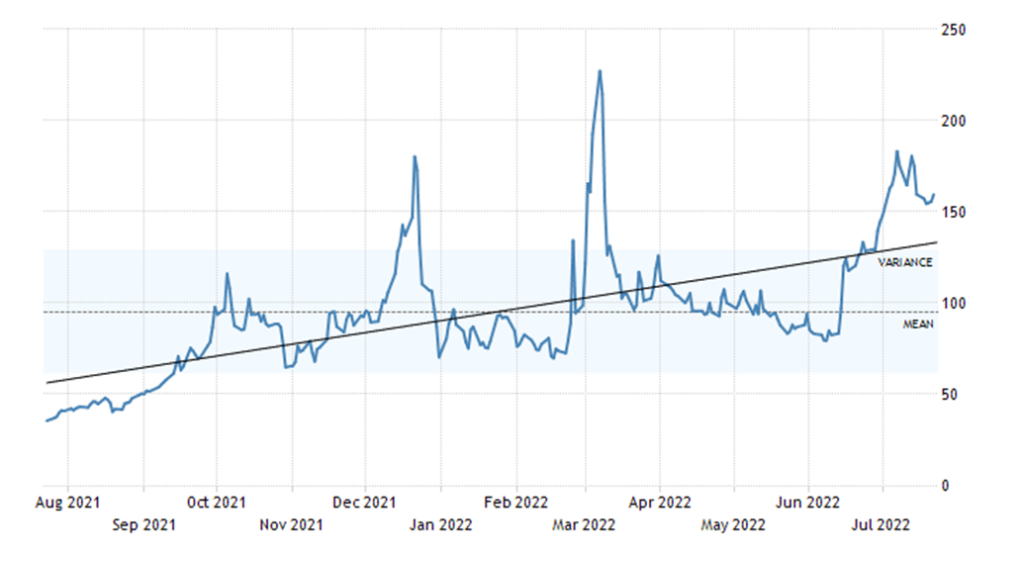
Natural gas (NG) prices at the Dutch Hub have jumped 120% since the beginning of the year. That compares to the 100% price increase seen for North American NG. The reality is Russia, followed by Iran, are the world’s second and third largest producers of NG. The U.S. is the largest and Canada is fourth largest. However, the U.S. and Canada are over here while the EU is over there, and facilities and ability to ship North American NG to the EU are severely limited due to a lack of LNG facilities. Canada and the U.S. do export NG, but it ranges between 23% and 31% of total production. Much of the U.S. exports go to Mexico and Canada while Canada exports its gas entirely to the U.S. Russia and Iran also have the world’s largest reserves of natural gas, far surpassing number three and four: Qatar and the U.S. Russia and Iran hold 41% of all the global reserves of NG. All of this has helped produce an EU energy crisis.
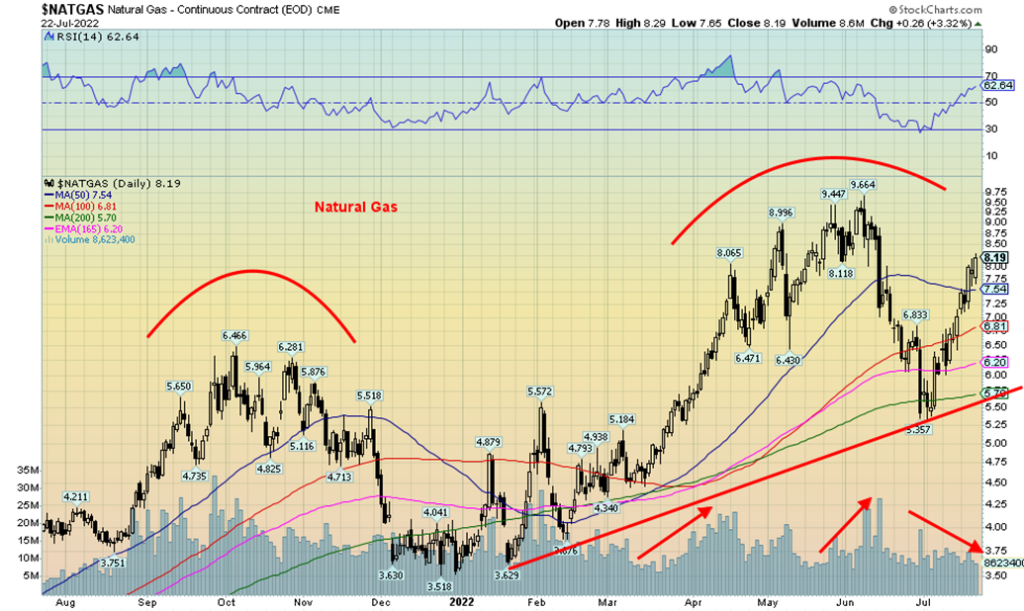
Rising natural gas prices are also hitting here as well, as the chart below attests. This past week NG jumped $1.60 or 24.2%. However, as this chart shows, NG is still shy of its recent high. Note the EU Dutch Hub NG is also below its recent high. What stands out here is that volume rose into the highs in April/May, then rose more into the sell-off in June. Volume on this rebound has been considerably weaker, suggesting that this may be a rebound rally only and another downswing could follow. Support is all the way down to $5.75.
The United Kingdom also has a major inflation problem, currently at 9.4%. The pound sterling has fallen sharply in 2022, pushing the prices of imports for the U.K. sharply higher. The U.K., at one time a net exporter, is now a net importer. The pound has fallen some 11% in 2022 against the U.S. dollar, currently around $1.20. What’s worse is the country is going through political instability after the forced resignation of former PM Boris Johnson, and the hangover from Brexit has complicated supply chains and numerous trade agreements.
All of this is having a destabilizing impact on what is really the world’s third largest economy (the eurozone area). The eurozone is 15% of the global economy, behind the U.S. (22%) and China (18%). Key countries are Germany (4th), France (7th), and Italy (8th) in terms of GDP. The U.K., not a part of the EU or the eurozone, is 5th. If the eurozone and the U.K. fall into a recession, the entire globe could suffer. Add in a sharply slowing Chinese economy and the world has the makings of a potential global recession. Some economists believe we are already in a recession.
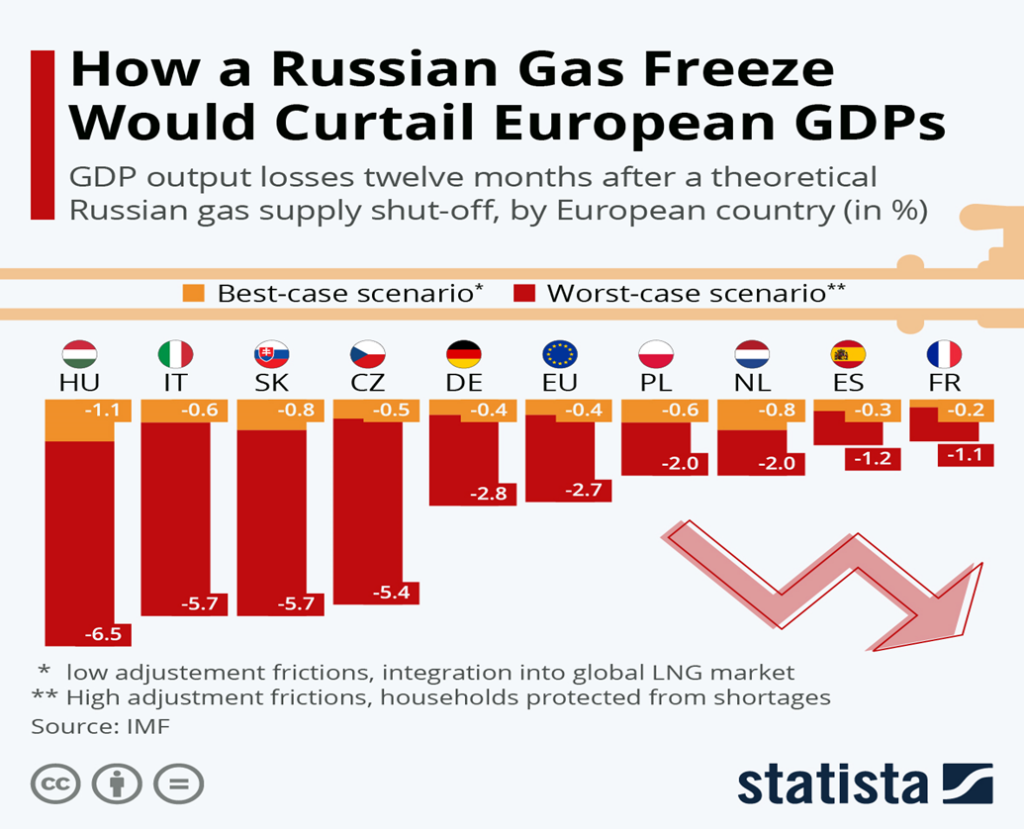
A Russian gas freeze on the EU could drop the EU’s GDP by anywhere from 0.2% to 1.1% in a best-case scenario. In a worst-case scenario, the drop could be 1.1% to 6.5%. We show an interesting chart compiled by Statista (www.statista.com), based on data from the IMF (www.imf.org) on how a Russian gas freeze could negatively impact EU GDP. If the EU were to fall into recession it would negatively impact the rest of the world because of global interconnectedness.
There is considerable confusion surrounding Russian gas. Russia has apparently authorized resumed Nord Stream gas flows. But it’s at reduced levels. Calls are on for the EU to cut back usage by 15% to help preserve supplies. That number will be difficult for many. Countries severely at risk include Hungary, Czech Republic, Poland, Denmark. Bulgaria, Slovakia, and even Italy. Whether Russia cuts back or not almost seems moot given the EU is suggesting to cut usage by 15%. There is no sign the war is going to end any time soon. Meanwhile, to put pressure on Russia, the blowback that has been ongoing could be intensifying and the EU/eurozone are the most at risk.
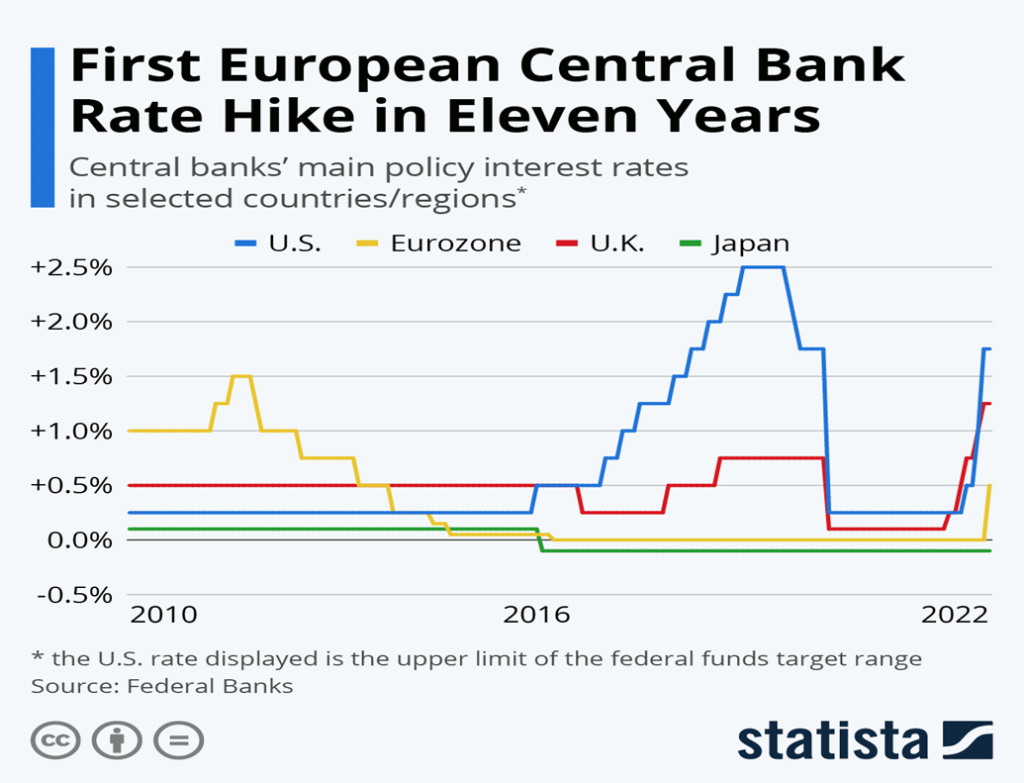
The European Central Bank (ECB) finally raised interest rates and it was a bit of a shocker. Rather than the expected 25 bp hike the rise was 50 bp. It is the first ECB hike in 11 years. It still leaves the ECB behind the Fed and the Bank of England (BOE), but now leaves Japan as the only G7 member that has not hiked rates. Our chart further below compares the rate hikes of the U.S., the EU, the U.K., and Japan. The rates are benchmarked against the Fed’s goal of raising rates to 2.5%. Given the rate of inflation in every country, this still leaves interest rates sharply negative and therefore accommodative. Still a jump from zero or, in the ECB’s case, from negative rates is a big jump and a potential shock for many.
And then there is the heat. Killer heat waves plodding through the EU and the U.K. However, North America is not immune and heat waves are sweeping through the U.S., particularly in the west and parts of the east as well. Heat waves with temperatures consistently over 100° F or above 38° C. Records have fallen with at least a recorded high of 117° F. The heat wave is accompanied by bone-dry drought conditions and dozens of wild fires in Spain, Portugal, France, Greece, Italy, Turkey, and the United Kingdom. Hundreds have died from the heat wave, possibly thousands. Thousands have been forced to flee the wild fires, putting unknown numbers at risk of having no home to return to. Besides destroying forests, croplands including wheat and wine have been destroyed. Drought is adding to the woes with rivers so low there are calls for cuts to hydro electricity. Some have called it an apocalypse, a scorched earth.
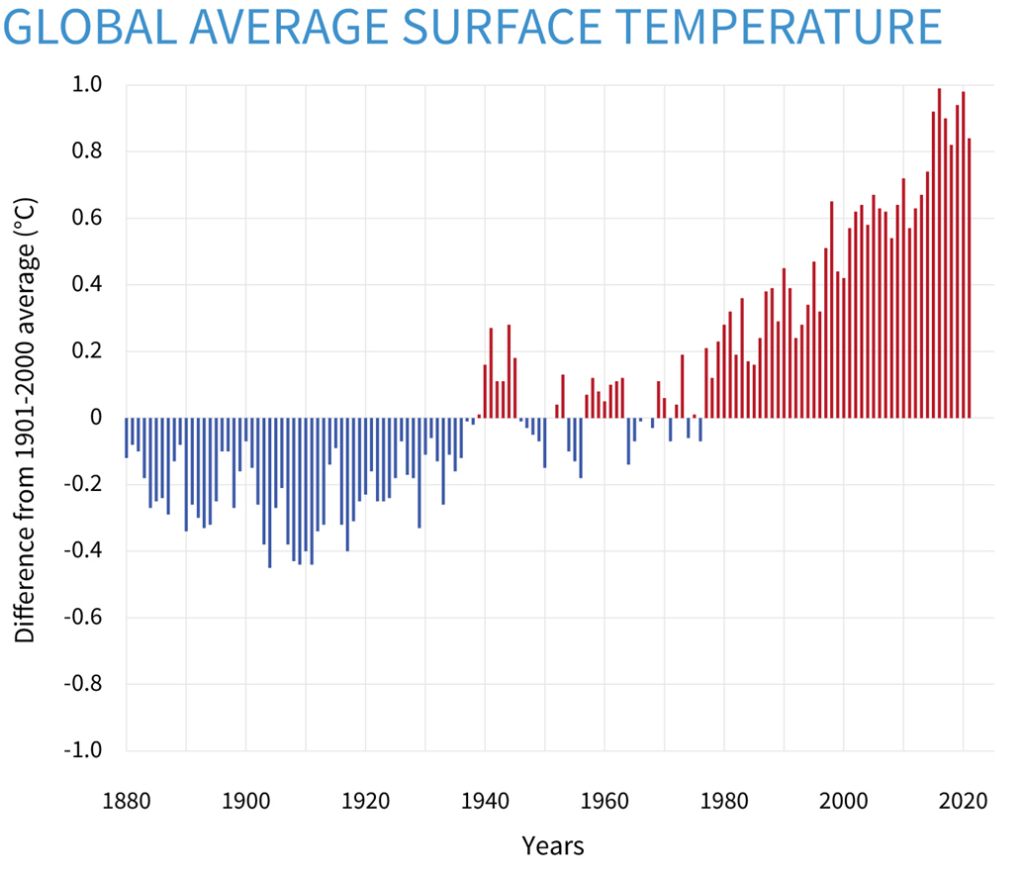
What the cost of this natural disaster will be is unknown. Estimates are already in the billions of euros. As if the war wasn’t putting enough pressure on the EU and the UK, this just adds to the woes. The reality, however, is
that global temperatures have been rising steadily since 1980. Earth’s temperature has been rising 0.14° Fahrenheit (0.08° Celsius) per decade since 1880, but the rate of warming since 1981 is more than twice that: 0.32° F (0.18° C) per decade. 2021 was the sixth-warmest year on record, based on NOAA’s temperature data. The nine years from 2013 through 2021 rank among the 10 warmest years on record.
The claim is all of this is due to climate change. And, no doubt, we are going through a severe period of climate change. Climate change is cyclical, but what has man contributed through the burning of fossil fuels? Previous periods of sharp climatic change resulted in the collapse of civilizations. Eight civilizations that collapsed as result of severe climatic change include the following:
- the Pueblo civilization of the Americas, centered in Colorado, that largely existed between 300 BC and 1250 AD,
- the Angkor civilization of the Khmer Empire in Cambodia from 1100–1400,
- the Norse civilization in northern Europe and Greenland. It rose during the Medieval warming period from 800–1200 but was largely gone by 1300 as the warming period turned into a mini-ice-age,
- the Rapa Nui civilization of Easter Island and parts of Chile from 400–700,
- the Mayan civilization that existed in southern Mexico, the Yucatan, and into Central America, starting from 2600 BC. It was largely brought to heal by long periods of drought during 800–1000,
- the Indus civilization that emerged in 3000 BC in what is now Pakistan. It experienced huge climate stress from monsoons and population was declining past 2000 BC,
- the Cahokia civilization of what is now Illinois and south that started around 700; droughts contributed to it disintegration and it collapsed by 1350,
- the Tiwanaku civilization of South America by the Andes that rose and fell between 500 and 1000 as the climate deteriorated, sparking widespread crop failures and causing the society to collapse.
But what of today? In a world with a population of 7.8 billion and rising? The global population today far surpasses any previous period of climate change. Those fleeing the worst effects of climate change will literally have nowhere to go. That alone could raise tensions between the wealthy countries of North America and Europe with the poorer countries of the Middle East, Asia, Africa, and Latin America. It will be impossible to accommodate all those fleeing what could be severe climate change, especially droughts that lead to potential famines where millions would be at risk.
Add it all up: war, sanctions, climate change, political instability, humongous debt, currency wars, and it would be surprising that the world has not already fallen into recession. But could it turn into the Greater Depression as some are now calling for?
This coming week has a few numbers to watch.
- July 26, 2022 – Conference Board Consumer Confidence, expected 97.5 vs. 98.7,
- July 27, 2022 – Fed interest rate decision, expected hike of 75 bp,
- July 28, 2022 – U.S. Q2 GDP advance, expected gain of 0.6% vs. 1.6% decline for Q1; that’s a sharp contrast to the Atlanta Fed prediction of negative 2.1%,
- July 29, 2022 – Canada’s May GDP, expected negative 0.2%, and, year over year June 0%,
- July 29, 2022 – Michigan Consumer Sentiment July final, expected to be 51.1 vs. last 50.
We follow with a review of the S&P 500, Gold, and Oil. As well we include an important recession watch chart as the yield curve turns negative.
Stocks rallied! Stocks rallied! After a sea of red the previous week, the stock market put in a good up week. The S&P 500 gained 2.6%, the Dow Jones Industrials (DJI) was up 2.0%, the Dow Jones Transportations (DJT) gained 4.5%, while the NASDAQ jumped 3.3% as a number of FAANG stocks put in a good week, recovering from the recent decline. Small caps also improved with the S&P 600 up 4.2%. In Canada, the TSX Composite was up 3.2% and the TSX Venture Exchange (CDNX) gained 4.0%. Overseas in the EU, the London FTSE was up 1.6%, the Paris CAC 40 was up +3.0%, and the German DAX was up +3.0% as well. In Asia, China’s Shanghai Index (SSEC) gained 1.3% while the Tokyo Nikkei Dow (TKN) was up 4.2%. Bitcoin joined the party, gaining 12.4%.
The rally was a welcome relief for what has been a relentless bear market so far in 2022. Sentiment was also very low. Helping was falling bond yields. There is now concern that the U.S. will fall into a recession. And that may be helping the stock market as they speculate as to whether the Fed might ease up on their interest rate hikes. The Fed meets this week and it is widely expected they will hike rates 75 bp (some still think 100 bp) to combat inflation. What’s key may be what they say afterward. Watch for signs of concern about a recession.
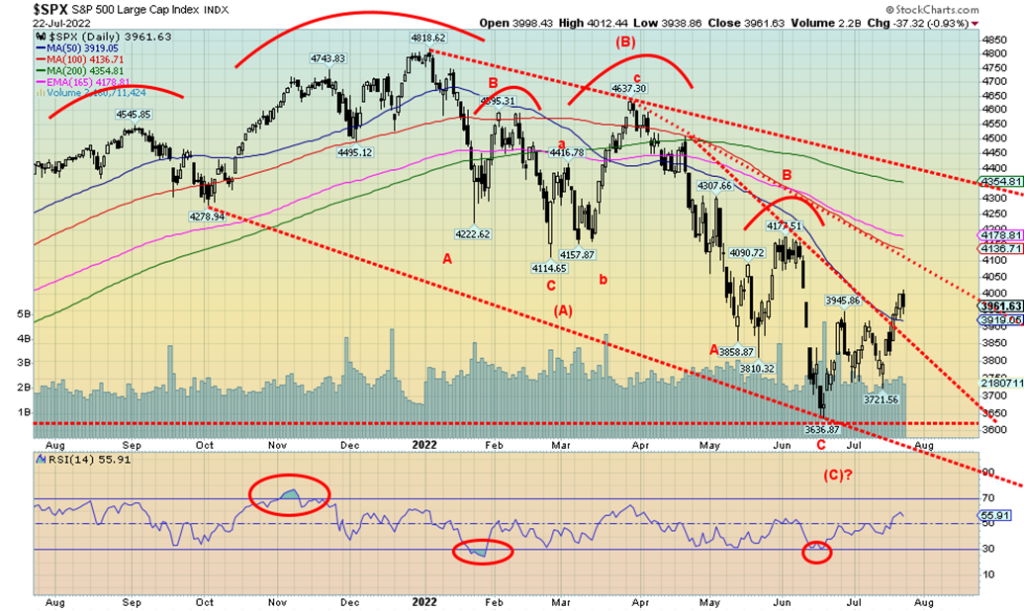
The chart above of the S&P 500 suggests to us that we fell in ABC-type pattern with a series of ABCs to form the larger ABC. If that is correct, then this is not the start of an impulse wave to the downside. It could still be a corrective and if we recover above 4,500 the odds favour new highs. There is also a key line at around 4,300 that the S&P 500 must take out as well. For the DJI, only above 34,000 could the DJI see higher prices.
The S&P 500 took one hurdle this past week at around 3,850. Next up is to regain above 4,050. Above that level we could then challenge 4,300. What could change this bullish scenario? A move back under 3,900 would be negative and a move back under 3,700 could be fatal and instead we’ll see new lows. That cannot be ruled out. This week’s Fed might help clarify things as to which direction we’ll go—up or down.
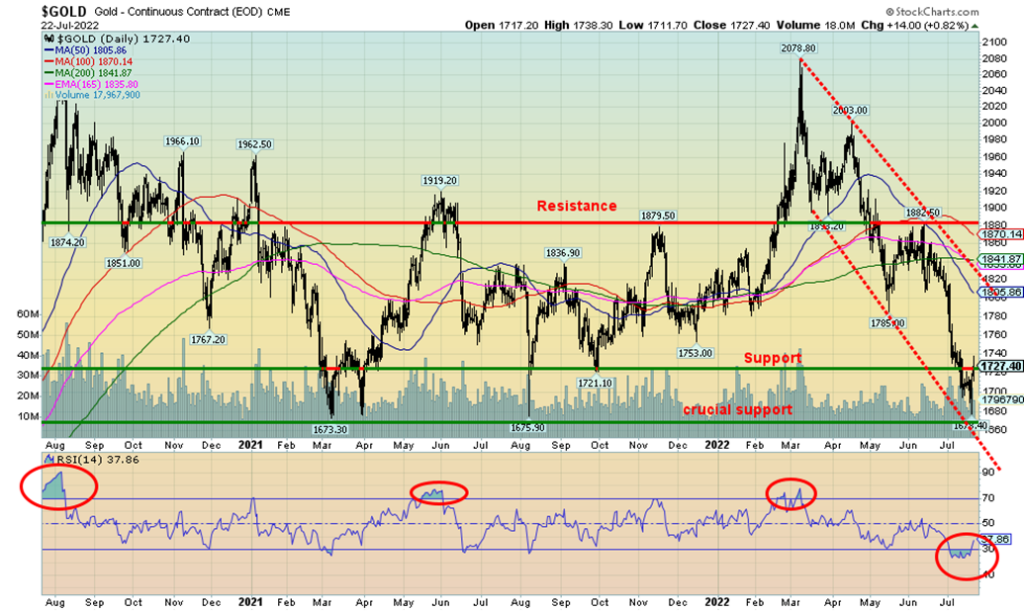
After falling for five consecutive weeks, gold finally turned around and had a weekly gain. Helping it were falling bond and note yields and a falling US$ Index from its recent highs. There are also growing signs that we could soon be in a recession which raises the specter of stagflation, something that is good for gold. So, have we made a bottom? Sentiment has been almost rock bottom. Gold teased with the $1,675 breakdown zone but didn’t break—this time, at least. But we clearly have work to do. First, we need to regain above $1,740. Above that level we should then make a run for $1,800. There is pretty good resistance from $1,800 up to around $1,875. But if we can get above $1,900 and hold it, we could definitely go higher. But, as we note, we are concerned this is probably only a rebound rally as we are looking for larger cycle lows that may not be fulfilled until 2023 or even into 2024. This Wednesday we get the Fed’s interest rate decision, widely expected to be 75 bp. But more important might be the language. Is the Fed recognizing that we could be moving into a recession?
This past week gold gained 1.3%, silver was up 2.1%, but the gold stocks refused to follow—the Gold Bugs Index (HUI) fell 1.1% and the TSX Gold Index (TGD) was hit even harder, making fresh 52-week lows, losing 3.1%. Still, we couldn’t help but notice that some gold stocks were outperforming and were actually up on the week.
Given we are coming off deep oversold conditions and sentiment is very bearish while the commercial COT is positive, we continue to look for a rally. But regaining above $1,740 is the first order; then we’ll see from there.
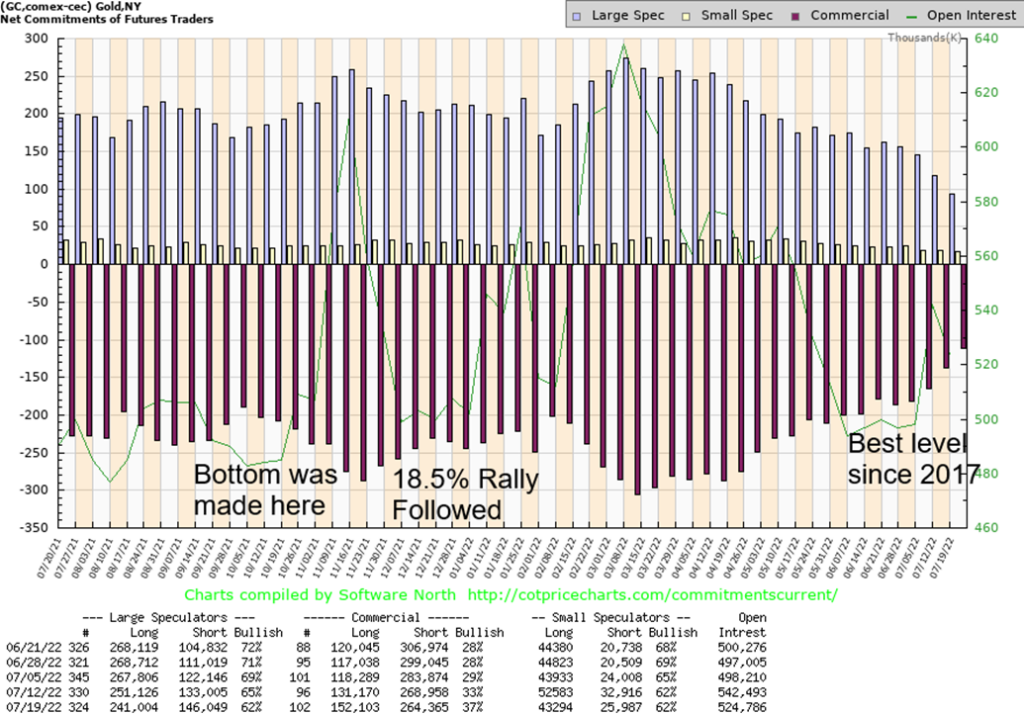
This is the best gold commercial COT (bullion companies and banks) we have seen since 2017 before gold made a low then took off in 2018 with a gain of 79% from a low in 2018. Silver and the gold stocks followed. During that run-up there was one serious correction in March 2020—the pandemic panic. This past week the gold commercial COT rose to 37% from 33% the previous week. Long open interest jumped about 21,000 contracts while short open interest fell over 4,000 contracts. The large speculators (hedge funds, managed futures, etc.) saw their holdings fall to 62% from 65% as they shed over 10,000 longs while adding roughly 13,000 shorts. We are seeing the same thing with the commercial silver COT as it jumped to 47% from 46% while the large speculators fell to 51% from 52%. Again, as with gold, this is the best commercial COT we’ve seen in years. Both appear to be presaging a significant rally. However, what it doesn’t tell us is: will the rally start from current levels or even lower levels?
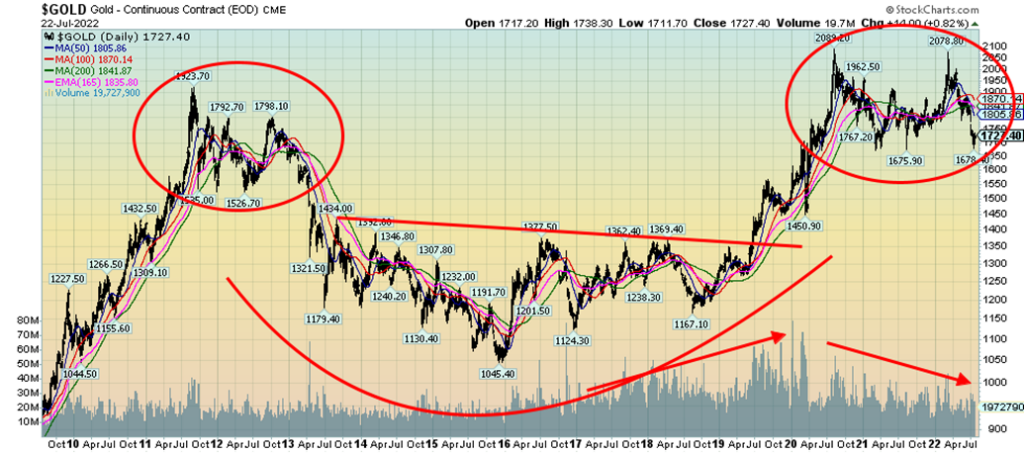
If there was any doubt as to why we remained concerned about the price of gold going forward, it is this chart. Note the similarities between the period 2011 to 2012 and the current one from 2020 to the present. The earlier pattern resulted in the infamous collapse for gold in April 2013. The market didn’t make its final bottom until December 2015, down about 46% from the September 2011 top. Silver and the gold stocks were hit considerably harder. This time we are working on what might be a double top for gold at $2,089 in August 2020 and again at $2,079 in March 2022. The neckline continues to hover around $1,675. A breakdown on heavy volume could, in theory, project down to around $1,260 and at least down to $1,500. Triple bottoms are rare so we can’t put too much faith in the fact gold made a low at $1,673 in March 2021, at $1,675 in August 2021 and this past week at $1,678.
The December 2015 low, as we have often noted, was a 7.83-year cycle low. We are now into the period for the next 7.83-year cycle low. This has told us that the current cycle has most likely topped. We are also working on the 23–25-year cycle that last bottomed with a double bottom in 1999 and 2001 near $250. We are now into that potential cycle low period as well. Ideally, we won’t see the final low under sometime into 2023 or even 2024. The only way we’ll know the low could be in is to be making new highs above $2,089. This is why this coming rally is important. Either we make new highs, or we don’t. And if we don’t, we could be in for a nasty drop. This past week we teased with the $1,675 low and, so far, it has held. But, as we noted, we are not out of the woods yet. The danger is still there.
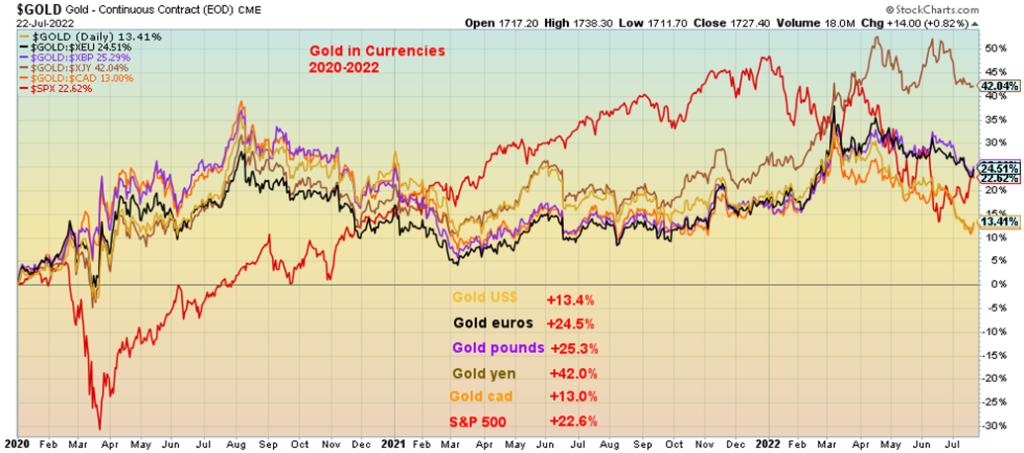
As we know, the US$ Index has recently been making a series of new 52-week highs. The result is the currencies have in many cases been seeing new lows. Many consider gold to be a currency. So its performance in other currencies is watched as carefully as everyone watches the gold price in U.S. dollars. Our chart shows the return since 2020. Leading the way has been gold in Japanese yen, up a sharp 42.0%. Gold in U.S. dollars is up only 13.4%. But all of the currencies have outperformed. In euros, gold is up 24.5%, in pound sterling gold is up 25.3%, and, in Canadian dollars gold is up 13.0%. Yes, overall, the Canadian dollar has held its own with the U.S. dollar, largely thanks to high oil prices. During this time the S&P 500 gained 22.6% despite the recent downturn.
Gold is currency, gold is money, and a reminder it has been that way for millenniums. It is strong hedge against currency debasement.
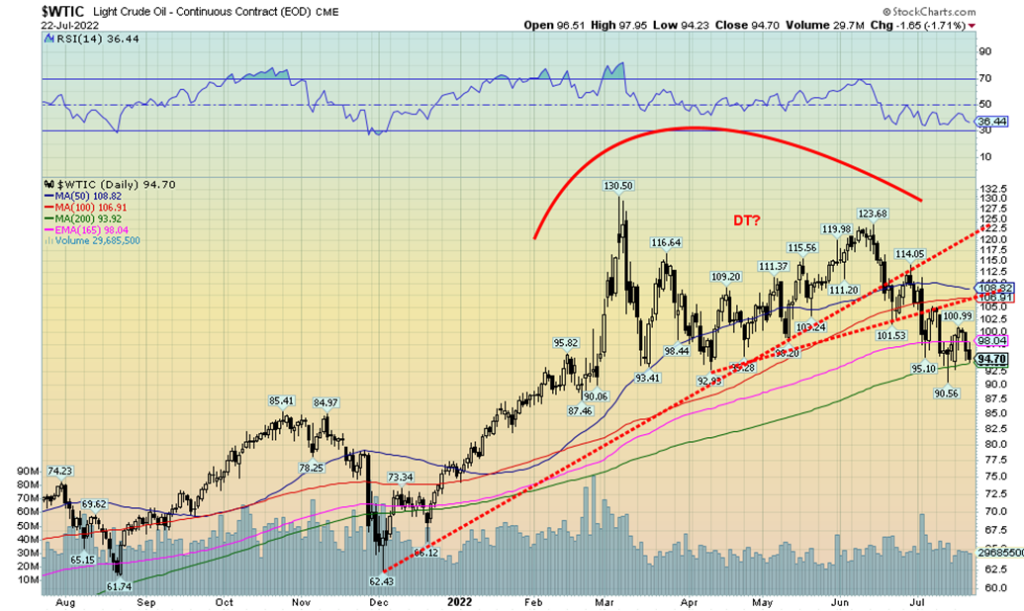
Oil prices appear to have found some support at the 200-day MA. The question is, is this a pause before a breakdown or a pause before another lift-off? With some signs of recession in the air, the downside would appear to be the way to go. The ECB hiked rates this week and the war continues with on-again off-again battles over what is going to happen with natural gas. Libya brought some oil back on stream. All of this might help the downside argument. Technically, oil made what appears to be a double top. The breakdown, in theory, could carry down to $65. But volume has remained subdued. Regaining back above $109 would be positive for oil going forward; however, the reality is that only a move above the June high at $123.68 could suggest that new highs above $130.50 are possible.
Oil was down 1.1% this past week. Surging natural gas (NG) prices (covered earlier) saw NG rise 24.2%. The energy indices did well with the ARCA Oil & Gas Index (XOI) up 3.6% and the TSX Energy Index (TEN) up 3.9%.
Chart of the Week
Recession Watch Spreads
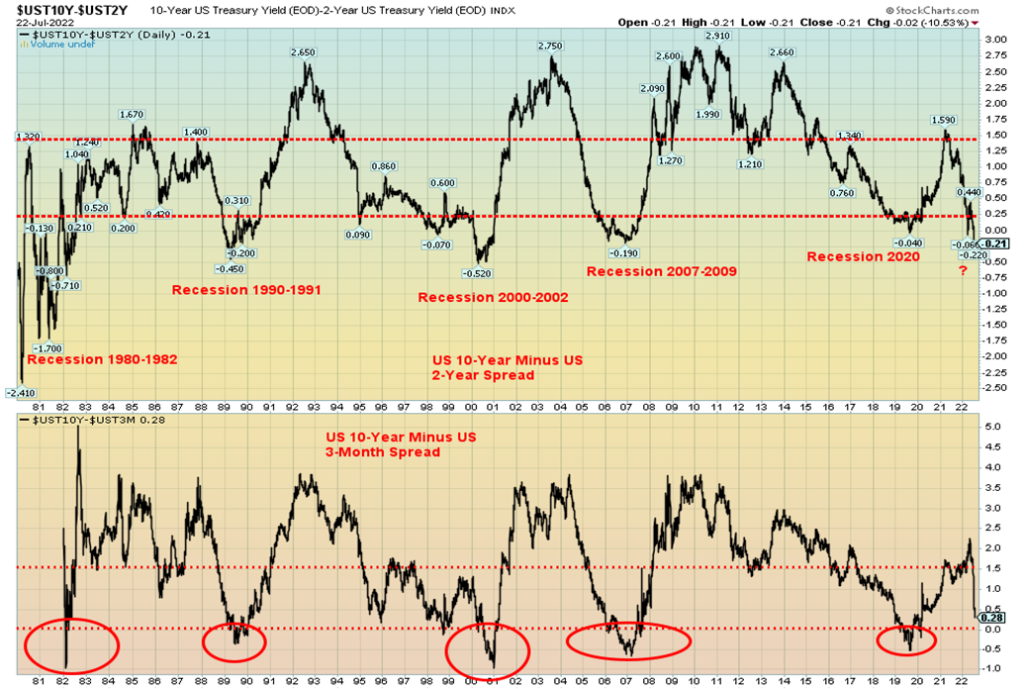
If there was any doubt that we could be headed for a recession, the now firmly in negative territory 2-year treasury note/10-year treasury note spread has accurately forecasted every recession since 1980. What hasn’t yet turned negative is the 3-month treasury bill/10-year treasury note spread. That also turns negative before a recession, but today is only at a positive spread of 28 bp. Closer is the 3-month treasury bill/30-year treasury bond spread which has fallen to 2 bp. No, not quite negative yet but close. That spread turning negative has forecast every recession since 1980, 100% accuracy. The lag time is usually about four to six months, so it may be year end before they announce we are officially in a recession. But one is coming. The question is, will it be a soft landing or a hard landing? We suspect the latter.
Copyright David Chapman, 2022
Markets & Trends
| % Gains (Losses) Trends | ||||||||
| Close Dec 31/21 | Close Jul 22/22 | Week | YTD | Daily (Short Term) | Weekly (Intermediate) | Monthly (Long Term) | ||
| Stock Market Indices | ||||||||
| `S&P 500 | 4,766.18 | 3,961.63 | 2.6% | (16.9)% | up (weak) | down | neutral | |
| Dow Jones Industrials | 36,333.30 | 31,899.29 | 2.0% | (12.2)% | up (weak) | down | neutral | |
| Dow Jones Transports | 16,478.26 | 13,811.15 | 4.5% | (16.2)% | up (weak) | down | neutral | |
| NASDAQ | 15,644.97 | 11,834.11 | 3.3% | (24.4)% | up | down | neutral | |
| S&P/TSX Composite | 21,222.84 | 18,982.92 | 3.2% | (10.6)% | down (weak) | down | neutral | |
| S&P/TSX Venture (CDNX) | 939.18 | 607.97 | 4.0% | (35.3)% | down | down | down | |
| S&P 600 | 1,401.71 | 1,185.22 | 4.2% | (15.4)% | up (weak) | down | neutral | |
| MSCI World Index | 2,354.17 | 1,916.91 | 5.5% | (18.6)% | neutral | down | down | |
| NYSE Bitcoin Index | 47,907.71 | 23,548.21 | 12.4% | (50.8)% | neutral | down | neutral | |
| Gold Mining Stock Indices | ||||||||
| Gold Bugs Index (HUI) | 258.87 | 201.23 | (1.1)% | (22.3)% | down | down | down | |
| TSX Gold Index (TGD) | 292.16 | 245.45 (new lows) | (3.1)% | (18.6)% | down | down | down | |
| Fixed Income Yields/Spreads | ||||||||
| U.S. 10-Year Treasury Bond yield | 1.52% | 2.75% | (6.1)% | 80.9% | ||||
| Cdn. 10-Year Bond CGB yield | 1.43% | 2.84% | (7.5)% | 98.6% | ||||
| Recession Watch Spreads | ||||||||
| U.S. 2-year 10-year Treasury spread | 0.79% | (0.22)% | (10.0)% | (127.9)% | ||||
| Cdn 2-year 10-year CGB spread | 0.48% | (0.24% | (50.0)% | (150.0)% | ||||
| Currencies | ||||||||
| US$ Index | 95.59 | 106.62 | (1.2)% | 11.5% | up | up | up | |
| Canadian $ | .7905 | 0.7737 | 1.4% | (2.1)% | neutral | down | neutral | |
| Euro | 113.74 | 102.11 | 1.2% | (10.2)% | down | down | down | |
| Swiss Franc | 109.77 | 103.93 | 1.5% | (5.3)% | up | down | down | |
| British Pound | 135.45 | 119.93 | 1.1% | (11.5)% | down | down | down | |
| Japanese Yen | 86.85 | 73.50 | 1.8% | (15.4)% | down (weak) | down | down | |
| Precious Metals | ||||||||
| Gold | 1,828.60 | 1,727.40 | 1.3% | (5.5)% | down | down | neutral | |
| Silver | 23.35 | 18.62 | 2.1% | (20.3)% | down | down | down | |
| Platinum | 966.20 | 867.20 | 6.1% | (10.3)% | down | down | down | |
| Base Metals | ||||||||
| Palladium | 1,912.10 | 2,018.80 | 6.4% | 5.6% | up | down (weak) | down (weak) | |
| Copper | 4.46 | 3.35 | 4.4% | (25.0)% | down | down | neutral | |
| Energy | ||||||||
| WTI Oil | 75.21 | 94.70 | (1.1)% | 25.9% | down | neutral | up | |
| Nat Gas | 3.73 | 8.2 | 24.2% | 119.8% | up (weak) | up | up | |
__
(Featured image by Pexels via Pixabay)
DISCLAIMER: This article was written by a third party contributor and does not reflect the opinion of Born2Invest, its management, staff or its associates. Please review our disclaimer for more information.
This article may include forward-looking statements. These forward-looking statements generally are identified by the words “believe,” “project,” “estimate,” “become,” “plan,” “will,” and similar expressions. These forward-looking statements involve known and unknown risks as well as uncertainties, including those discussed in the following cautionary statements and elsewhere in this article and on this site. Although the Company may believe that its expectations are based on reasonable assumptions, the actual results that the Company may achieve may differ materially from any forward-looking statements, which reflect the opinions of the management of the Company only as of the date hereof. Additionally, please make sure to read these important disclosures


Ecobnb Turns Sustainable Tourism Into Measurable Impact
Ecobnb’s sustainable tourism platform generated significant environmental and social impact in 2025, avoiding 58,207 kg of CO₂ and adding 583...


Sugar Markets Balance Biofuel Demand and Global Supply
Sugar markets in New York and London were mostly unchanged as the Iran conflict renewed interest in biofuels. Drought concerns...


The $40 Trillion Trap: Disinflation Is Not Deliverance
U.S. debt has reached $40 trillion, with $24 billion weekly interest, while deficits accelerate. Despite disinflation in CPI, from cooling...


FinTech Matures as AI and Infrastructure Drive the Next Growth Phase
Fintech markets are entering a mature phase, shifting from rapid growth to consolidation, specialization, and sustainable business models. Zurich and...


Bitcoin, and Ethereum Rise, While Cardano Enters Transition
Bitcoin and Ethereum posted modest weekend gains, supported by ETF inflows. A new proposal may protect Bitcoin from quantum threats....
 |
|
 |  |
 |
|
-

 Africa1 week ago
Morocco Cuts Card Fees to Spur Digital Payments, but Uncertainty Remains
-
 Markets2 weeks ago
Rice Prices Rise as Supply Outlook Tightens and Demand Stays Mixed
-

 Cannabis5 days ago
Virginia Cannabis Market Could Reshape Regional Competition
-

 Biotech2 weeks ago
BIP Sells BIC Incubator to Innova, Refocuses on Core Innovation Areas