Business
How a Reddit post caused hedge fund managers lose 10 billion dollars
It was the week of Reddit, WallStreetBets, and GameStop. Retail traders taking down hedge funds. It was the story of the week and hard to ignore so it is our Chart of the Week. Have the markets topped? The markets ended the month down in January so the January Barometer says it could be a negative year. But over the past decade the January Barometer has faltered half the time.

Hard to believe that the first month of 2021 is over. And what has changed? Well, nothing. The pandemic still rages; climate change and the environment continue to be of grave concern, particularly as they relate to biodiversity and habitat loss, pollution of the oceans, water scarcity sparking famines, and rapidly collapsing ice shelves; the world, with some exceptions, is still gripped in the steepest recession since the Great Depression; deep political divisions and turmoil continue in numerous countries, particularly the U.S.; food insecurity and famines pose a big threat as the number of people in poverty and experiencing hunger has jumped sharply in the past year, and the gap between rich and poor countries and wealth and income inequality in individual countries has grown sharply.
The World Economic Forum (WEC) has listed the areas of highest risk over the next decade. It is no surprise that four of their top five risks are related to climate change/environment. In order they list as the top risks over the next decade as 1. Extreme weather, 2. Climate action failure, 3. Human environmental damage, 4. Infectious diseases, and 5. Biodiversity loss. (Source: World Economic Forum Global Risks Report 2021 www.weforum.com and www.bloomberg.com). Dropped from their list were cyber attacks, data fraud and theft, and major natural disasters.
As one can expect, besides the pandemic, the economy has been weakened as well by rising debt and environmental damage. Economic inequality has weakened political systems and has helped spur the rise in populism. The pandemic itself has now passed 100 million cases and over 2.2 million dead. For the U.S., it has passed 26 million cases and 450,000 dead. The number killed by the pandemic in the U.S. has now surpassed the total U.S. killed in World War II.
Despite a sharp but swift stock market crash in March 2020 triggered by the COVID-19 pandemic, stock markets around the world enjoyed a banner year. The Dow Jones Industrials (DJI) gained 7.2% and gold was up 24.4%. Big winners in 2020 were high tech (software), internet, basic materials, semi-conductors, and ecommerce. But not all sectors were winners. Big losers were energy (oil & gas), big banks, real estate, airlines, and aerospace and defense. Individually, Bitcoin was a huge winner, up just over 300%, but silver was the leader vs. everyone else as it gained 47%.
With the first month of the year out of the way we can now look at the January Barometer. The January Barometer was devised by Yale Hirsch of the Stock Traders Almanac (www.stocktradersalmanac.com) in 1972. What Hirsch discovered was: as goes the S&P 500 in January, so goes the market for the year. Since 1950 the indicator has returned only 10 major errors for an 85.7% accuracy ratio. Impacted years were 1966 and 1968 (Vietnam), 1982 (start of a major long-term bull market), 2001 (9/11), 2003 (Iraq war), 2009 (start of a new bull market), 2010 (saved by QE2), 2014 (saved by QE3), 2016 (growth fears that dissipated), and 2018 (trade wars). That five of the errors have occurred in the past decade should not, however, be dismissed. Could the indicator now be failing?
So, what did January 2021 bring? The S&P 500 closed the month down 1.1%. According to the January Barometer that bodes poorly for 2021, setting aside the concerns about the poor performance of the indicator over the past decade. A positive for the indicator is the accuracy ratio in post-presidential election years that has been 82.3% accurate. However, since the market was down, it has tended to be a signal for either the start of a bear market or the continuance of one. Well, except for the past decade when down Januarys in 2009, 2010, 2014, and 2016 signaled more the end of any bear move. So, what will save 2021? QE5? We do note that February tends to be a weak month. Historically February ranks 8th for the DJI and 10th for the S&P 500. Last year February proved to be the top prior to the March pandemic crash.
It was no surprise that the FOMC (Fed) left policy unchanged. It was expected. The Fed did note that the U.S. economy has slowed a bit over the past few months and that the pandemic still poses considerable risk, regardless of the distribution of the vaccine. Any “taper talk” is just that—talk. The Fed will continue its bond buying program of at least $120 billion per month of U.S. treasuries and mortgage securities and interest rates will remain at/near zero for the foreseeable future. There is little expectation of potential taper until at least 2022. This will help keep a lid on interest rates and also on inflation. If the stock market cracked we fully expect the Fed to once again come to the rescue and pump up its bond buying (QE5?).
Speaking of inflation, we can’t help but notice that the number of cases of COVID-19 has tapered off. Is it a natural occurrence? Or is it because the vaccinations are kicking in? Deaths remain high. Not only has the number of cases fallen in the U.S. it has fallen globally as well. The 7-day MA of cases globally peaked at 745,000 back on January 11. Now it is at 556,000. In the U.S. it peaked at 254,000, also on January 11. Now it has fallen to 160,000. Deaths? Globally still high at over 14,000 daily and in the U.S. 3,300 daily. Not only are cases falling but hospitalizations are also down as well the number in ICUs. But the bodies keep stacking up. But what of the new variants? Could they once again spark a big spike in cases?
Despite the vaccinations, things will most likely only recover slowly. Society has been scarred by COVID-19 and caution will be the word. The Great Depression followed by a war scarred an entire generation. The experience with COVID-19 will likely also scar the current generation. All of this will help keep a lid on inflation. Where inflation could be experienced is growing shortages of commodities, including food. As well, the current cold war between the U.S. and China could also create inflation because of the busting of supply chains. So, there are forces for and against inflation.
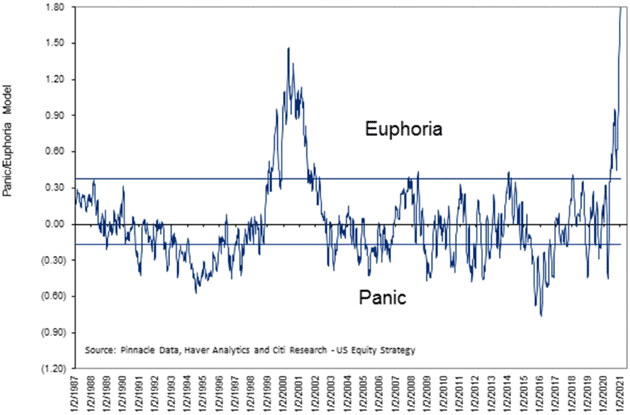
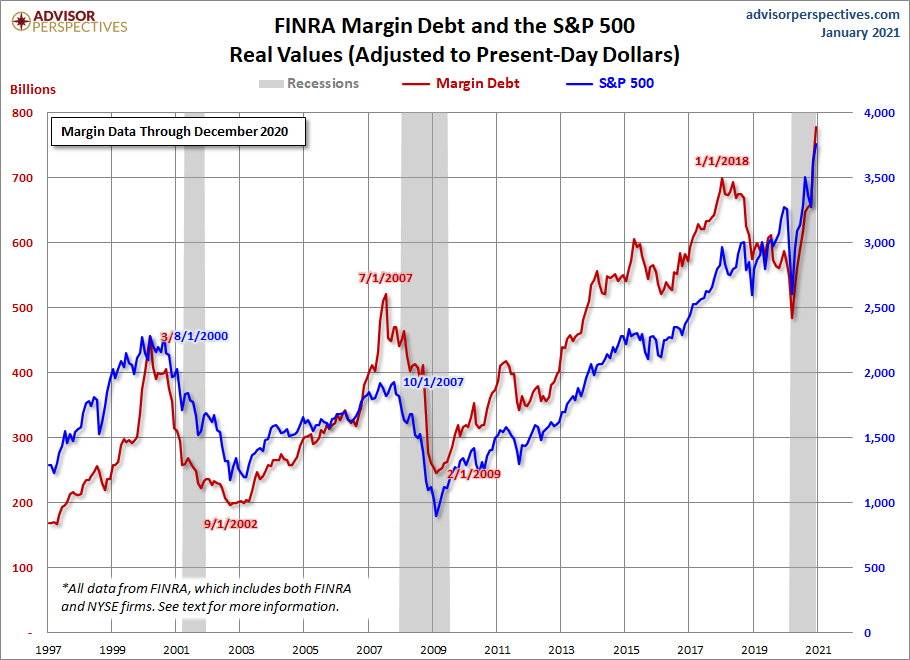
However, monetary inflation is something else. Monetary inflation has helped contribute to the huge rise in the stock market, creating what many believe is a bubble. But, as we have noted, the bubble has shown up not just in the stock market but also in housing, cryptocurrencies, collectibles, and more. It seems that investors are relying on accommodative monetary conditions and zero rates forever. Extreme valuations are the norm. We have two charts below showing the euphoria that surrounds the market.
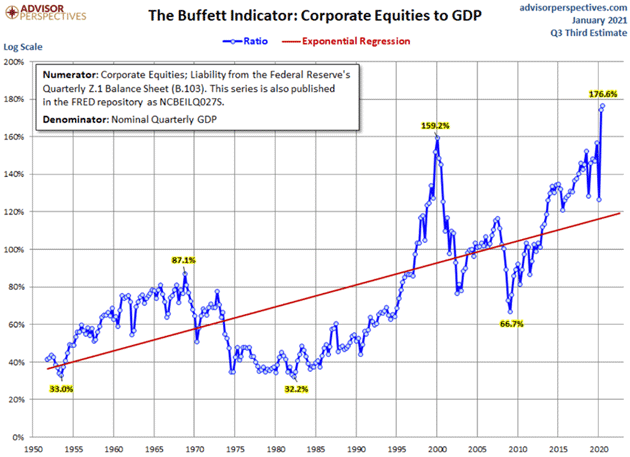
First below is a Euphoria/Panic Index from Citi Research. It has gone off the charts. That other big spike was in late 1999/2000 at the top in the dot.com/high-tech bubble. Oddly, most market tops came when the index just hit the Euphoria line. Going well over the line is a rarity. The dot.com/high-tech bubble had the index over the Euphoria line for upwards of three years before the bubble finally burst. So far it hasn’t even been a year. But then it has never been this high. The second chart shows the Buffett Indicator. It too is in record territory, far surpassing the high seen once again at the dot.com/high-tech bubble extreme in 2000.
So, what does all this mean? The sharp drop on January 27, 2021 could be the start of a much bigger drop. Or it may once again peter out so that the drop is merely a correction within the context of a bull market. Not priced into the market is the potential for a severe lockdown in an attempt to get the pandemic under control. Given the extreme divisiveness in the country, any lockdown will most likely be accompanied by protests and violence. The combination of the pandemic—particularly with spreading variants—a lockdown, and extreme divisiveness could have a negative impact on the economy that could in theory extend into Q2. None of this is priced into the market. The wide expectation is that Q1 will continue to see negative growth. But then Q4 surprised, recording a 4% GDP gain even as the year ended in the red, down 3.5%, the worst performance since 1946. The question is; however, will it be enough to break the stock market?
Euphoria and Panic Index
Just because the market is showing extreme euphoria, the Buffett indicator is in the stratosphere, and numerous other indicators are screaming “extremes” it does not necessarily translate into a huge market drop. There would have to be another trigger that sparks a panic. Despite the massive accumulation of debt, there have been no debt collapse surprises that shocked the markets and threatened a global financial collapse as we saw in 2008. That does not, however, eliminate the risk. Periodic corrections of up to 10% should be viewed positively. One of those might be under way right now. Consider it a cleansing that acts to ease the speculative fever.
Panics and serious bear markets happen but not with any regularity. Since 1970, U.S. markets (and by extension Canada) have seen the 1973–1974 stock market crash, Black Monday 1987, the Friday the 13th mini-crash in 1989, the Iraq oil crisis of 1990, the 1998 Russian/LTCM mini-crash, the dot.com crash in 2000–2002, the 9/11 crash of 2001, the financial crisis of 2008 and 2007–2009 stock market crash, the trade war mini-panic 2018, and the pandemic March 2020 crash. Could 2021 bring us another one?
The Pandemic Rages On!
Sunday January 31, 2021 – 17:17 GMT
World
Number of Cases: 103,219,580
Number of Deaths: 2,231,233
U.S.A.
Number of Cases: 26,656,767
Number of Deaths: 450,387
Canada
Number of Cases: 775,048
Number of Deaths: 19,942
Source: www.worldometers.info/coronavirus
Chart of the Week
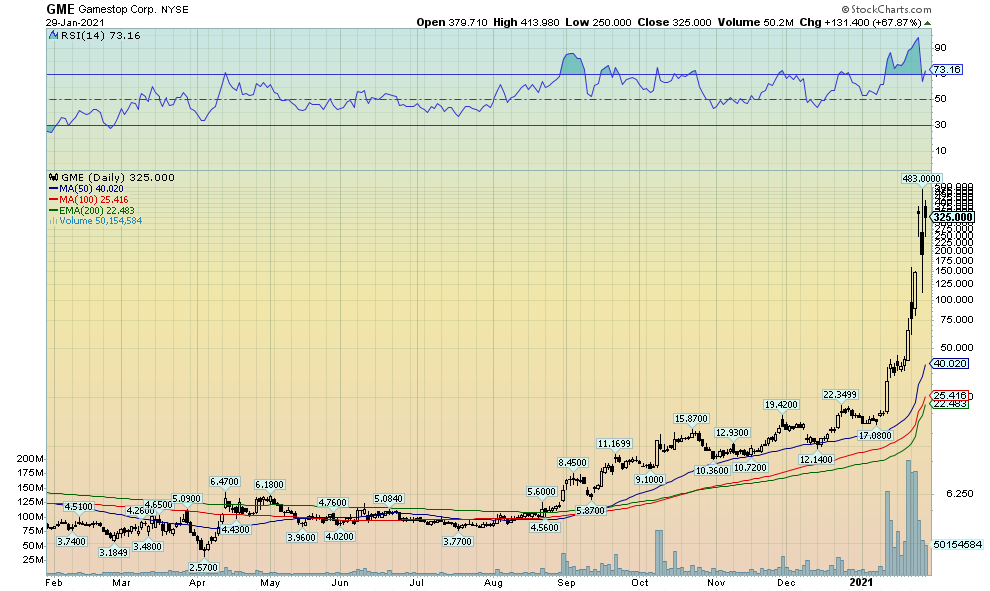
We’re speechless. A week or so ago we had never even heard of Reddit. Now all of a sudden, it’s all the buzz. GameStop (GME/NY) has become the stock de jour, all the rage. Stunning. 2,600% gain in 20 days. But what goes up, also goes down. GameStop hasn’t been the only high flyer. Others include bankrupt AMC Entertainment (AMC/NY) – 925%, 22 days, Canada’s Blackberry (BB/NY/TO) – 337%, 22 days, Express Inc. (EXPR/NASDAQ) – 1,100%, 7 days, and Naked Brands (NAKD/NASDAQ) – 730%, 3 days. There have been others. Imagine a company that was under $20 in early January and losing $4/share suddenly soars to almost $500. But there were more shorts outstanding than there were actually shares outstanding. Naked short selling?
Traders have piled in. They trade from their living rooms, their home office, their kitchen, and their bathroom. Some hedge funds who had the misfortune of having shorted these stocks were forced to cover, suffering multi-million-dollar losses and inadvertently adding to the craze. Short sellers are a target for the Reddit crowd. Find a stock with a heavy short position and then start buying like crazy. Watch the short-sellers squirm. David (Reddit users) vs. Goliath (hedge funds). Online brokers are overwhelmed, choking even. Try getting a real live body to talk to. We know. Difficult. Need to open an account, transfer money, or just make a switch in your account? Fuhgeddaboudit.
The purveyors of this insanity have included Reddit, Twitter, WallStreetBets, plus other stock chat rooms and social media forums where stocks are discussed ad nauseum, rumors are rife, and using your head non-existent. WallStreetBets has come out of nowhere to number one Coin Market Cap (www.coinmarketcap) as a cryptocurrency. Suddenly it has a market cap of over $24 billion. Unbelievable! In a pandemic, many have nothing else to do. So, trade they do. 20% unemployment? Who cares? Easy money? Not so fast. Tulip mania, the Mississippi Bubble, the South Sea Bubble, the Roaring Twenties Bubble, the dot.com Bubble, the Japanese Bubble Economy, and the Cryptocurrency Bubble and more all collapsed, leaving behind many a bankrupt investor. Oh, a few always survive and tell everyone else what geniuses they are. Only speculate with what you can afford to lose. Most don’t.
Now they are caught. Online trading platforms including Robinhood, TDAmeritrade, Interactive Brokers, and many others are suddenly restricting, or even cutting off entirely, trading in high-flying stocks like GameStop and AMC. Oops! Tilt! Down we go. Arghhh………there goes the rent money. Poof!
But it all shows the power of some retail traders that they can even take down giant hedge funds. But brokers such as Robinhood putting restrictions on trading these high-flying stocks? What? They are siding with the short sellers? The rising tide of complaints and threats of lawsuits quickly had Robinhood backing down quickly and pulling the restrictions off. And then once again GameStop took off. A quip from a market participant –

GameStop closed at $325 on Friday. On January 8 the stock was $17.08. The high? $483. But the damage was done. The hedge funds? Forget $10 billion. The estimate is now as a high as $70 billion. History repeats itself. First as tragedy, then as farce.
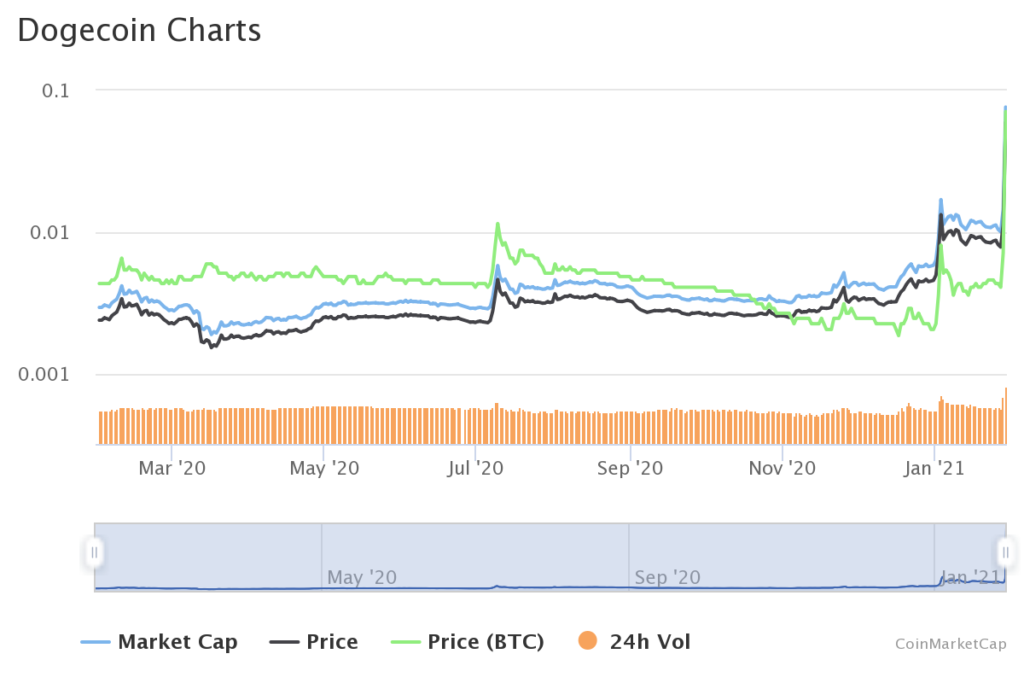
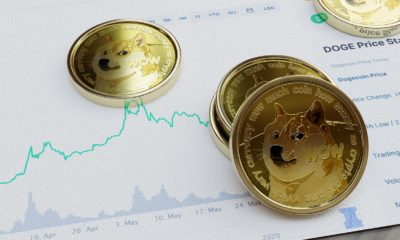
But before we leave this, we’d like to note that the craze appears to be elevating cryptocurrencies as well. One of our old favourites, Dogecoin, has leaped over 1,000% since December 31, 2020. It is mindboggling to think of a crypto that was started basically as a joke now with a market cap of over $7.6 billion and as the 10th largest crypto in a universe of over 8,000 different cryptos. What does one use Dogecoin for? Does it matter? It lists a circulating supply of over 128 billion. Bitcoin by comparison has a circulating supply of only 18.6 million. To put Dogecoin in perspective with Bitcoin it would translate Dogecoin into a price of $366. That’s still a long way from Bitcoin’s price of about $37,000. When things get crazy, things get crazy. What next? We are reading that the Reddit crowd may attack silver. Now for long-suffering gold and silver bugs that would be a sight.
WOOF!

MARKETS AND TRENDS
| % Gains (Losses) Trends | |||||||
| CloseDec 31/20 | CloseJan 29/21 | Week | YTD | Daily (Short Term) | Weekly (Intermediate) | Monthly (Long Term) | |
| Stock Market Indices | |||||||
| S&P 500 | 3,756.07 | 3,714.24 (new highs) | (3.3)% | (1.1)% | neutral | up | up |
| Dow Jones Industrials | 30,606.48 | 29,982.62 (new highs) | (3.3)% | (2.0)% | down | up | up |
| Dow Jones Transports | 12,506.93 | 12,087.99 | (6.0)% | (3.4)% | down | up | up |
| NASDAQ | 12,888.28 | 13,070.69 (new highs) | (3.5)% | 1.4% | up | up | up |
| S&P/TSX Composite | 17,433.36 | 17,337.02 | (2.9)% | (0.6)% | down | up | up |
| S&P/TSX Venture (CDNX) | 875.36 | 922.06 (new highs) | (2.7)% | 5.3% | up | up | up |
| S&P 600 | 1,118.93 | 1,188.71 (new highs) | (3.5)% | 6.2% | up | up | up |
| MSCI World Index | 2,140.71 | 2,116.96 | (2.9)% | (1.1)% | down (weak) | up | up |
| NYSE Bitcoin Index | 28,775.36 | 37,112.00 | 3.4% | 29.0% | up | up | up |
| Gold Mining Stock Indices | |||||||
| Gold Bugs Index (HUI) | 299.64 | 283.63 | (1.8)% | (5.3)% | down | down | up |
| TSX Gold Index (TGD) | 315.29 | 303.69 | (2.3)% | (3.7)% | down | down | up |
| Fixed Income Yields/Spreads | |||||||
| U.S. 10-Year Treasury yield | 0.91 | 1.07% | (1.8)% | 17.6% | |||
| Cdn. 10-Year Bond yield | 0.68 | 0.89% | 6.0% | 30.9% | |||
| Recession Watch Spreads | |||||||
| U.S. 2-year 10-year Treasury spread | 0.79 | 0.86% | (11.3)% | 8.9% | |||
| Cdn 2-year 10-year CGB spread | 0.48 | 0.73% | 10.6% | 52.1% | |||
| Currencies | |||||||
| US$ Index | 89.89 | 90.57 | 0.4% | 0.8% | up (weak) | down | down |
| Canadian $ | 0.7830 | 0.7810 | (0.6)% | (0.3)% | down | up | neutral |
| Euro | 122.39 | 121.33 | (0.3)% | (0.9)% | down | up | up |
| Swiss Franc | 113.14 | 112.24 | (0.6)% | (0.8)% | down | up | up |
| British Pound | 136.72 | 137.09 (new highs) | 0.1% | 0.2% | up | up | up |
| Japanese Yen | 96.87 | 95.49 | (0.9)% | (1.4)% | down | up | up |
| Precious Metals | |||||||
| Gold | 1,895.10 | 1,850.3 | (0.3)% | (2.4)% | neutral | neutral | up |
| Silver | 26.41 | 26.91 | 5.3% | 1.9% | up | up | up |
| Platinum | 1,079.20 | 1,079.20 | (2.9)% | flat | up | up | up |
| Base Metals | |||||||
| Palladium | 2,453.80 | 2,208.40 | (6.6)% | (10.0)% | down | neutral | up |
| Copper | 3.52 | 3.56 | (1.9)% | 1.1% | neutral | up | up |
| Energy | |||||||
| WTI Oil | 48.52 | 52.20 | (0.1)% | 7.6% | up | up | neutral |
| Natural Gas | 2.54 | 2.56 | 4.1% | 0.8% | neutral | up (weak) | neutral |
Note: For an explanation of the trends, see the glossary at the end of this article.
New highs/lows refer to new 52-week highs/lows.
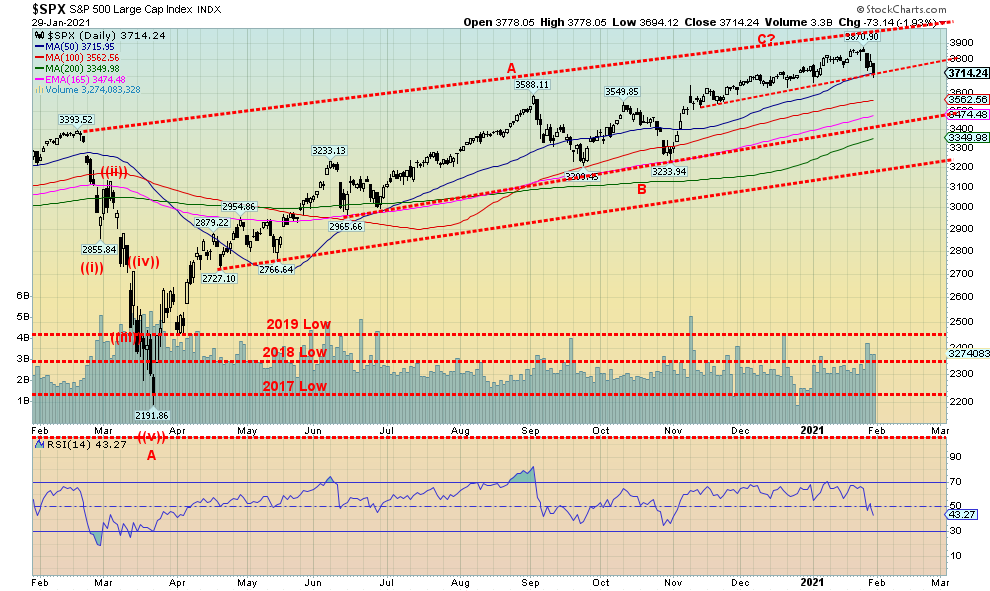
Is this it? The top? Could be! We look back on last year and we note that on February 12 the Dow Jones Industrials (DJI) topped and four days later the S&P 500 topped. Then came the big drop. 38% for the DJI and 35% for the S&P 500. The pandemic crash of 2020. So, what happened this year? Well, on January 20 the DJI topped and four days later on January 26 (trading days, not actual days) the S&P 500 topped. Could we be faced with another March 2020 pandemic crash? While we think not, we do not wish to rule it out.
Markets made all-time highs this past week, then reversed and closed lower. The S&P 500 fell 3.3%, the DJI was off 3.3%, falling back below 30,000, the Dow Jones transportations (DJT) dropped 6.0%, while the NASDAQ fell 3.5%. The S&P 500, the DJI, and the NASDAQ all made new all-time highs first. Nobody was spared. The S&P 600 small cap dropped 3.5%. In Canada the TSX Composite fell 2.9% and the TSX Venture Exchange (CDNX) dropped 2.7%. In the EU, the London FTSE fell 5.1%, the Paris CAC 40 dropped 3.8%, and the German DAX fell 2.6%. In Asia, China’s Shanghai Index (SSEC) was off 2.3% and the Tokyo Nikkei Dow (TKN) fell 3.0%. The world MSCI Index fell 2.9%. Was there a winner? Yes, Bitcoin rose 3.4% but remains below its recent all-time high.
All of this occurred against the backdrop of the insanity going on with the short squeeze of GameStop and others. While the DJI was falling 600 points, GameStop was rising 67% in one day. So, what’s going on? Well, if hedge funds were blowing up and other short sellers were being squeezed with the GameStops’ of this world, it tells us they may have been unloading other stocks to raise cash and cover margins. As well, stop sells may have been triggered, adding to the drop. Anybody overleveraged in this market was probably bailing unless they also happened to hold a pile of Ultra VIX Short-term Futures ETF (UVXY). Since it is a leveraged play on a falling stock market it rose about 44% on the week. Last year UVXY rose almost 1200% during the March pandemic crash.
We also note margin debt was at record levels before this drop, so the market quite simply was over leveraged. And all this happened despite the introduction of new vaccines from Johnson & Johnson and Novavax. The market is also worried that the vaccines might not be as effective against the new variants which seem to be popping up everywhere.
So, what next here? As we note, we don’t believe we are being set up for a crash à la March 2020. But one can never rule it out. We appear poised to fall through one support line and could then fall to the next good support near 3,400/3,500. Under 3,400 would take us to 3,200 and under 3,200 a panic could occur. On the other hand, we have some support here so we could see a rebound rally develop as well. But we put less faith in that happening right now. If the GameStop crowd turn to bailing on their positions it could spark further selling on the markets as margin calls occur. All indices right now have potential to go lower. Volatility has shot up and appears poised to rise further. So far, this is only the first wave down. We’ll see how a second wave rebound develops. Then comes the third wave down. It’s usually the biggest and strongest.
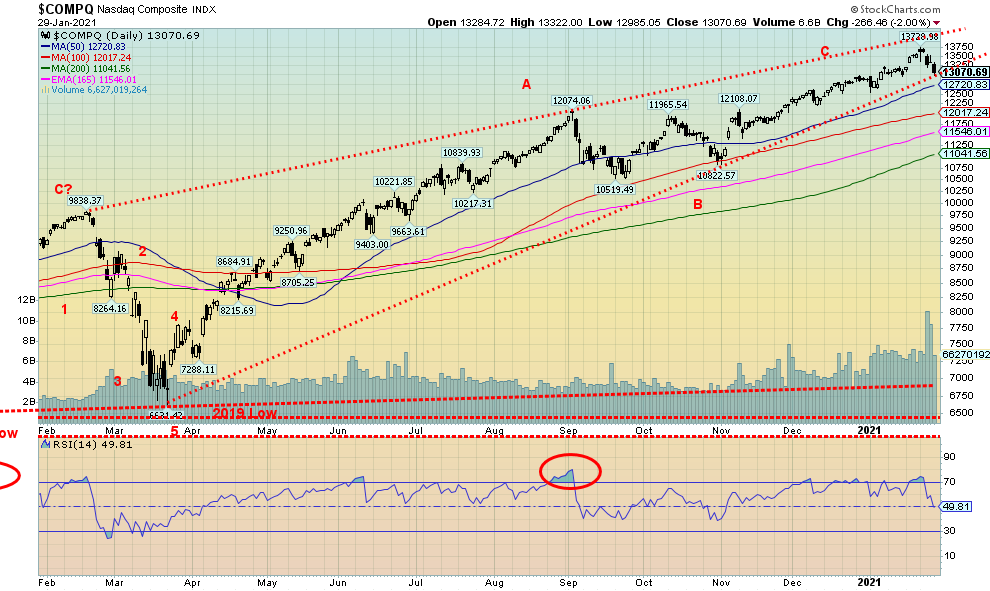
The NASDAQ fell to support this week near 13,000. Either we bounce from here or, once we break 13,000 again and fall through 12,700, a stronger wave to the downside should get underway. As the chart shows, longer term support is near the 200-day MA near 11,000. A breakdown under 11,000 could spark a panic. But a fall to the 12,000 area would be considered a fairly normal correction. Under 12,000 could set up the fall towards 11,000. Volume was high this past week in keeping with the bear decline. That is not a surprise. It rose last year before the March panic but this week’s volume was unusually high and that may turn out to be a bad sign. Only regaining back above 13,500 could alter the bearish scenario.
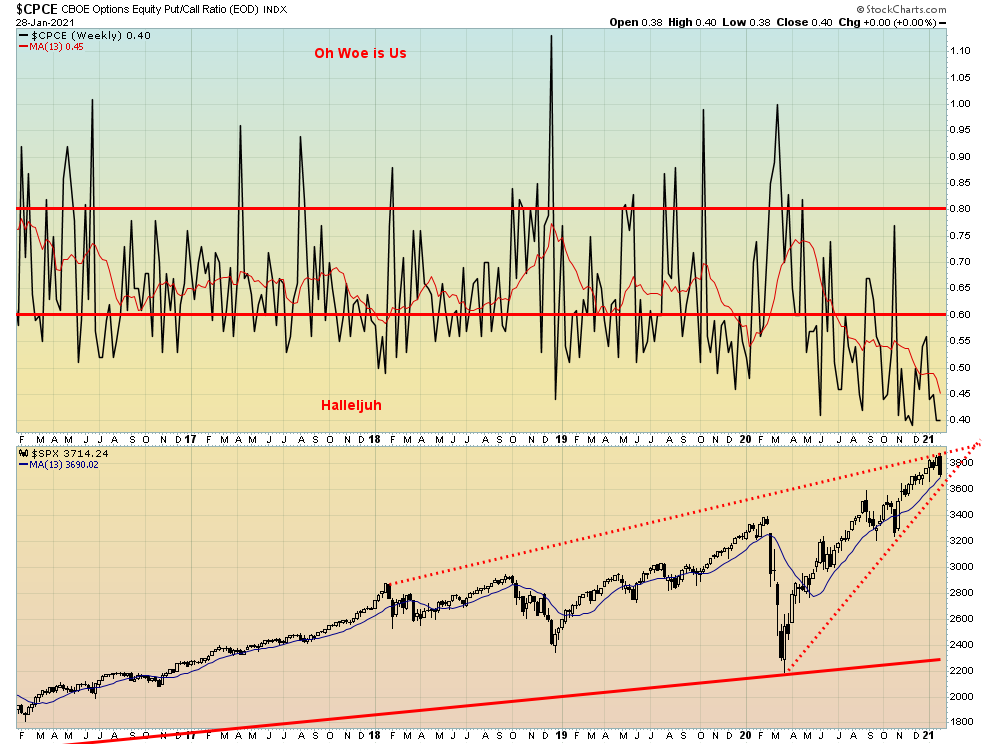
Given the down week for the stock market, we were surprised to find the put/call ratio still down at 0.40, not far from record lows. We’d like to see that rise now and a firm break under 3,700 could spark a dumping of calls and buying of puts. The put/call ratio is even below the 50-day MA at 0.45. But with all the craziness going in the markets, maybe a low put/call ratio should not be too surprising.
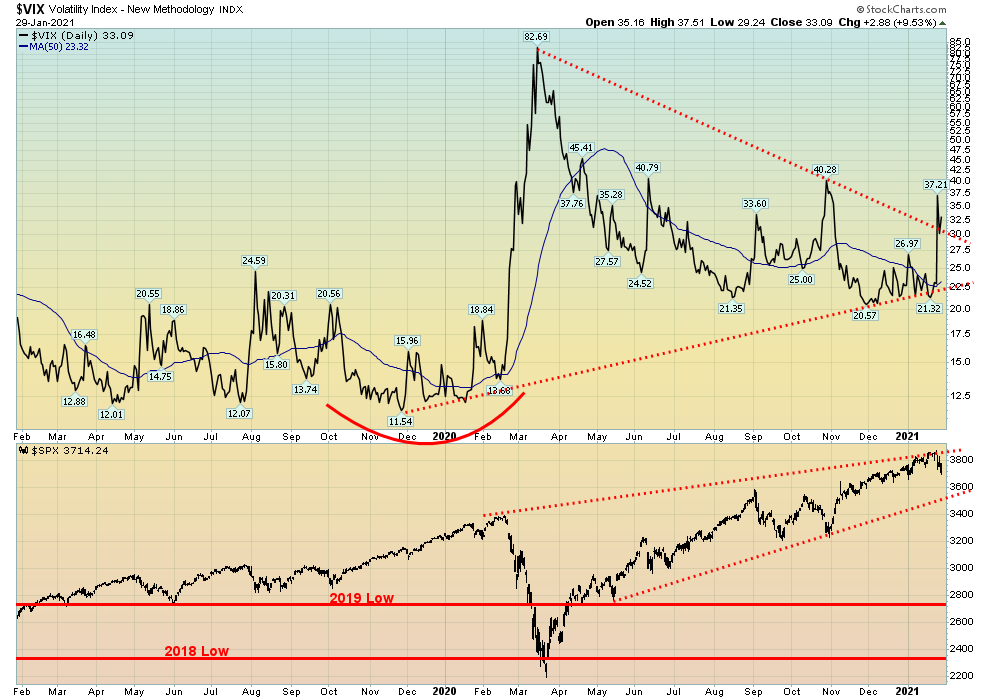
It’s no surprise that volatility rose this past week as the VIX volatility indicator broke the downtrend line, hitting a high of 37.21. The retest saw it fall back to the downtrend line near 30 before rising again on Friday. We had noted previously that the VIX was slowly rising even as the S&P 500 continued to rise. The VIX moves inversely to the S&P 500 so if the S&P 500 is rising the VIX is usually falling. When they are rising or falling together it is a divergence and often signals a potential change in trend. No surprise here the divergence was signaling a potential fall for the S&P 500 and it happened this past week.
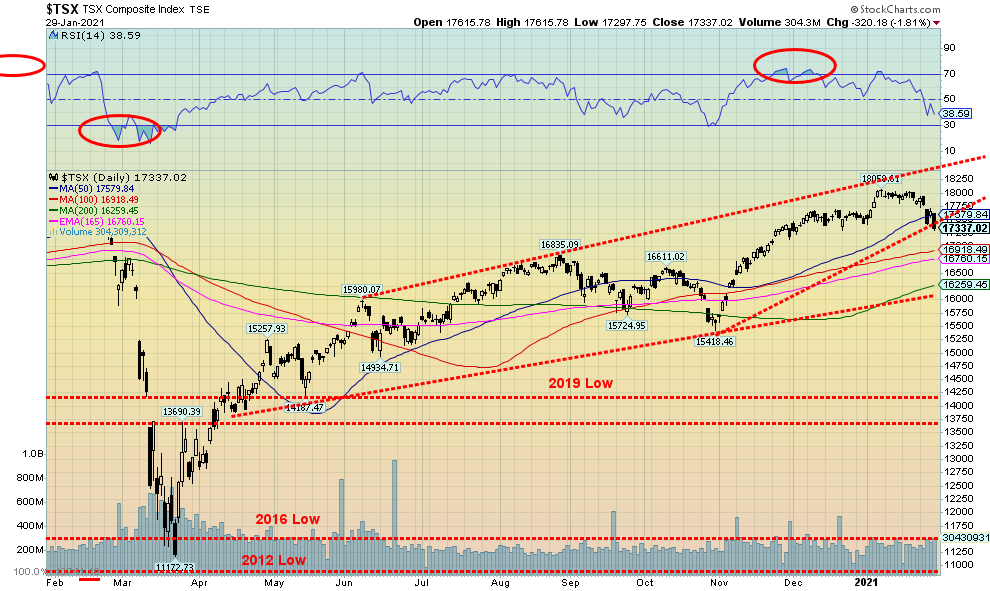
The TSX Composite joined the U.S. indices to the downside this past week as it fell 2.9%. The TSX closed down 0.6% for January. The TSX Venture Exchange (CDNX) made fresh 52-week highs, then reversed and closed lower off 2.7%. However, the CDNX remains up 5.3% for the year. The only sub-index sector to rise this past week was Health Care (THC) as it gained 3.6% and put in a stellar 34.8% gain for the month. All other sectors lost, led by Energy (TEN) down 5.4%. Metals & Mining (TGM) lost 4.6% while Golds (TGD) fell 2.3%. Consumer Discretionary (TCD) was also hit, down 4.4% while Information Technology (TKK) dropped 4.0% after it made new all-time highs.
Technically, the TSX doesn’t look good here as it appears to be breaking the uptrend line from a low in October. It also broke under the 50-day MA. Next target could be 16,700 to 16,900. Major support is seen at 16,250 to 16,300. Under 16,000 a more serious bear market could get underway. Regaining back above 18,000 would signal that new highs were possible. If all goes well here, the major uptrend line from that April consolidation should hold. However, like the S&P 500, a major break of 16,000 could spark a panic. Falling to 16,250 would be a fairly normal 10% correction.
U.S. 10-year Treasury Bond/Canadian 10-year Government Bond (CGB)
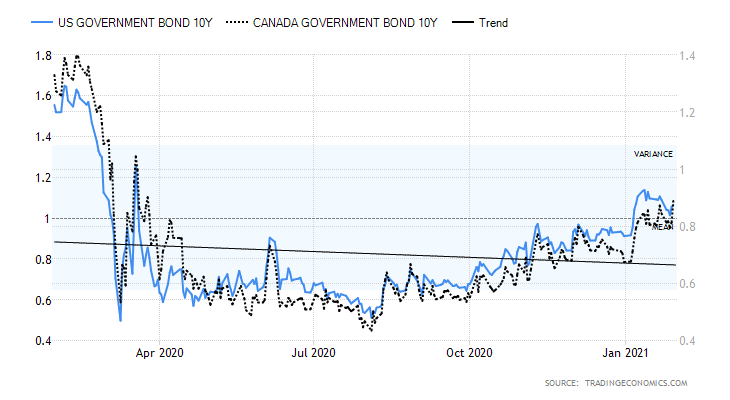
Since breaking above 1.00% in early January, follow-through has been lethargic. The peak for the U.S. 10-year treasury note was seen at 1.15% and it has since settled back, closing this week at 1.07%. The Canadian 10-year bond (CGB) closed up at 0.89%, a gain of about 6%. Spreads to the 2-year remain high at 86 bp for the 2–10 U.S. and 73 bp for the Canadian 2–10. That’s great for banks. Economic numbers on the week were a mixed bag. The Chicago Fed index came in at 0.52 which was positive given it was up from the November reading of 0.31; the Case-Shiller home price in November rose 1% and year-over-year up 11%; but the Richmond Fed fell to a reading of 14 for January, down from 19 and indicating some slowing. Durable goods for December were up 0.2% but ex-transportation was up 0.7%. The Q4 advance GDP was 4% which was roughly as expected but sharply below the 33.4% Q3 number. Year-over-year GDP was down 3.5%. Personal income in December was up 0.6% but personal spending fell 0.2%. The Chicago PMI for January was strong at 63.8 vs. 58.7 in December and an expectation of 58.5. The Michigan Consumer Sentiment Index was at 79 down from 80.7 but about as expected. Initial jobless claims were 847,000, about as expected. The number of Americans receiving unemployment benefits jumped to 18.28 million, a rise of 2.29 million in the past week. In Canada some 1.8 million are listed as unemployed.
This coming week is a big one with the ISM manufacturing numbers and the really big one on Friday, the nonfarm payroll and employment numbers. Nonfarm payrolls are expected to rise by 20–30,000 after falling 140,000 in December. The unemployment rate (U3) is expected to be 6.8% vs. 6.7%. Canada is expected to lose upwards of 55 thousand jobs and the unemployment rate could rise to 8.9%.
The Fed, as expected, left rates unchanged this past week and they will continue their bond buying program. With Janet Yellen at Treasury and Jerome Powell at the Fed expect a high degree of co-operation between the two.
As long as rates hold above 1% our expectations are that they could go slightly higher. We did hit a target at 1.15%.
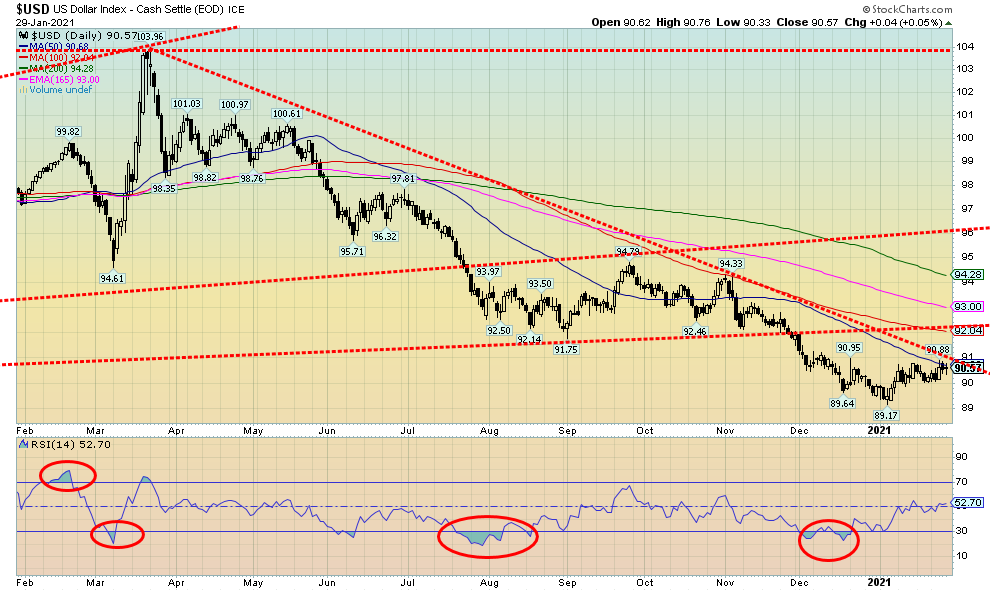
The US$ Index continues to rise, gaining 0.4% this past week. The rally has now taken us to the 50-day MA and the downtrend line from the top way back in March 2020 at 103.96. The question now is, does the US$ Index break out and rise to next resistance at 92 or does it fail here and begin its decent once again. It is interesting to note that the new/old Treasury Secretary Janet Yellen is not married to a strong dollar. During the Yellen years as chair of the Federal Reserve the US$ Index rose from 80.73 to 90.33, a gain of about 12%. Janet Yellen was the first female head of the Fed and is now the first female head of the Treasury. Ms. Yellen is also a proponent of opening the spigots to get as much help out into the economy as possible. Given the Fed is purchasing a lot of the U.S. debt, it is basically a wash as the U.S. is borrowing from itself and paying itself back. She is also a proponent of infrastructure projects which would have a positive GDP impact. The question is, has the U.S. dollar bottomed? The low thus far of 89.17 is short of targets of at least 88. It is possible that the US$ Index did complete a 5-wave decline from May 2020. However, as we know from this week’s Fed meeting, they are maintaining their dovish stance with zero percent interest rates and continuing their bond-buying program. Inflation remains low. Biden and Yellen appear set to find a way to get their stimulus program of $1.9 trillion through.
This past week the euro fell 0.3%, the Swiss franc was off 0.6%, but the pound sterling was up 0.1% and made new highs. The Japanese yen was off 0.9% while the Cdn$ dropped 0.6%. As noted, the US$ Index is at resistance so either we go through or we pull back once again. The rally from the 89.17 can be described as lethargic at best.
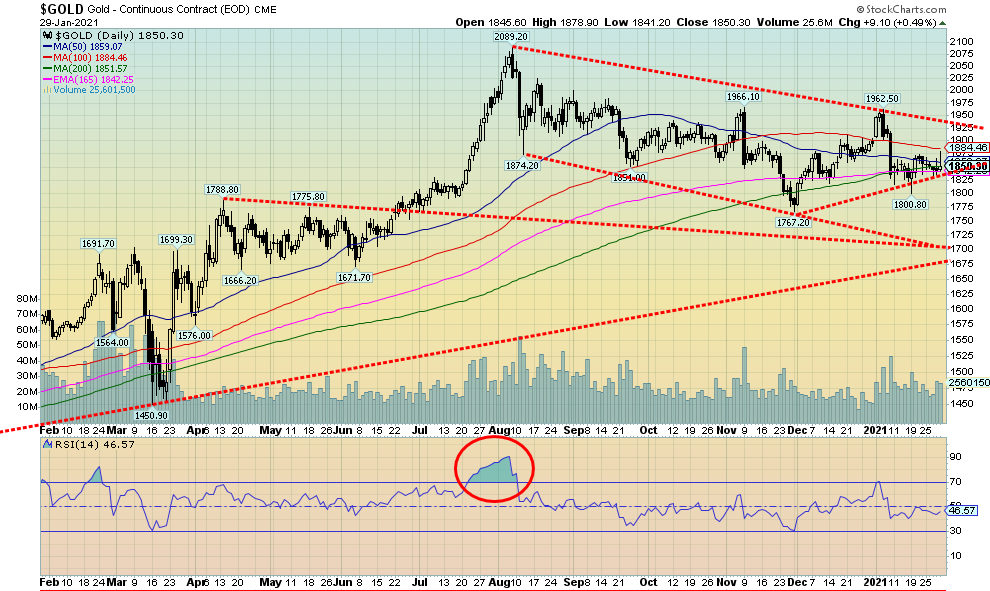
Gold didn’t quite benefit from the run-up in silver prices as gold ended the week down 0.3% and is now down 2.4% on the year, putting in a down month to start the year. Gold did rally on Friday with silver hitting a high of $1,879 before pulling back sharply and closing up 0.5% or $9 to $1,850. Silver was the big winner this past week, pushed by the Reddit traders and gaining 5.3%. Platinum fell 2.9% and palladium took a hit down 6.6%. Copper followed as well off 1.9% but finished the month up 1.1%. The gold stock indices also fell on the week along with the broader indices. Gold was helped by a weaker dollar on Friday although the dollar was overall a bit stronger on the week.
Gold is clinging to an uptrend but a breakdown under $1,828 could signal another test of $1,800. A breakdown under $1,800 would ensure a test of the November 30 low of $1,767 and possibly new lows. Major long-term support is seen at $1,700. If that ever broke (not expected), it would signal the end of the gold bull. Nothing much has changed here for gold. Gold needs to regain first $1,900/$1,915, then take out $1,925 and recent highs at $1,950/$1,960. Once that occurs, we should go on to make new highs above $2,089. New highs are highly probable over $2,015. Gold has been underperforming silver and, as we note with a chart of the gold/silver ratio, a break of the ratio under 68 would set up a bigger rally for both gold and silver. We continue to have unfulfilled possible targets for gold up to $2,200/$2,400. Others have even higher targets but that is as high as we can see for now. We remain in a period of positive seasonals for gold that do extend into early March. The rally at the end of the week was welcomed, but the reality is gold still has work to do here. We’d also like to see the gold stocks start to lead once again as well. That would be another positive sign. So far, they have been sluggish.
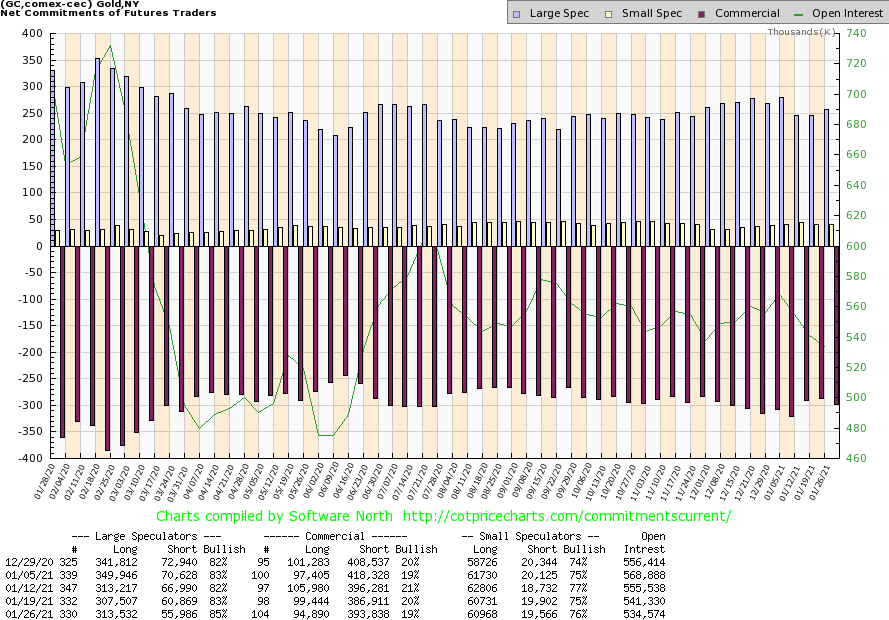
The commercial COT for gold slipped to 19% this past week from 20%. Short open interest rose roughly 7,000 contracts while long open interest fell about 4,500 contracts. The large speculators COT (hedge funds, managed futures, etc.) rose to 85% from 83% as they added roughly 6,000 longs and cut their shorts by about 5,000 contracts. Overall open interest was down roughly 7,000 contracts during a down week. That suggests to us that the drop in gold prices was corrective and not setting up a bigger drop. Still, the COT remains a bit too bearish so it should be noted.
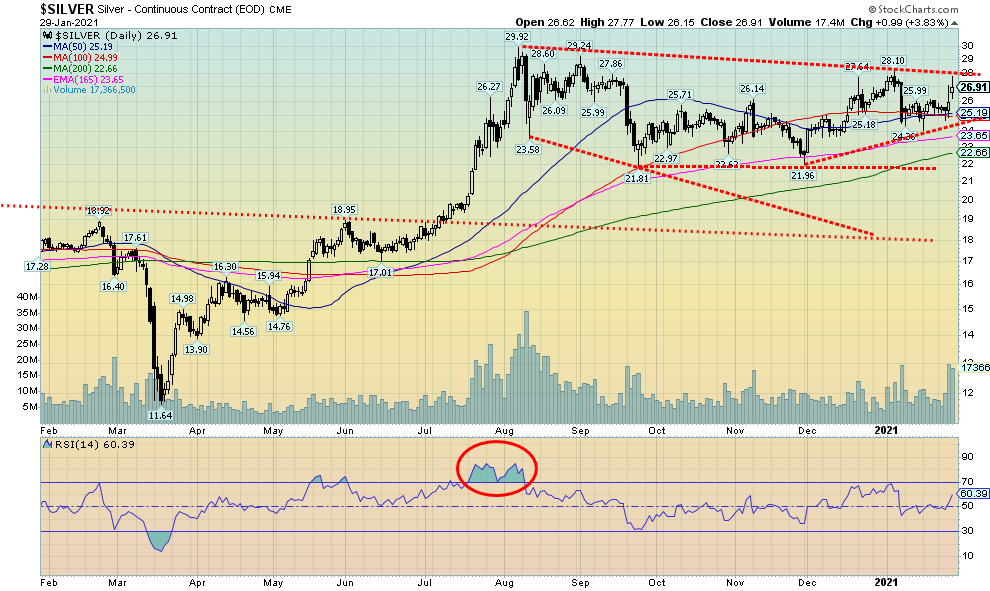
Silver enjoyed a banner week, outperforming all the other metals as it gained 5.3% and is now up 1.9% on the year. The rally got underway on Thursday when rumours circulated that Reddit traders were circling silver shorts, particularly as related to the iShares Silver Trust (SLV). SLV rose 5.6% on the week. The rise in silver rubbed off on gold as it jumped as well but not enough to pull gold into the black for the week. A softer dollar helped as well. Volumes rose for both the SLV and silver stocks. We should be reminded, however, that the silver market is not GameStop. The market is far bigger and deeper than the stocks that were being targeted by the Reddit traders, making it a lot harder to manipulate. Silver now sits potentially on the cusp of a breakout if this continues into the coming week. The breakout point is at $28, just above Friday’s high of $27.77. Silver closed Friday at $26.91 after being as low as $24.72 on Wednesday. A breakout above $28 and especially above $29 would signal new highs above $29.92 with potential targets up to $36 with a range from $33 to $36. A minimum objective would be at least the former high, but we suspect that would fall if got that far. Ultimate targets for silver could be $45, $55, and even as high as $65 if a powerful breakout got underway. However, we don’t want to jump the gun when first we have to clear $28 and $29 to even suggest new highs above $30. Any move now back under $26 would put this current rally in doubt, so we’ll want to see new highs above $27.97 soon and not a break back under $26. The recent low was seen at $21.96 so a breakdown under $22 would be very negative and suggest that the silver bull is over. Merriman of Merriman Cycles (www.mmacycles.com) suspects that the March 2020 low was a half-cycle low (7–11 years) of the 18-year cycle last seen in 2008. He felt it fit characteristics of that, given it was sharp and sudden but short-lived. The next cycle low might not be due until later this year so the belief is that the current up cycle still has more legs before it crests. The bigger 18-year cycle is not due to bottom until 2026–2028. And if the Reddit traders do have their way, they could push silver to much higher prices. We just warn them that the silver market is not GameStop.
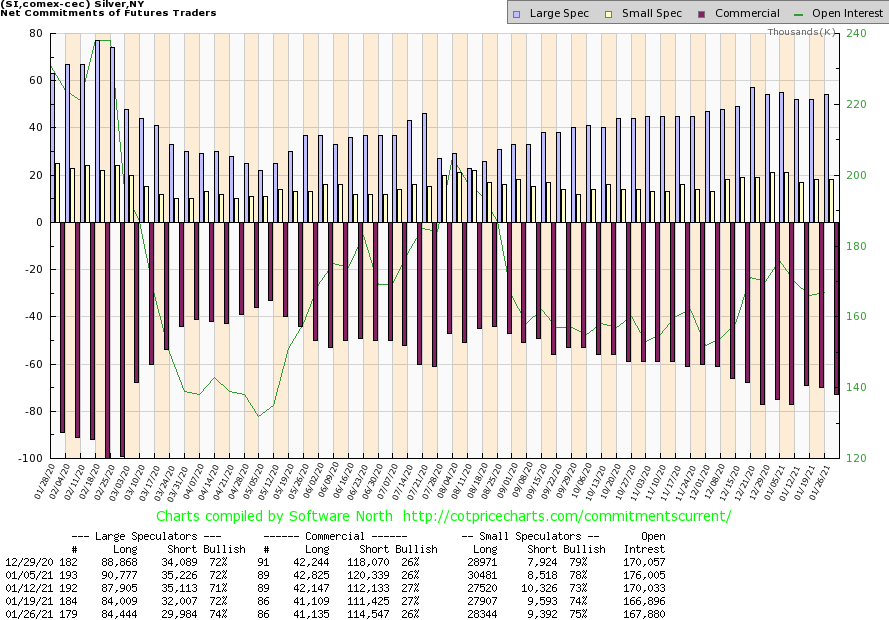
The silver commercial COT slipped this past week to 26% from 27%. Short open interest rose about 3,000 contracts while long open interest was relatively flat. The large speculators COT rose to 74% from 72%. The numbers this week do not yet reflect the rally that took place in silver in the latter part of the week. Overall, the COT remains bearish for silver.
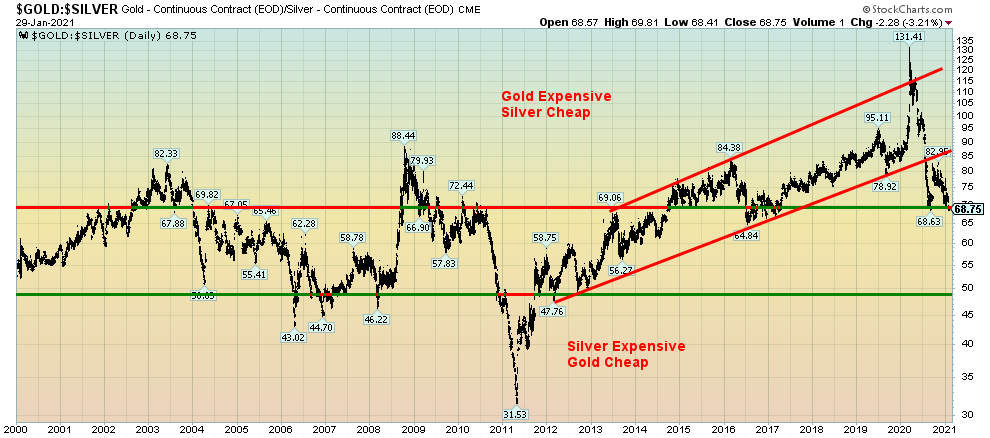
The gold/silver ratio is signalling to us that a breakdown is ahead as silver continues to lead the way. A firm break under 68 for the gold/silver ratio would signal a potential decline towards next major support near 50. Silver is the leader both in bear and bull markets. Bear markets occur when silver underperforms gold and bull markets occur when silver outperforms gold. Since peaking back in March 2020 at 131, silver has been generally leading the way. This week’s rally in silver even as gold faltered is another example of silver leading, irrespective of the reasons why silver did rally in the first place. But right now, a firm breakdown under 68 would signal to us that things could get interesting for both gold and silver.
The gold stocks continue to struggle. An exception was seen this week with the silver stocks that rallied on the back of the 5%+ jump in silver prices as rumours flew that the Reddit crowd were targeting the silver shorts. Still, the TSX Gold Index (TGD) ended the week down 2.3% while the Gold Bugs Index (HUI) was off 1.8%. On Friday, after the gold stocks opened strong, they later came under pressure as the broader stock market sold off, resulting in a 600-point loss for the DJI. At the end of the week the only bright spot was the silver stocks as First Majestic (FR) ended the week up 29.6%, Fortuna Silver (FVI) gained 8.7%, Pan American Silver (PAAS) up 7.7%, Silvercorp Metals (SVM) up 8.1%, Endeavour Silver (EDR) jumped 10.1%, and Mag Silver (MAG) was up 6.7%. Overall, it was the gold stocks that pulled the indices down.
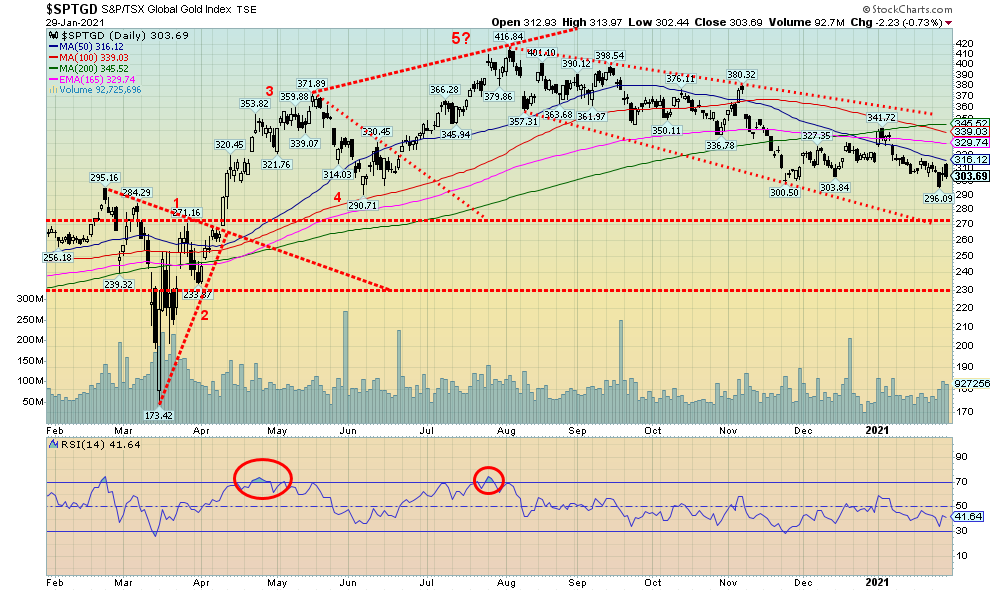
The TGD remains firmly in a downtrend although it has not collapsed, sitting as it is down 27% from the August top. Gold stocks, because of their thin market, can be volatile both up and down. A reminder that in the March 2020 panic the TGD fell 41% then rallied 140% into the August 2020 top. So far, the low has been 296, representing about a 50% correction of the entire March/August rally. We continue to suspect this is a B-wave correction with a big C wave to come that should at least equal the length of the A wave of about 243 points. A June pullback low was seen at 290 so, ideally, we would like to see that level hold. Under 230 for the TGD would signal a complete reversal and possibly new lows. The TGD appears to be forming a wedge triangle here. A break above 330 would signal at least a rise back to 380. Above 380 would signal the start of a bigger rally that could have potential targets as high as 535.
The TGD appears to us to have fallen in an abcde-type corrective pattern. But again, we emphasize that we would like to see 290 hold. Below that would signal a deeper correction, possibly to around 260/270.
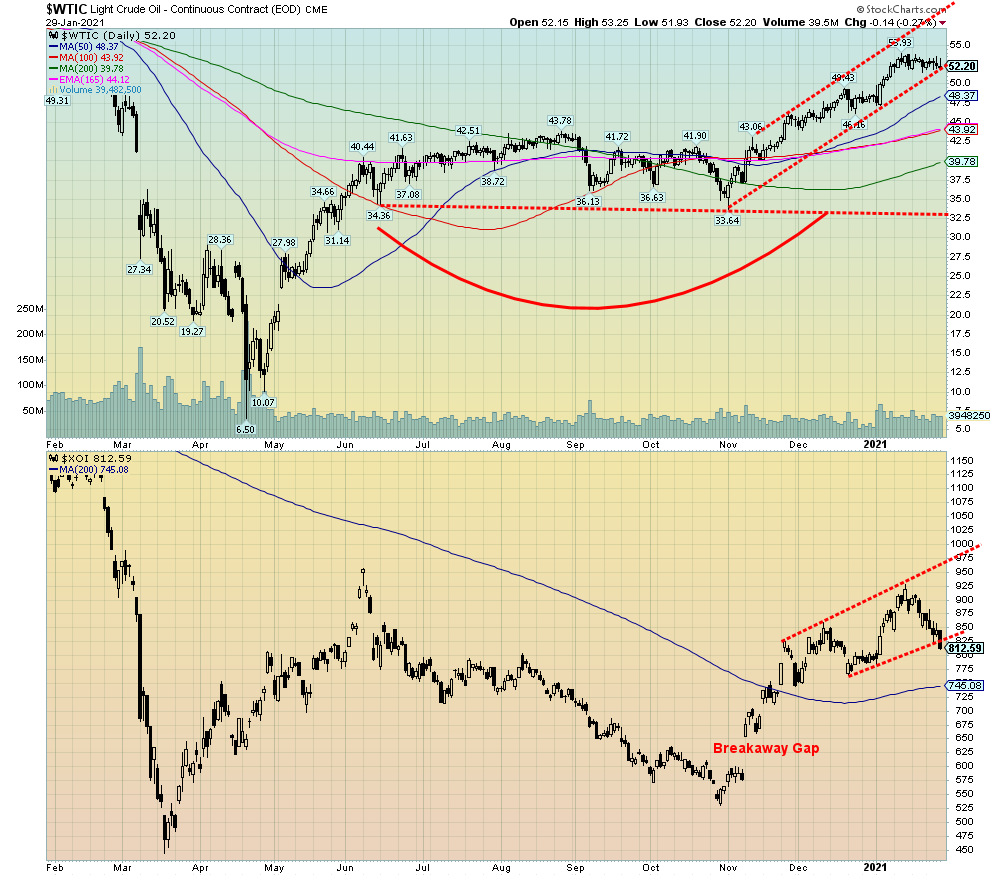
WTI oil started the month off jumping to its highest levels since a year ago March. The peak came on January 13 at $53.93. Since then, WTI oil has been trading in a relatively flat range. This past week WTI oil closed down a small 0.1% but remains up 7.6% on the year as it recorded a solid month to the upside. Natural gas (NG) which had been weak for most of the month jumped 4.1% this past week and is now up 0.8% on the year. The energy stocks, however, didn’t fare as well as the ARCA Oil & Gas Index (XOI) lost 7.1% while the TSX Energy Index (TEN) was off 5.4%. Are the energy stocks signaling that a high might be in?
Oil prices did take some solace from the roll-out of the vaccines. This past week Johnson & Johnson and Novavax added to the vaccines, raising hopes for even more supply. All of this is giving some buoyancy to the energy market to make up for what was a lost year in 2020. Still, the fact that oil and NG prices held up this past week but the stocks did not should be of some concern. If anything, the stocks often portend the direction of the commodity.
Production levels, after falling sharply in the first six months of 2020 did pick up a bit in the latter part of the year. As was widely expected, one of President Biden’s first acts was to cancel the Keystone pipeline project, one that former President Trump had pumped back to life. Biden also put the clamps on drilling on Federal lands, including the Alaska north shore, but again this was not something that was unexpected. The ban may also impact the Gulf of Mexico’s output. Altogether it is estimated it might cost the U.S. some 200,000 barrels of oil/day but untouched is still 11 million barrels/day of production. As many point out, the need for more oil coming through pipelines like Keystone is just not needed. The Gulf ban is logical given much of it is government owned. Overall, it is expected to have only minimal impact on the oil and gas industry.
Companies are still piling up losses as Chevron (CVX) reported a Q4 loss of $665 million. Chevron lost $5.5 billion in 2020. More results are expected into February. That’s not stopping the credit rating companies from putting oil companies on credit watch. Downgrades could be coming for a host of them, including Exxon (XOM), Shell (RDS.A), Chevron (CVX), and Total (TOT). Oil companies are also being pressured by shareholders and boards to get on board sustainability and the smart ones are shifting to greener pastures.
Technically, WTI oil has pulled back to an uptrend line A break of $51.75 could send WTI oil back to the rising 50-day MA near $48.40. A break of $46 would signal the end of the current rally. The XOI has broken down under its rising trend line, signaling a possible drop as well to its 50-day MA near 745. A breakdown under 712 would signal the end of the stock rally. The TEN is already under its 50-day MA at 93.10 and appears headed to major support between 80 and 85. The topping action on the TEN is clearer. The TEN could also be in the process of forming a potential head and shoulders top. Any rebound here that fails to rise above 98.50 could signal the formation of the right shoulder.
Energy prices are usually positive in the early part of the year through to about June. But last year was negatively impacted by the pandemic. If the variants take hold and pump up the numbers again resulting in more shutdowns, the oil rally could soon be over. The question is, are the energy stocks signaling that possibility?
—
(Featured image by Brett Jordan via Pexels)
DISCLAIMER: This article was written by a third party contributor and does not reflect the opinion of Born2Invest, its management, staff or its associates. Please review our disclaimer for more information.
This article may include forward-looking statements. These forward-looking statements generally are identified by the words “believe,” “project,” “estimate,” “become,” “plan,” “will,” and similar expressions. These forward-looking statements involve known and unknown risks as well as uncertainties, including those discussed in the following cautionary statements and elsewhere in this article and on this site. Although the Company may believe that its expectations are based on reasonable assumptions, the actual results that the Company may achieve may differ materially from any forward-looking statements, which reflect the opinions of the management of the Company only as of the date hereof. Additionally, please make sure to read these important disclosures.


Bitcoin Stalls Near $60K as Strategy Moves, ETFs Outflow, and EU MiCA Rules Take Effect
Bitcoin hovers near $60,000 with ETF outflows, while Strategy boosts reserves, sells BTC, and raises dividends to reassure investors. Ethereum...


Cannabis Dominates Global Drug Use: Trends, Risks, and Shifting Markets
Cannabis remains the world’s most widely used illicit drug, with 256 million users in 2024, surpassing all others combined. Growth...


Italy Approves First Hydrogen-Powered Train for National Rail Network
ANSFISA has approved Italy’s first hydrogen-powered train, the Alstom HMU214, for use on the Brescia–Iseo–Edolo line. Capable of 140 km/h,...


Cotton Market Weakness Persists Despite Brief Rebound
Cotton prices fell to new lows last week before a modest rebound. USDA data shows crop conditions remain worse than...


Eli Lilly Hits $1 Trillion Valuation Amid Strong Bullish Momentum
Eli Lilly stock hit a record high, surpassing $1 trillion market value after strong product demand. Shares surged over 7%,...
 |
|
 |  |
 |
|
-

 Africa1 week ago
Moroccan Bond Market Shows Mixed Signals as Primary Eases and Secondary Pressures Persist
-

 Markets2 weeks ago
Corn Prices Slip Amid Strong Crop Conditions and Favorable Weather
-

 Fintech6 days ago
Talentir Secures €4M to Transform Global Payouts
-

 Cannabis2 weeks ago
WNBA Removes Cannabis From Banned Substances List in New CBA