Business
Rising Rates to Crash the Overleveraged Economy
We often hear that the American consumer and corporations are in much better shape due to the amount of deleveraging that has taken place. Hence, they claim, it is simply a much better environment for the economy to tolerate those rising interest rates. However, total US debt to GDP was 775% in 2018. In 2022 it has soared to 810% and is currently extremely high relative to historical levels.
The effective overnight interbank lending rate is now 3.08%. It was just 0% a little over six months ago. According to the Fed’s current plans, the Fed Funds Rate (FFR) is heading to at least 4% by the end of this year; and perhaps all the way to 4.5-5% by early 2023. Is that going to cause a problem you ask? Well, rising rates have already caused stocks, bonds, gold, crypto–and just about everything else–to plunge. Even the commodity sector, which worked well in the first half of this year has fallen sharply. Indeed, virtually nothing has worked on the long side except for cash and the USD. Sadly, for most, the carnage isn’t over yet and the pace of the decline is only going to intensify. Here’s why that should be the case.
The previous cyclical high-water-mark for the FFR was 2.5%. It occurred back in December of 2018. Powell and company are now threatening to nearly double the same borrowing rate that broke the economy four years ago.
Likewise, the cyclical high for the Benchmark U.S. Treasury yield was 3.22% in November of 2018. It stands at 3.8% as of this writing. A 2.5% FFR and 3.22% 10-year Note were the rates that proved to be just too great for the economy and markets to bear in 2018. The debt burden back then was just too onerous to withstand those higher borrowing costs. In addition, asset prices were so overextended that the competition offered from fixed income caused investors to dump riskier stocks and flee to the relative safety of government bonds.
As a matter of fact, the level of borrowing costs it takes to break the economy has been reduced over time, just as the level of economic fragility has increased. It took a FFR of 6.5% to break the NASDAQ bubble in 2000. It was a slightly lower FFR of 5.25% that ended up collapsing the Housing bubble of 2006. In 2018, the FFR was inched up to just 2.5% over the course of three years; but that was all it took for the economy and markets to falter.
The facts show that the economic conditions extant in 2018 placed it in a much better position to handle rising borrowing costs than what we see today. What is completely ridiculous is that the Fed has the temerity to bloviate about a soft landing for the economy during this current cycle of monetary tightening; even though the economic scenario is much worse that it was four years ago. And, of course, Wall Street is promulgating the Fed’s soft-landing myth with alacrity.
Let’s take a closer look at the debt burdens, asset price levels and GDP growth in 2018 and compare that data to the situation today.
GDP growth back in 2018 displayed a rather healthy reading of 2.9% for the full year. Economic growth so far in 2022 has come in at SAAR of -1.6% for Q1, -0.6% for Q2 and the consensus estimates for Q3 are below 1%. In essence, the economy is much weaker today that it was in 2018.
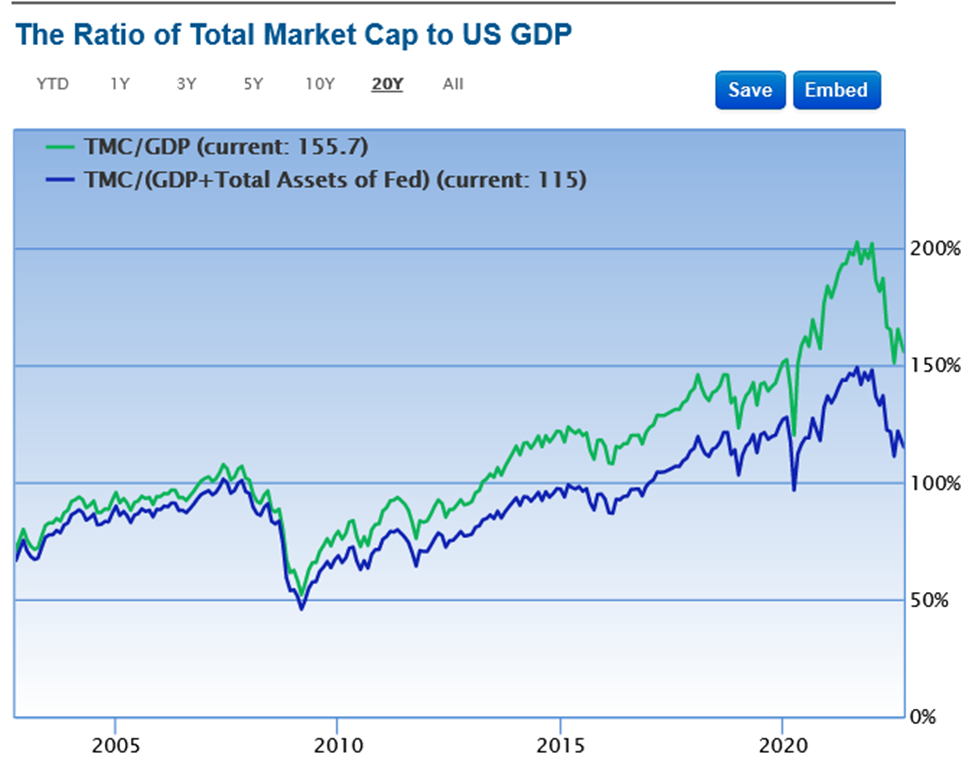
Despite the carnage we have witnessed so far this year in the equity market, the valuation of stocks compared to underlying economy is still greater today than it was four years ago. The TMC/GDP was 123% at the end of 2018, today it stands at 145%.
We often hear that the American consumer and corporations are in much better shape due to the amount of deleveraging that has taken place. Hence, they claim, it is simply a much better environment for the economy to tolerate those rising interest rates.
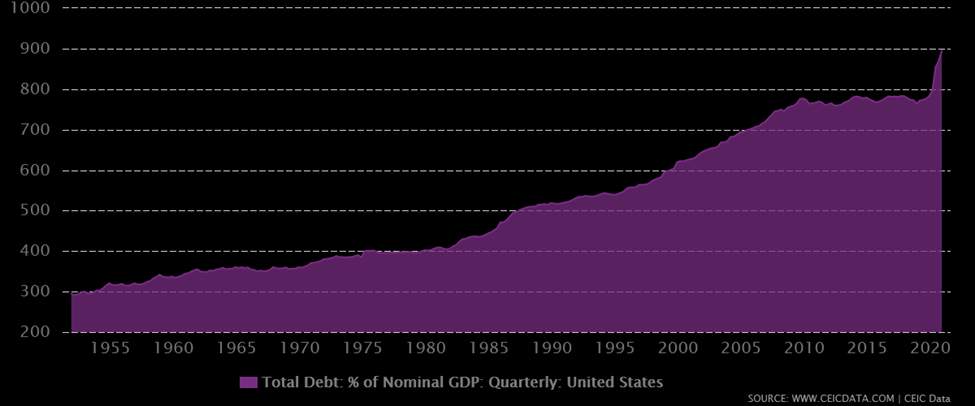
However, total US debt to GDP was 775% in 2018. In 2022 it has soared to 810% and is currently extremely high relative to historical levels.
Total US Debt/GPD
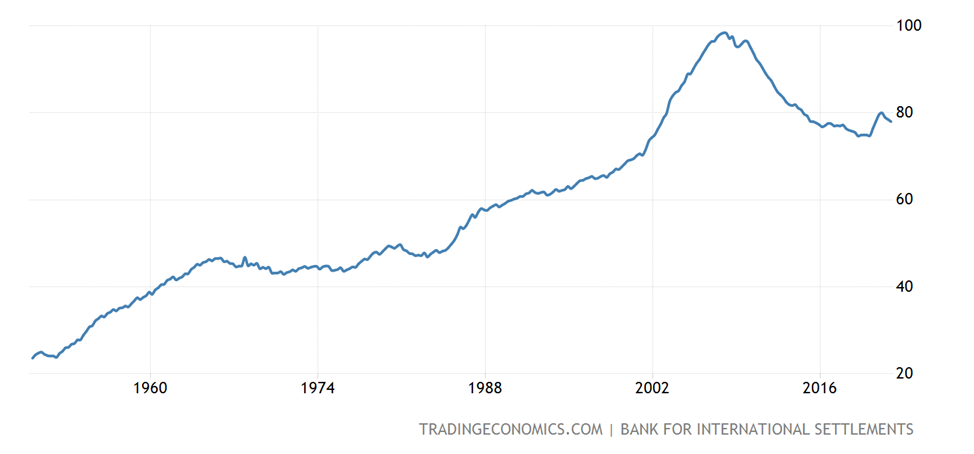
But it’s not just sovereign debt that has exploded higher. Household debt was $15.6 trillion at the end of 2018. It has jumped by over $3 trillion since then. While it is true that Household debt as a percentage of GDP is off its highs set it the Great Recession of 2008, this ratio is still higher than it was in 2018. And, it is far greater than it was prior to the Fed’s massive interest rate suppression regime beginning in the year 2000.
Household Debt to GDP Ratio
The corporate debt to GDP ratio is higher than at any other time in history prior to the COVID pandemic. Non-financial Corporate Business Debt/GDP was 45% in 2018. As of Q2 2022 this ratio stands at over 50%. For historical reference, this ratio topped out at 45% at the peak of the NASDAQ bubble in 2000 and also in the Real Estate/Great Recession bubble in 2008.
There just is no evidence that the economy has gone through any deleveraging at all since 2018. Indeed, the nominal levels of debt have skyrocketed. Most importantly, this debt is extremely high even when measured as a percentage of the QE and ZIRP-juiced economy. Hence, there is no reason to believe that either the public or private sectors will be able to withstand the onslaught of spiking borrowing costs and monetary destruction that are happening now.
The only other time in history the Fed was raising the FFR and in the act of QT was in 2018. The market went into freefall; until Powell promised to stop raising interest rates.
Today we find that the FFR is more than 50 bps higher than in 2018 and is quickly heading much higher. In addition, the Benchmark 10-year Note yield is also about 50bps greater than the cycle high of four years ago. The other significant difference between 2018 and 2022 is inflation. It was simply much easier for the Fed to come to the rescue of asset prices and the economy when inflation was below 2%–it was only 1.9% at the end of 2018. However, when the CPI is near a 40-year high, such a pivot becomes untenable.
Higher interest rates offered by US Treasuries are providing a great alternative for stocks. And, higher corporate borrowing costs are also destroying margins and revenues for these businesses. Sharply declining consumer demand from a faltering economy is adding to the pressure. Throw in a skyrocketing USD, and odds are corporate earnings are not only going to fall well short of the 8% growth forecasted by Wall Street for 2023; but will instead end up posting a negative number.
Ironically, the economic data has been mostly unalarming—at least for now. With the exception of GDP, which Wall Street claims is only a temporary quirk in the data. Just ask any perma-bull and they will tell you that job market, consumers and corporate earnings are still very strong and can withstand this hawkish Fed. Nevertheless, the truth is the economy and markets have never been more fragile. Therefore, the upcoming economic and earnings recession should be profoundly acute.
__
(Featured image by Matthias Groeneveld via Pexels)
This article may include forward-looking statements. These forward-looking statements generally are identified by the words “believe,” “project,” “estimate,” “become,” “plan,” “will,” and similar expressions. These forward-looking statements involve known and unknown risks as well as uncertainties, including those discussed in the following cautionary statements and elsewhere in this article and on this site. Although the Company may believe that its expectations are based on reasonable assumptions, the actual results that the Company may achieve may differ materially from any forward-looking statements, which reflect the opinions of the management of the Company only as of the date hereof. Additionally, please make sure to read these important disclosures.


Blockchain Evolves Toward AI, Finance and Quantum Security
Blockchain is evolving beyond crypto into finance, AI applications, and digital markets, while security and regulation remain challenges. Quantum threats...


The Italian Crowdinvesting Market Faces Sharp Decline in 2026
Italian crowdinvesting market continued to decline in 2026, with fundraising falling 36.8% year-on-year to €164.19 million. Platforms and active campaigns...


Sartorius Stedim Biotech Maintains Growth Momentum in H1 2026
Sartorius Stedim Biotech reported solid H1 2026 results, with revenue reaching €1.527 billion and EBITDA rising to €479 million. Growth...


Bank of Africa Launches BOA MDM Network to Boost Diaspora Investment in Morocco
Bank of Africa launched the BOA MDM Network to channel diaspora remittances into productive investment, aiming to raise their share...


Switzerland’s Medical Cannabis Reform Advances Access, But Barriers Remain
Switzerland’s 2022 medical cannabis reform improved patient access by removing federal approval requirements, but challenges remain. MEDCAN highlights barriers including...
 |
|
 |  |
 |
|
-
 Markets2 weeks ago
Quiet Markets Await a Catalyst as Jobs and Oil Support Sentiment
-
 Crypto1 day ago
Bitcoin ETFs Lead as German Stock Exchange Debuts Mining ETF
-

 Crowdfunding1 week ago
Insight Foto Festival Launches €4,500 Crowdfunding Campaign to Support 2026 Edition
-

 Business4 days ago
Dow Jones’ Record Run Faces Early Signs of Potential Shift