Featured
Are there any risks to making a Bitcoin investment?
As Bitcoin prices become steeply inflated, the potential for collapse is inevitable.
The Bitcoin bubble looks a lot like the internet bubble that inflated in the final phase—the orgasm—the great tech bubble of December 1994 into March 2000. It crashed faster and harder than the Nasdaq bubble—down 93 percent compared to 78 percent. It was also a leading indicator for the Nasdaq crash as it only retested its January high rather than exceeding it.
The internet bubble went up 7.5 times in just 16 months. At close to $20,000, Bitcoin has gone up 14.8 times in just eight months.
That’s twice as high in half the time!
It’s now the steepest and most extreme bubble of all time. Literally. It’s even surpassed the infamous tulip bubble of the 1630s, which is similar to the Bitcoin bubble because it too had little against which to measure any real value.
At least we could calculate the price-to-earnings ratio on the Nasdaq or AOL. But there’s no measure of valuation on these digital coins. So, like tulips, its price is only a function of what people are willing to pay.
It’s not all totally speculative though. There are two tools we can use to try to get some handle on this extreme bubble.
The first comes from the lost chapter of my “Sale of a Lifetime” book.
The most important calculation for estimating the downside of a bubble, even before it peaks, is the bubble origin. But that’s not the last major low. Instead, it’s the point at which the market starts to diverge from the fundamental trends.
Look at the Bitcoin chart:
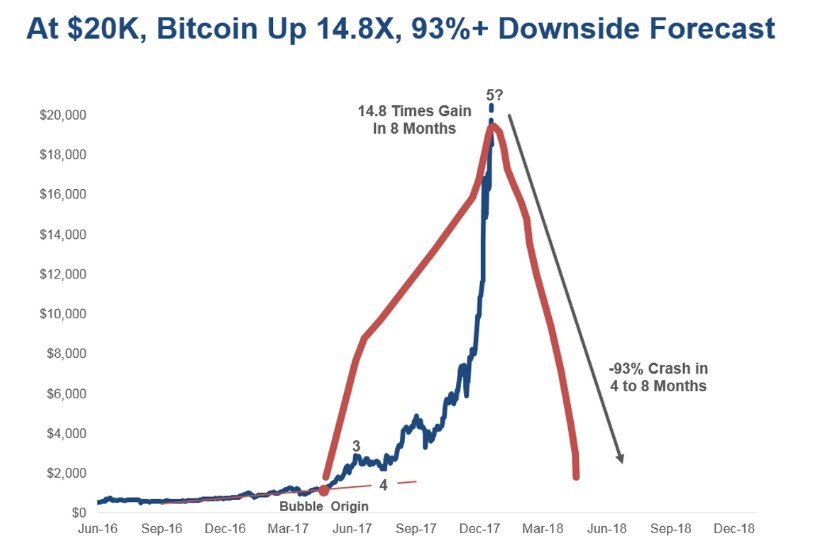
© Harry Dent
The bubble origin for Bitcoin was at $1,355 on April 24, 2017.
That means that, from the most recent high of $19,395 (at least at time of writing), this bubble could shed 93% to return to that point of origin, which is what bubbles typically do when they burst.
That’s a massacre!
As an aside, Ethereum’s bubble origin was at $51. It has had similar gains to Bitcoin, reaching 14.4 times gain at its recent highs. A crash from $733 would represent the same 93% downside.
And the higher the highs get, in both Bitcoin and Ethereum, the more devastating the collapse will be.
The second tool with which to get a handle on this bubble is Elliott Wave patterns (which I’ve marked up on the chart above as well).
The first surge or Wave 1 peaked on November 30, 2013 at $1,082 (note that is not shown on the chart but was a clear first peak).
The second wave correction bottomed at $203 on January 14, 2015 (also not shown on the chart).
The middle and steeper surge or Wave 3 peaked at $2,840 on June 9, 2017.
The fourth wave correction, into $2,162 on July 17, 2017, marked the best place to buy into the most powerful fifth wave bubble, which we are currently experiencing. Gains since then have been a whopping nine-fold!
At this point, it’s far too late in this bubble to get in. Don’t worry, there are plenty of other opportunities out there and, once this Bitcoin bubble has burst, you’ll have a second chance to invest (although it’s unlikely we’ll see highs like this as quickly the next go around).
The most important question now is: When do you get out?
I suggest setting a stop loss level just below the trendline of higher lows, at $16,500. That’s about 20% below that $20,000 mark.
All bubbles burst with mind-numbing swiftness, so if you’re going to stick with your Bitcoin investment to ride along for any potential future gains, at the very least, make sure you have an exit strategy.
—
DISCLAIMER: This article expresses my own ideas and opinions. Any information I have shared are from sources that I believe to be reliable and accurate. I did not receive any financial compensation in writing this post, nor do I own any shares in any company I’ve mentioned. I encourage any reader to do their own diligent research first before making any investment decisions.


XRP Under Pressure Amid Macro Forces, Fed Policy, and Regulatory Shifts
XRP remains under pressure despite easing geopolitical tensions, as macroeconomic factors and Fed policy dominate market sentiment. Liquidations and high...


Edison Accelerates Renewable Growth and ESG Impact in 2025
Edison reports strong 2025 sustainability progress, boosting renewable investments by 90% to reach 2.3 GW toward a 4 GW 2030...


New Gene Therapies Transform Rare Disease Care, but Gaps Remain
Gene therapies are transforming rare disease treatment, enabling normal lives for some patients. However, only about 6% of 7,000 rare...


Temotiva Launches Crowdfunding Campaign to Advance Preventive Mental Health
Temotiva Innovación Lab has launched a crowdfunding campaign through Santander X Explorer, marking a new phase for the University of...


Fed Policy Shift Raises Concerns Over Debt and Inflation Risks
The Federal Reserve is criticized for resuming balance sheet expansion through Treasury purchases despite expectations of tighter policy under new...
 |
|
 |  |
 |
|
-

 Crypto5 days ago
Bitcoin and Ethereum Markets Steady as Strategy and Bitmine Expand Holdings Amid World Cup Crypto Activity
-

 Impact Investing2 weeks ago
Transition to a Sustainable Economy as a Strategic Global Shift in a Fragmented World
-
 Crowdfunding3 days ago
Temotiva Launches Crowdfunding Campaign to Advance Preventive Mental Health
-

 Impact Investing1 week ago
Eni Advances Energy Transition with Major Investment and Emissions Cuts
You must be logged in to post a comment Login