Markets
The Silver to Gold Ratio: XAU’s Last All-Time High Was in April 2011
Silver was up a little more than 1% for the week, but is advancing like an old man walking up a hill. That is something that I can personally attest to, being something not very impressive. But I like the gold and silver miners in the XAU, they were up 5.81% from last week. If money is beginning to flow into the gold and silver miners, it won’t take much to move the XAU much higher.
This week, the Dow Jones made its 24th BEV Zero (new all-time high) of its current advance into market history, beginning last December 13th, when the Dow Jones made its 1st BEV Zero of this advance. Since this advance into market history began some three months ago, the farthest the Dow Jones had deflated from any of these 24 BEV Zeros was -1.40%, on March 5th. This can be seen in the BEV chart below, how for the past three months, the Dow Jones’ BEV plot has refused to stray far from its red BEV 0.00% line, as the Dow Jones itself has advanced 3,229 points into market history.
For good or bad, this is a market that wants to go up. How could an advancing stock market be bad? If the money pouring into it is coming from the Federal Reserve, pumping monetary inflation into it – ultimately that will be bad when their bubble pops.
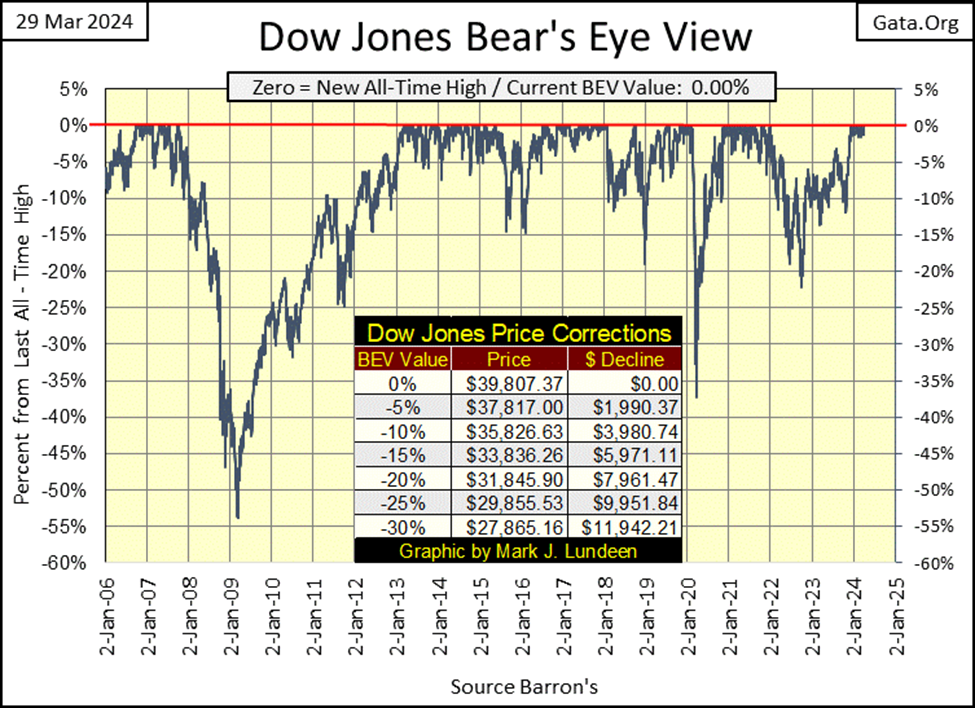
How much more of this, in terms of points and of time can be expected? I’m not the guy to answer that question, except to say possibly longer than you and I could believe possible, and then maybe it could end next week. I will say this with some certainty; as long as daily volatility for the Dow Jones remains low, this advance should continue.
Another way of saying that is, as soon as Dow Jones 2% Days, days of extreme market volatility, days the Dow Jones moves up or down in excess of 2% from its previous trading day’s close become frequent market events, I’m going to then assume this advance is over.
The Dow Jones’ BEV plot above should then decline below scoring position (BEVs of -0.01% to -4.99% – less than 5% from a new all-time high). Soon after that, we should see the Dow Jones break below its BEV -5% line, and then sink into deeper BEV levels in the chart above. Or so that is how I believe this advance will terminate.
Being Easter Week, the financial markets had only four trading days, but the week ended strongly on Wednesday and Thursday, as seen by the many BEV Zeros in my table of major-market indexes’ BEV values below. The NASDAQ Bank Index (#20) is advancing, but that doesn’t mean the banks have become more viable since last May, when their BEV values fell below their BEV -50% level; losing half of their market valuation since their last all-time high of late 2021.
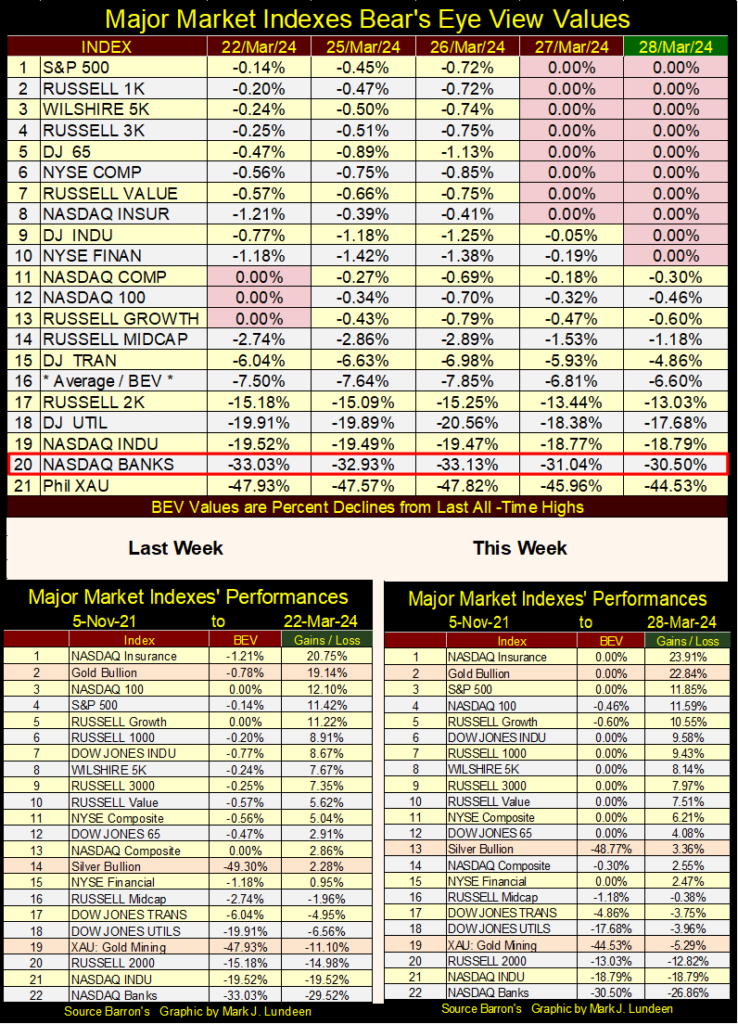
Gold in the performance tables above remains in the #2 spot, and has been there for a while, closing the week 22.84% higher than it did on 05 November 2021. At this week’s close, gold also closed at a new all-time high for the day, week, month and quarter. For those who stare at charts for a living, you can be sure they’ve noticed this.
Silver (#13) was up a little more than 1% for the week, but is advancing like an old man walking up a hill. That is something that I can personally attest to, being something not very impressive. But I like the gold and silver miners in the XAU (#19), they were up 5.81% from last week. If money is beginning to flow into the gold and silver miners, it won’t take much to move the XAU much higher in these performance tables, something I believe is going to happen this year.
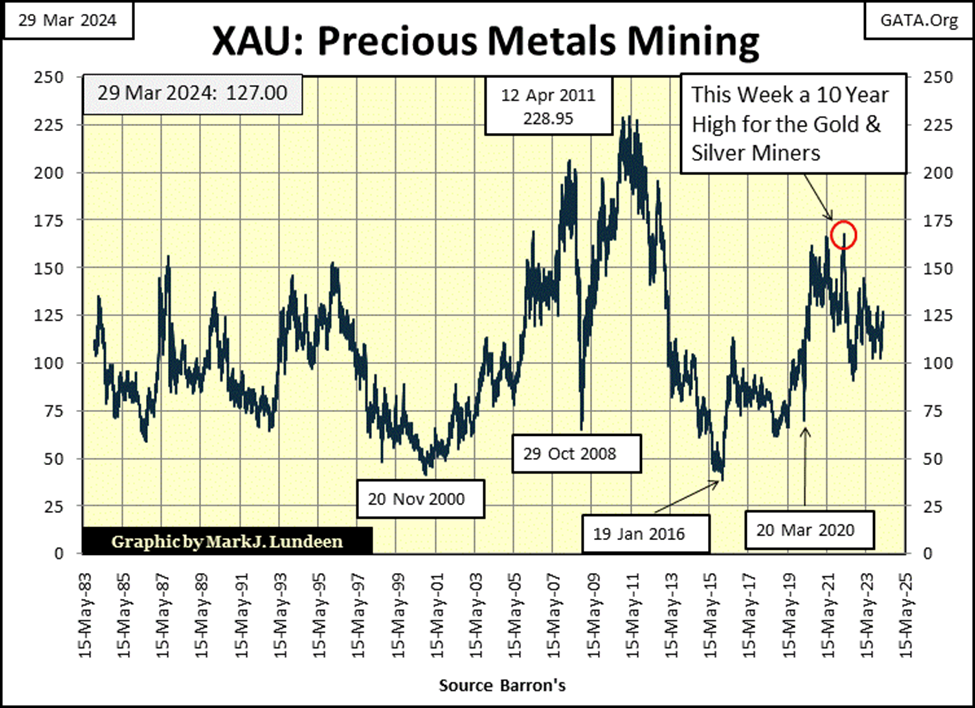
The XAU’s last all-time high was in April 2011; thirteen years ago. Following that, the XAU descended into massive 83.40% bear-market valuation collapse in January 2016, making the gold and silver miners to this day, about as popular with managed money as a loathsome disease. I’m not kidding, looking at the Barron’s Gold Mining Index’s BEV chart below, a chart that goes back to 1920, the April 2011 to January 2016 bear market (Box C) was the deepest bear market decline the BGMI had seen in the past 100 years.
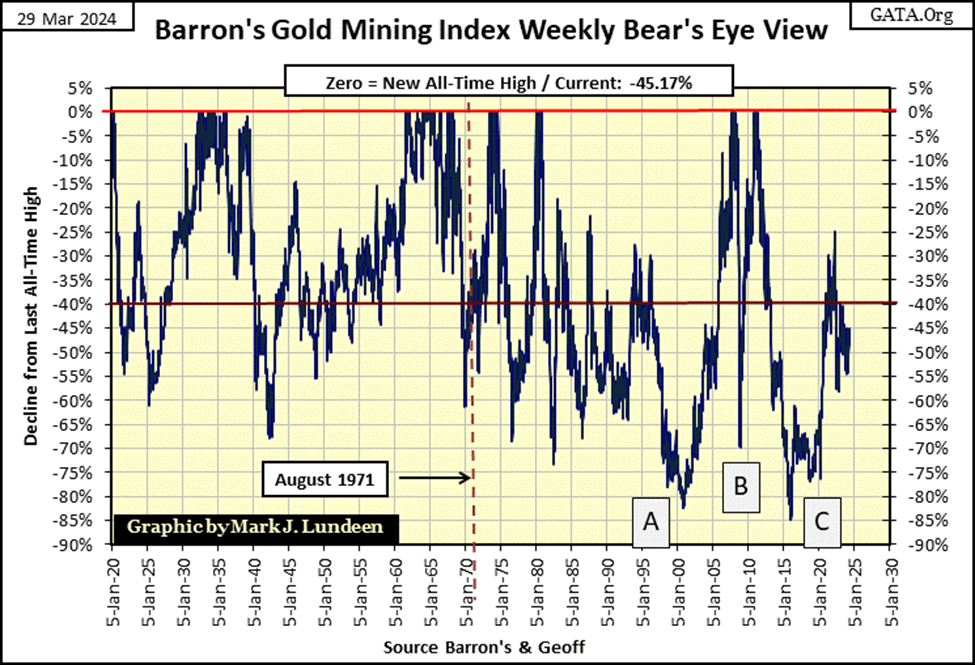
How can this be good? It means the gold and silver mining industry is priced at rock bottom valuations, which is when savvy investors want to buy.
Since its very hard bottom in January 2016, the XAU, and other gold and silver mining indexes have recovered some. Two years ago, the XAU almost broke above 175, just before it did break below 100. Today it closed above 125, making 150 the next level for the bulls to take these miners to. In a good market, this could happen by June. It’s time the bulls in the gold and silver mining sector, spread their tiny wings – and once again begin to fly.
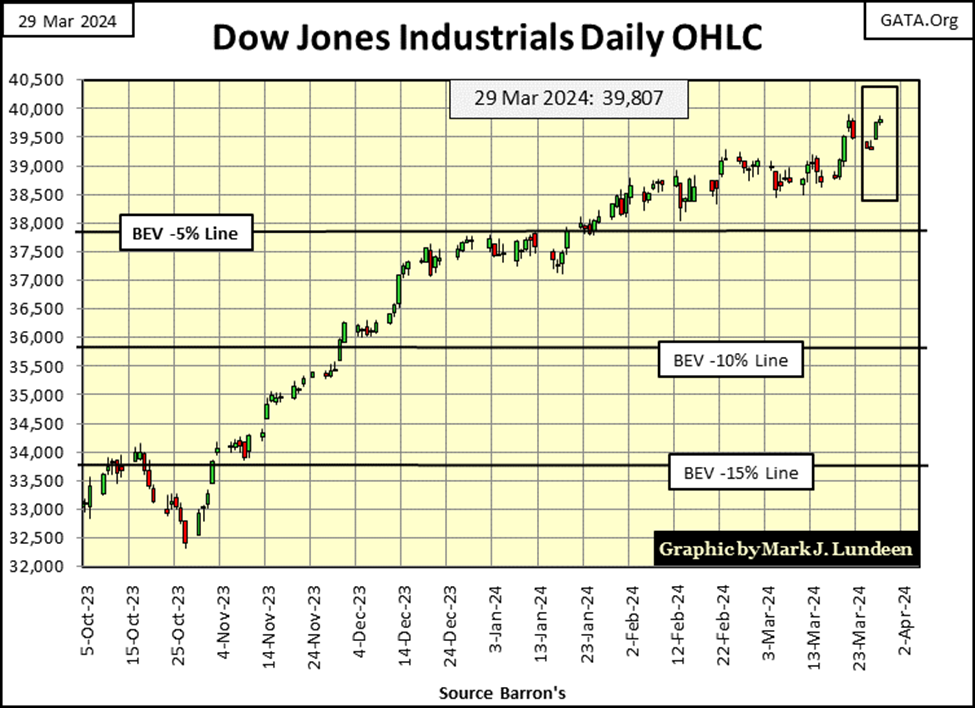
The Dow Jones in its daily bar chart below is looking good. Dow Jones closing above 40,000 by the close of next week? At the close of this week, it was only 193 points away from doing exactly that. It would be a very easy jump for the Dow Jones to close above 40,000 next week.
Let me think about this;
- The Dow Jones has been advancing in the chart below since October 2023,
- No big Dow Jones 2% days, days of extreme market volatility,
- No NYSE 70% A-D days, days of extreme market breadth.
Considering the above, I expect we’ll soon see the Dow Jones closing over 40,000 very soon, if not by next week.
Let’s look at gold’s BEV chart. At Thursday and Friday’s close, gold closed at a new all-time high, the 10th and 11th of the current advance. Gold has been in scoring position since mid-November, which motivated me to say gold was advancing. But for the first three months of this advance, gold had only two new all-time highs to show for it. Then came March, during which gold made nine new BEV Zeros in its BEV chart below. I’m hoping April will be as generous to the bulls as March was.
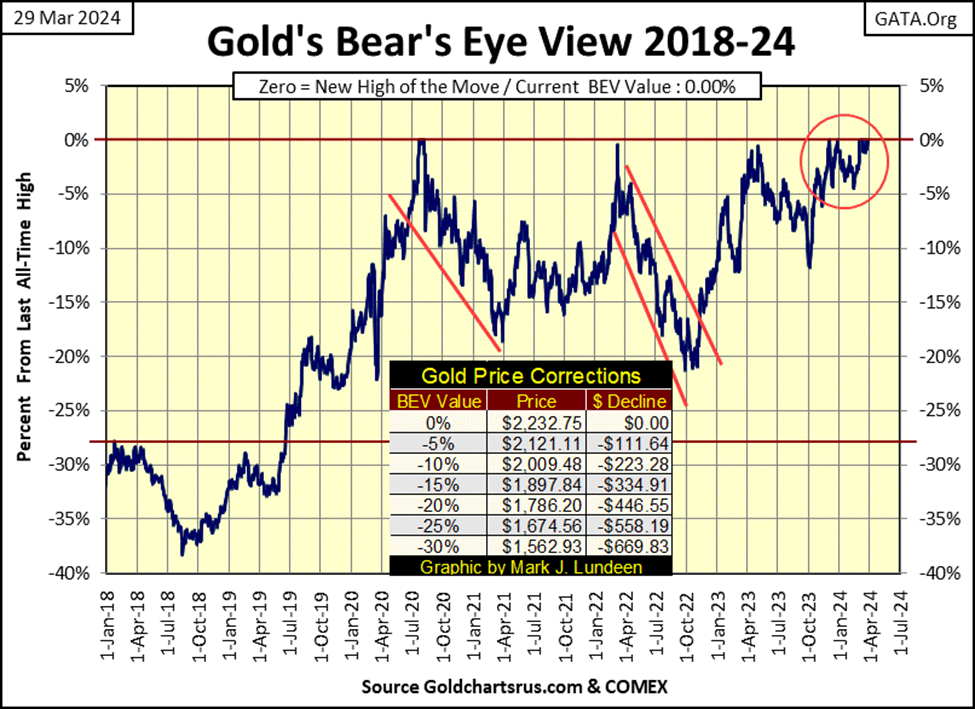
Moving on to my chart of indexed values for gold and silver below, against my better judgement, last week I predicted gold would break above its 55.0 line ($2400) by the end of August. Last Friday, gold was at 49.78 ($2165.5). In the four trading days since, gold advanced $67.25, closing the week at 51.33 ($2,232.75), only $167.25 from $2,400. So far, so good.
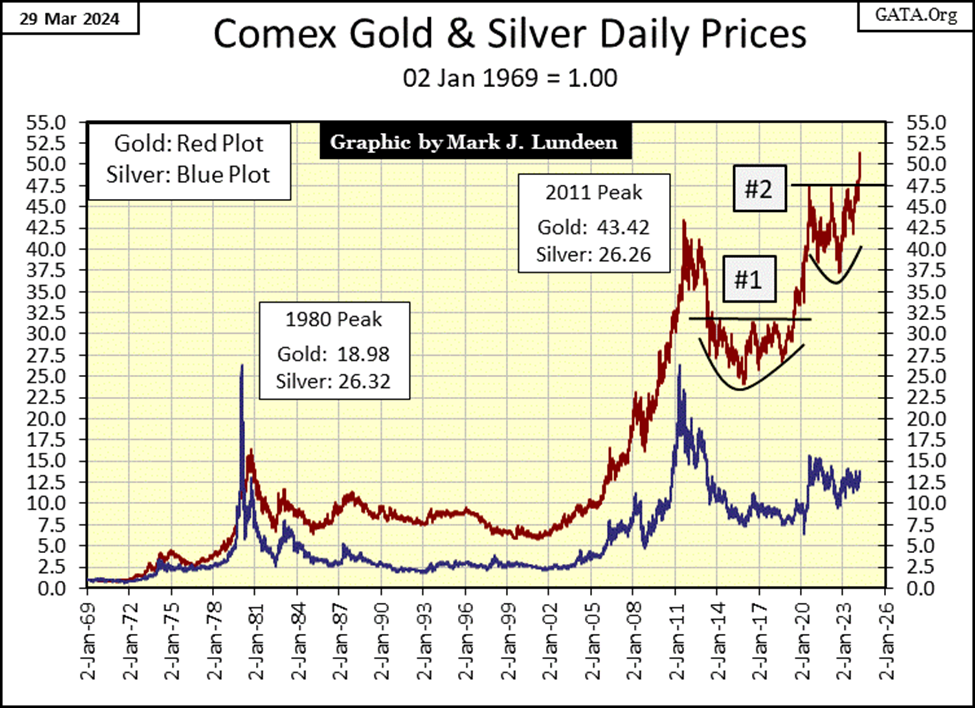
As far as silver goes, I’m not going to get excited until it breaks above its 17.5 level ($32.50). I’m not going to set a time for that to happen, but it would be nice seeing silver close above its 15 level ($27.80) sometime in the next few weeks. Will it? Like I said, it would be nice if it did. Should gold continue advancing as it has all this month, it could light a fire beneath the silver market.
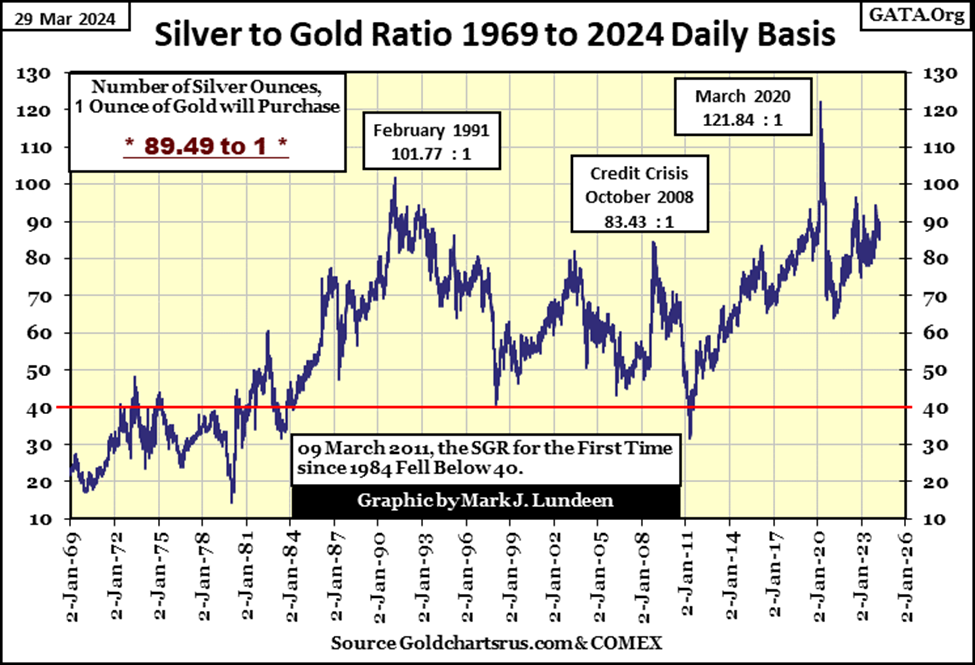
Let’s look at the Silver to Gold Ratio (SGR), also known as the Gold to Silver Ratio (GSR) for reasons I don’t understand, as either way, this ratio is always looking at how many ounces of silver one ounce of gold can purchase. This week closed with the SGR at 89.49 ounces of silver / 1 ounce of gold. So what?
Well, during the gold standard, a $20 gold double-eagle could be exchanged for twenty silver dollars at a bank, and twenty silver dollars could purchase anything a single $20 gold double-eagle could. Why was this ratio of 20 to 1 set in US coinage before 1913? It seems in Earth’s crust, that is the approximate ratio of silver to gold to be found there. Though that will vary from place to place, and from one precious metal ore body to another. So, why since 1971 has the SGR in the chart below spent so little time at around its 20 level?
I would argue the US Government got involved managing the price of silver, and have been for a long time. Here is a quote from then President Johnson on removing silver from US coinage in 1965;
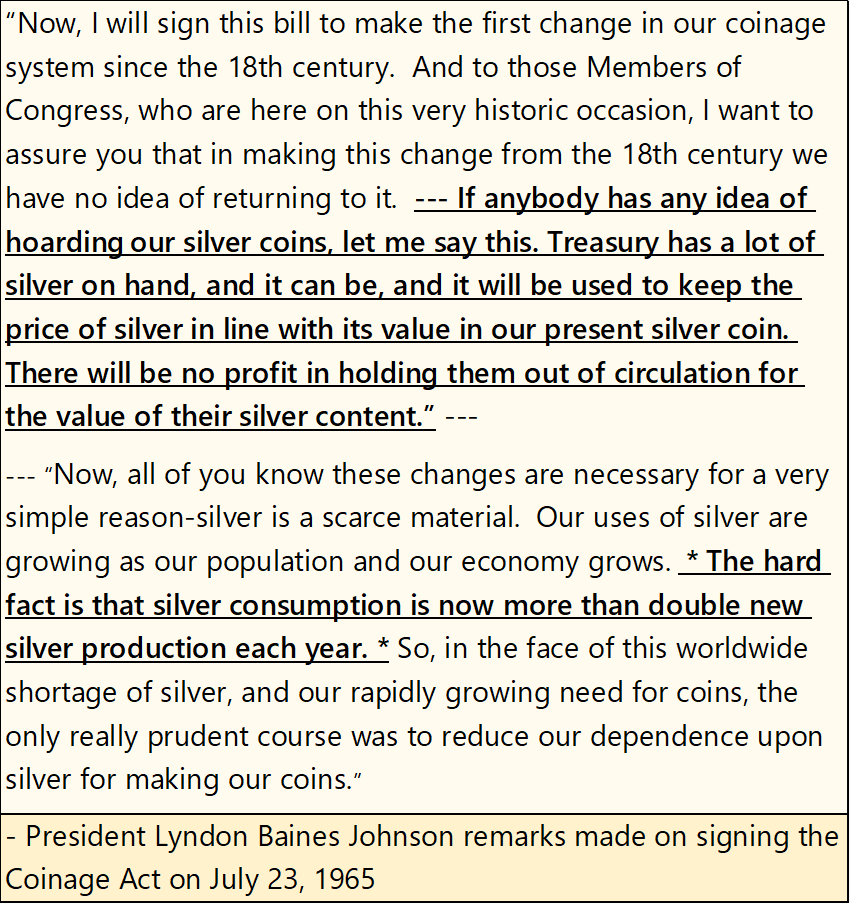
President Johnson talked about the supply of silver becoming critical as the reason for eliminating silver from US coinage. And he threatened to use the billions of ounces of silver then in the government’s possession, to keep the price of silver down, a silver reserve that was totally depleted, down to zero ounces in 2011.
But he didn’t mention what was probably the biggest reason for demonetizing silver in 1965. In 1934 the Federal Government removed gold from its “monetary system.” Thirty-one years later they also removed silver from US coinage, and for the same reason: precious metal coinage inhibited paper-dollar inflation, paper money “injected” into circulation far above what a precious metals monetary system would allow.
If the US Treasury still minted $20 gold coins, and silver dollars for economic use, coins to be carried and spent as we do paper money today, we would not today be talking about the Dow Jones breaking above 40,000 in the weeks to come.
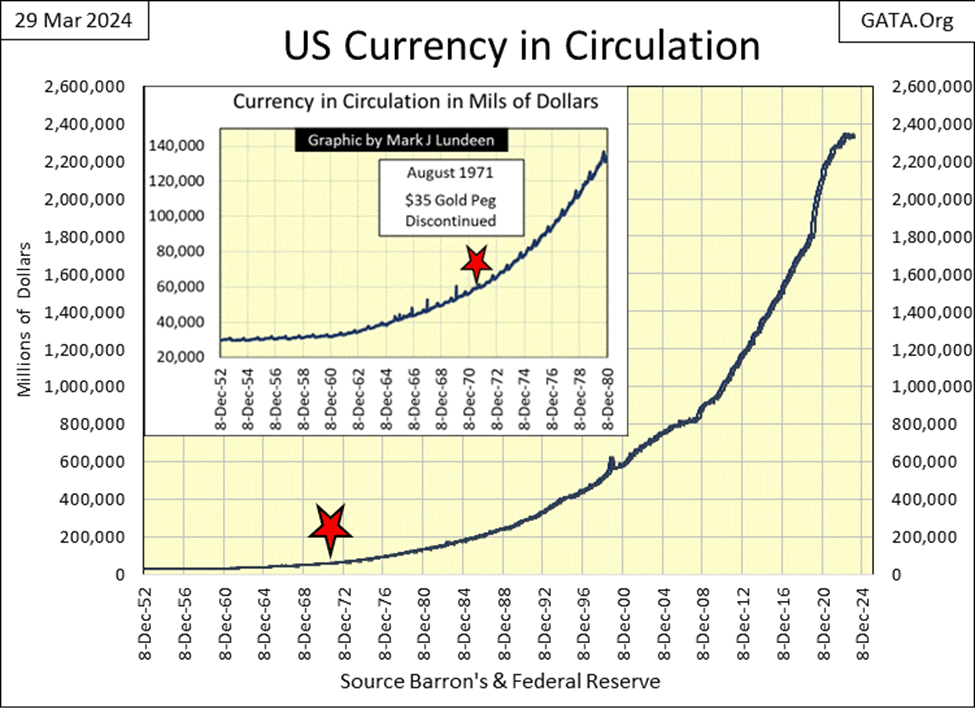
In the chart below plotting US Currency in Circulation (CinC), when President Johnson made this address to Congress on demonetizing silver, US CinC was around 50 billion dollars. At this week’s close, CinC was at 2,342 billion dollars. Had gold and silver remained in the monetary system, this massive inflation in paper dollars (digital dollars too) would not have been possible, so they got rid of gold and silver coins.
Note in the SGR chart above, in the late 1960s to the first years of the 1970s, the SGR never strayed far from 20. But since August 1971, when US “policy makers” took the dollar off the Bretton Woods $35 gold peg, the SGR has strayed far from 20, and most likely because of official sector price manipulation in the silver market, to do what President Johnson promised; to keep the price of silver low, and speculation in the silver market unprofitable.
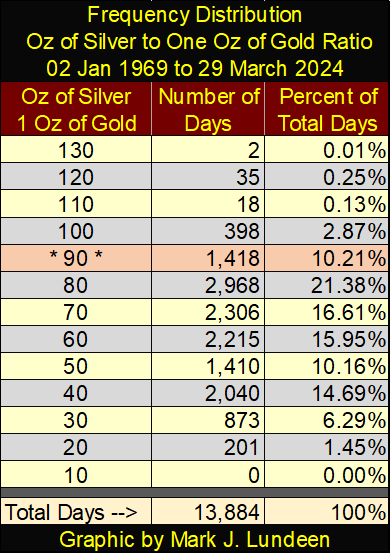
Below is a frequency distribution table for the SGR. Since January 1969, the SGR has been around its 20 level for only 201 trading days, of the total 13,884 plotted, or only 1.45% of the trading days for the past fifty-five years. There is something very wrong with that, or so it seems to me.
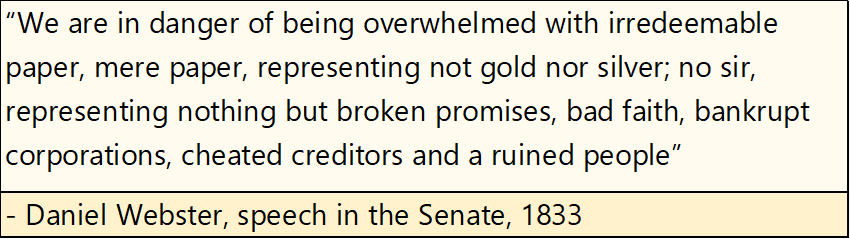
Few people care about that today, but someday they will. Below are comments from Daniel Webster from the early 19th century in the US Senate. Bankrupt corporations? A ruined people? That is the history of paper money inflation, and early in the 19th century, Senator Webster and most people knew that too. That “educated people” don’t today, says much about our “system of education.”
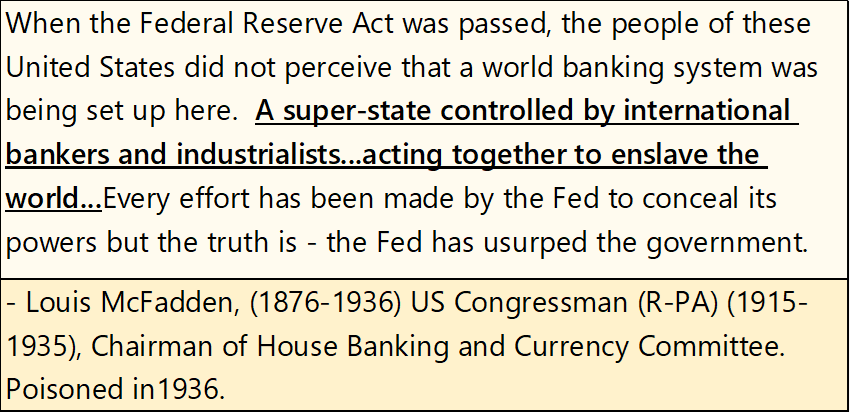
This has been going on for a long time. Here is a quote from by Representative Louis Mc Fadden (R-Pa), chairman of House Banking and Currency Committee. He died from poison in 1936.
That is something to think about as the stock market rises into market history, after over 100 years of monetary inflation via the Federal Reserve System. When this bubble pops, and Daniel Webster’s bankrupt corporations and ruined population become fully manifest, will the NYSE still function as it had before?
Gold in its step sum table below is looking good. It was overbought in early March, as seen by its 15-count rising to a +9. Markets don’t like being overbought, so some down days followed, and gold’s 15-count declined to a neutral +3 at the close of this week. No matter, gold was still making new all-time highs (BEV Zeros) following those down days.
This is a strong market, something gold hasn’t seen for quite a while. Can gold keep it up? Like me, you are going to have to wait to see if it does, but I’m going to remain positive, and believe it will.
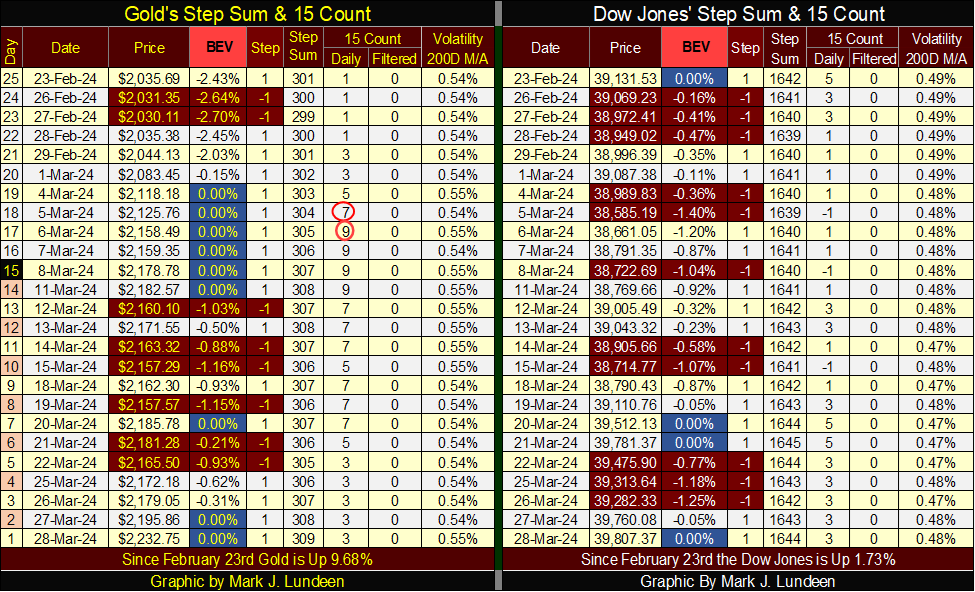
On the Dow Jones side of the table, it too remains strong, though BEV Zeros (the blue boxes) aren’t coming as fast and furiously as before. But that could change quickly in the weeks to come.
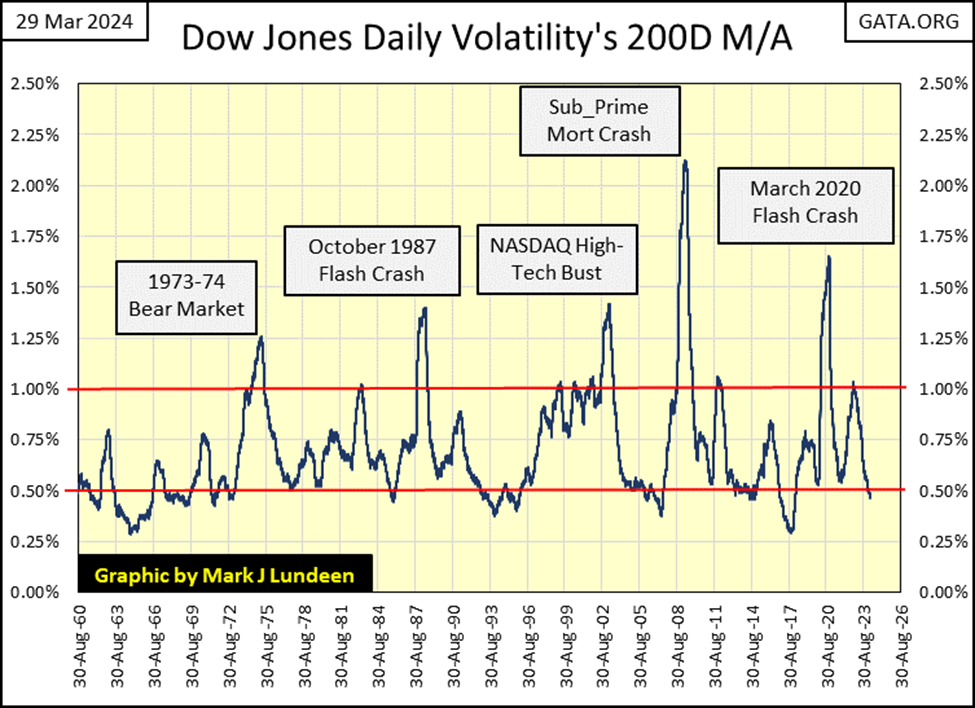
I see the Dow Jones daily volatility’s 200D M/A is having problems keeping at 0.47%. Will this advance see a 0.46%, and lower in daily volatility? Maybe, but I don’t think it matters, as seen in the Dow Jones daily volatility chart below; 0.48% indicates the stock market is approaching an ultimate market top. What follows that won’t be good for the bulls when this plot reverses, and trends towards, and then rises above 1.00%.
Given the choice between the gold and silver mining sector, gold and silver bullion, or the broad stock market, from what I can see in these two markets; unloved, and under owned gold miners and precious metal bullion is the place to be in 2024. I’m assuming we’re all adults here, so you make up your own mind.
__
(Featured image by Zlaťáky.cz via Unsplash)
DISCLAIMER: This article was written by a third party contributor and does not reflect the opinion of Born2Invest, its management, staff or its associates. Please review our disclaimer for more information.
This article may include forward-looking statements. These forward-looking statements generally are identified by the words “believe,” “project,” “estimate,” “become,” “plan,” “will,” and similar expressions. These forward-looking statements involve known and unknown risks as well as uncertainties, including those discussed in the following cautionary statements and elsewhere in this article and on this site. Although the Company may believe that its expectations are based on reasonable assumptions, the actual results that the Company may achieve may differ materially from any forward-looking statements, which reflect the opinions of the management of the Company only as of the date hereof. Additionally, please make sure to read these important disclosures.


Germany’s Cannabis Clubs Enter New Phase as Legal Harvests Begin
Germany’s cannabis legalization is entering a practical phase as cultivation associations begin producing legal cannabis flowers. In Thuringia, clubs have...


Morgan Stanley Launches Crypto ETFs as AI and Security Risks Rise
Crypto markets showed modest moves, with Bitcoin near $64,000 and ETF outflows continuing. Morgan Stanley launched Ethereum and Solana ETFs...


TotalEnergies Challenges Landmark Climate Ruling and Disputes Customer Liability for Emissions
The French energy company TotalEnergies is appealing a decision by the Paris Judicial Court, which, for the first time in...


Indian Pharma Sector Accelerates Growth Through Acquisitions and Innovation
The Indian pharmaceutical and biotechnology sector is transforming through acquisitions and innovation. Sun Pharma plans to acquire Innovcare Lifesciences to...


Japanese Crowdfunding Platform Ubugoe Faces Payment Crisis After Withholding Funds
Ubugoe, a Japanese crowdfunding platform, has failed to transfer more than ¥65 million raised for railway companies, developers, and event...
 |
|
 |  |
 |
|
-
 Crowdfunding5 days ago
The Italian Crowdinvesting Market Faces Sharp Decline in 2026
-

 Impact Investing2 weeks ago
Pictet Raises $253 Million for Environmental Investment Fund
-
 Biotech3 hours ago
Indian Pharma Sector Accelerates Growth Through Acquisitions and Innovation
-

 Africa1 week ago
PAASIFEJ: Results-Based Financing Driving Inclusive and Sustainable Rural Growth in Morocco