Featured
Is Snapchat stock a buy? Well, it’s setting the stage for higher stock prices
In order to even suggest that a new bull market is in development, SNAP stock needs to find its footing above this downtrend line.
Snap Inc (NYSE:SNAP) has been an awful investment since day three. The first two days of trading were positive, so let’s at least give Snapchat stock that much. What followed was a series of disappointments that caused SNAP stock price to fall by 59.58% over the next six months. Even the investors who were fortunate enough to get in at the subscriptions price of $17.00, are now also underwater, holding losing positions.
Bottoming pattern in development
There is a tremendous amount of negativity surrounding the Snapchat stock, and I am here to provide some solace for the late-coming bulls because I have the inclination to believe that the stock is ready to stage an advance. There is a technical price pattern that is forming on the stock chart, and upon completion, it would indicate that a tradable bottom has been put in place. This tradable bottom would suggest that SNAP stock is due to stage a price advance.
Let me clarify before I move forward. This tradable bottom would be within the context of a much larger bearish trend, but nonetheless, the price action does create an opportunity by suggesting that higher prices are likely to follow.
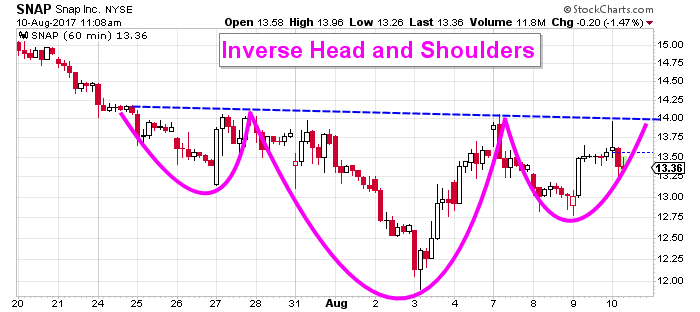
The following Snapchat stock chart illustrates the technical price pattern that is now in development.
(Source)
This SNAP stock chart has been highlighted in order to identify the inverse head and shoulders pattern that is in development.
This technical price pattern consists of three troughs and a neckline. The middle trough, the head, is the largest, and first and third troughs, the shoulders, are usually of equal size. The neckline is formed by connecting the reaction highs, and it represents a significant level of price resistance. The inverse head and shoulders pattern is completed when the price closes above the neckline, indicating that higher prices are likely to follow.
These patterns are great for a number of reasons, and aside from suggesting that the Snapchat stock price is set to appreciate, it can also be used to produce a potential price objective. This price objective is obtained by taking the depth of the head and extrapolating that value above the neckline. For instance, if the inverse head and shoulders price pattern was completed today, a break above $14.00 would produce a potential price objective of $16.00, which would represent a potential return of 14.23%.
(Source)
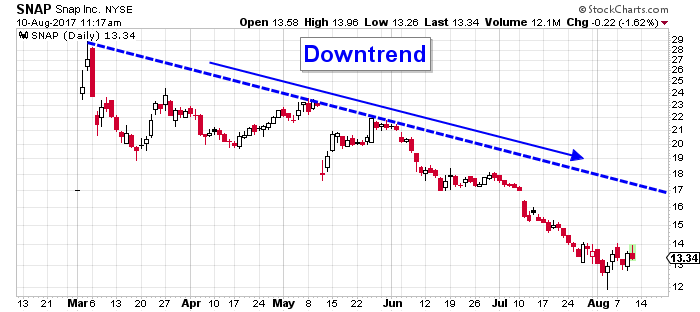
As I mentioned earlier, this technical price pattern has the potential to produce a rally, but the caveat is that this rally will be in the context of a larger bearish trend. This larger bearish trend is highlighted on the following chart.
This SNAP stock chart illustrates the bearish trend that has consumed investors’ wealth. Since day three, the trend towards lower prices has been relentless, and it has been characterized by the quintessential characteristic that defines all bearish trends, which is a series of lower highs and lower lows.
This bearish trend, which has traveled from the upper left of the chart to the lower right, is best defined using a simple downtrend line. This downtrend line, which is highlighted in blue, is created by connecting the peaks on the stock chart. This downtrend line not only defines the bearish trend, but it also defines a significant level of price resistance. This level of price resistance has thwarted all previous attempts to move beyond it, and therefore, in order to even suggest that a new bull market is in development, SNAP stock needs to find its footing above this downtrend line.
The completion of the inverse head and shoulders pattern would suggest that higher prices are likely, which would set up a possible test of the downtrend line. Whether or not this level will be overtaken is something that remains to be seen, but it would surely be an improvement from where Snapchat shares currently sit. A bull market has to begin somewhere, and this may or may not be that point, but there is legitimate potential here.
The bottom line
A tradable bottom is forming on the Snapchat stock chart that, upon completion, would serve to suggest that a rally is set to take hold. This rally would be within the context of a much larger bearish trend, and I would therefore not be able to hold a bullish view on this investment if such a pattern did play out.
In order to hold a bullish view on this stock, the share price will need to break above the downtrend line that has defined the bear market in this investment. Perhaps the completion of the technical price pattern will put this downtrend line to the test.
—
DISCLAIMER: This article expresses my own ideas and opinions. Any information I have shared are from sources that I believe to be reliable and accurate. I did not receive any financial compensation in writing this post, nor do I own any shares in any company I’ve mentioned. I encourage any reader to do their own diligent research first before making any investment decisions.


WNBA Removes Cannabis From Banned Substances List in New CBA
WNBA removed cannabis from its banned substances list in a new CBA running 2026–2032, aligning with NBA policy and allowing...


Trade Republic Brings Back Human Support and Launches Customer Council
Trade Republic is introducing 24/7 human customer support after reaching the limits of its fully automated service model. The fintech...


Bavarian Biotech Sector Expands with Record Funding and Startup Growth in 2025
Bavaria’s biotech sector grew in 2025, with companies rising 1.5% to 548 and funding exceeding €930 million. Startups surged, with...


Egypt’s Net Foreign Assets Rise as External Position Continues Gradual Strengthening
Egypt’s net foreign assets rose to $15.22 billion in May 2026, continuing improvement since 2024. Banking sector NFA reached $22.9...


Wyrmgold Launches Crowdfunding Campaign for Believe in me! (please)
Wyrmgold has launched a Gamefound campaign for Believe in me! (please), a darkly humorous board game where 2–4 players compete...
 |
|
 |  |
 |
|
-

 Crypto1 week ago
Bitcoin and Ethereum Stabilize as Markets Watch ETF Flows and Institutional Moves
-

 Fintech7 days ago
The German Fintech Market Shows Resilience and Strong Investment Growth in 2026
-

 Cannabis2 weeks ago
Medical Cannabis in England Sees Shift Toward Vaporizers and Pills Amid Rapid Market Growth
-

 Crypto2 days ago
Bitcoin and Ethereum Markets Steady as Strategy and Bitmine Expand Holdings Amid World Cup Crypto Activity
You must be logged in to post a comment Login