Markets
S&P 500 and Dow Jones Industrials made all-time highs last week
The markets peaked early this week with the S&P 500 joining the Dow Jones Industrials (DJI) in making new all-time highs.

It was, by all appearances, another dull week in the markets. Both the S&P 500 and the Dow Jones Industrials (DJI) hit new all-time highs early in the week then faded somewhat as the week progressed, primarily due to weak energy stocks responding to the slump in oil prices. Still, both ended marginally to the upside with gains of 0.2% and 0.1% respectively. The Dow Jones Transportations (DJT) lost a little off 0.3% but it was the NASDAQ that put in a decent week gaining 1.8% as tech stocks recovered. It wouldn’t surprise us that the NASDAQ recovers to new all-time highs.
Here in Canada the S&P TSX Composite recovered with a 0.8% gain. Financial stocks enjoyed a good up week following the announcement that Warren Buffet’s Berkshire Hathaway (BRK-NYSE) (through subsidiaries) was prepared to extend to the beleaguered Home Capital Group (HCG-TSX) a $2 billion credit line and purchase upwards of 20% of the company that could become 38% of the company if shareholders of Home Capital approve. The TSX might have done even better if it hadn’t been for weakness in the energy stocks.
Gold rebounded to close the week unchanged after hitting new lows for the most recent down move. Is this a harbinger of good news?
There wasn’t much in the way to drive markets from economic news. Some Fed officials spoke with two governors Harker and Evans suggesting that the Fed should wait for more proof of the rebound before hiking rates again. Many continue to expect the Fed to hike at least one more time this year in either September or December. The Fed continues to believe a tight labor market will drive inflation higher even as there is little proof that is happening. As to the tight labor market, well, 95 million are considered to be not even in the labor force. Since only 51.1 million of them are retirees that leave 43.9 million stay-at-home parents, disabled persons, and those unable to work (10.6 million)—and then there are the long-term unemployed (over one year) that are no longer counted as a part of the labor force (at least 1.7 million). Even of the ones that are employed, some 27.2 million are part-time workers, many of whom would prefer full-time work.
As usual, the week once again focused on President Trump and his inability to stay out of the news. Republican members of Congress appeared to be touting a foreign policy at odds with Trump as they wish to remain friendly with NATO and Europe. The most expensive house congressional race in history concluded this past week with the Republican candidate easily defeating the Democrat challenger but by a sharply reduced margin to the November 2016 result. And North Korea stayed in the news when the released American Otto Warmbier died after coming back to the US in a coma. Tensions predictably increased with North Korea although no new sanctions were sought.
Republican efforts to repeal Obamacare (the Affordable Care Act) hit considerable bumps when a number of Republican Senators indicated they couldn’t support it. The accusation on the new legislation is it transfers wealth from the poor to the rich and an additional 23 million Americans will lose health care coverage. There was also the specter of disabled people being physically hauled away at a protest at Senate House Leader Mitch McConnell’s office. Trump also admitted that he really didn’t have any tapes of him and James Comey after indicating earlier that he might have tapes. The investigation into possible obstruction of justice by Trump continued despite some calls for the firing of special counsel Mueller. Finally, Federal investigators are examining financial transactions of Paul Manafort, Trump’s former campaign manager, concerning real estate deals with Trump’s son-in-law Jared Kushner. Oh, and according to the fact checkers, Trump made 12 inaccurate claims concerning the economy, health care, and his accomplishments at a rally this past week. Plus ça change, plus c’est la même chose.
All in all, it was a pretty quiet week. The markets appear to be impervious to wars, Brexit, sluggish growth, sharply rising debt, rising interest rates, and Trumpian hyperbole. We wonder if all of this is just the calm before the storm.
(Source)
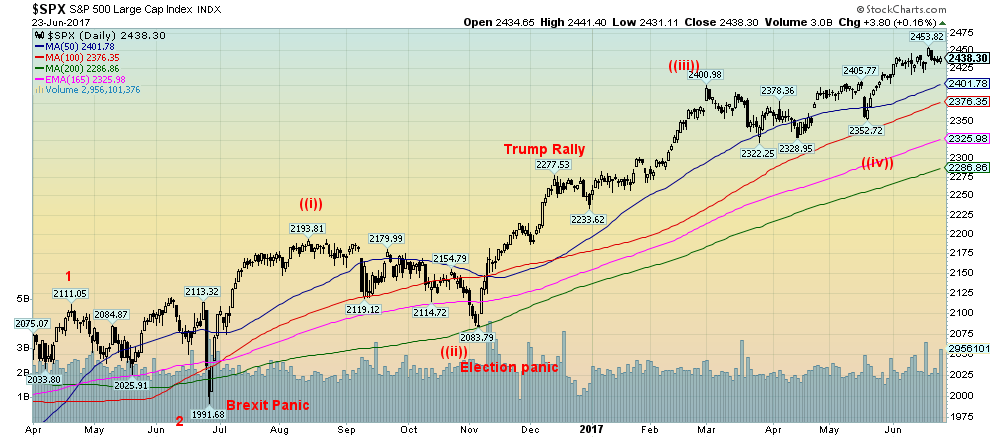
We are beginning to wonder whether the recent breakout to new highs is now the start of a new wave to the upside and that the corrective pattern that got underway following the March 2017 high at 2,400.98 ended with the recent low at 2,352.72 in May 2017. This thought would be a departure from the wave count from Elliott Wave International. We are now 1.5% up from the March 2017 high and about 5% up from the low also seen in March 2017. The markets peaked early this week with the S&P 500 joining the Dow Jones Industrials (DJI) in making new all-time highs. No other index joined the party—at least, not yet.
Everything, as they say, can be seen in hindsight. Elliott wave is sometimes more of an art than a science and the ongoing wave counts, levels, and constant reassessing baffle most. While working one’s way through the daily minutiae can be frustrating, often the bigger picture emerges more clearly. Sometimes it’s just better to keep it simple. A trend is up until it takes out a previous low. The uptrend is confirmed when new highs are made. That assessment pertains to daily, weekly, monthly, and even yearly charts. And for that matter even to intra-day charts.
The daily trend could break down under the May low of 2,352. The weekly trend would break down under 2,352 as well but more likely under 2,325. The March low at 2,322 would also define the monthly trend even as we would be more comfortable with a breakdown under the November 2016 low of 2,084. As to the yearly, the 2016 low was seen in February 2016 at 1,810. A breakout to new highs above 2,453 would confirm the uptrend and we believe at that point even Elliott Wave International would need to reassess.
While a number of technical indicators are and have been diverging with the new highs such as the percent of stocks above their 200-day MA, the McClellan Oscillator, the McClellan Summation Index and the ARMS Index (TRIN), these indicators are just warning signs and not necessarily a confirmation that the market is about to fall. Confirmation would come on a breakdown under a recent low. But instead of breaking down the May 2017 low was actually a higher low to the March 2017 low. It suggests the trend is up. Even if there is a pullback at this time we still believe once this pullback is complete the markets should once again move to new highs.
(Source)
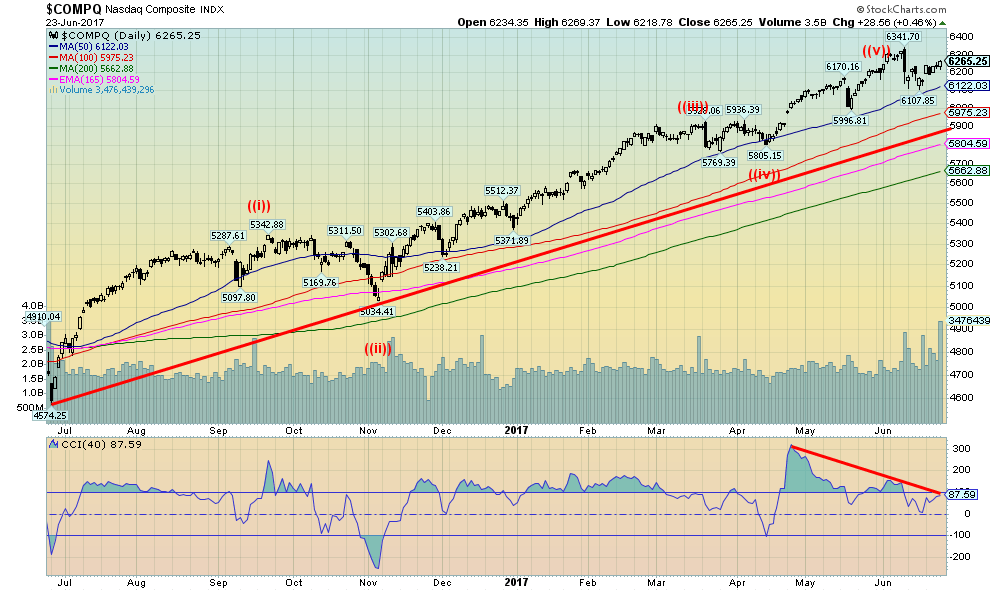
In looking at the NASDAQ the wave count appears to be clearer. But is that 5th (labeled as ((v))) really complete? It appeared to be when the big five— aka “the generals” or the FANG stocks (Facebook, Apple, Netflix and Google)—led a sharp reversal on June 9, 2017. Except follow through to the downside has not been particularly good. They now appear to be rising again and it may have been confirmed with the high volume day seen on Friday—the highest seen in months. Doesn’t appear to be the “end of the world” as some would define it. The CCI indicator is turning up again and if it breaks out over 100, it would confirm the price movement. New highs above 6,342 would also confirm the uptrend. Only a breakdown under 6,120 with no new highs would suggest that the corrective wave that got underway on June 9 remains in force.
(Source)
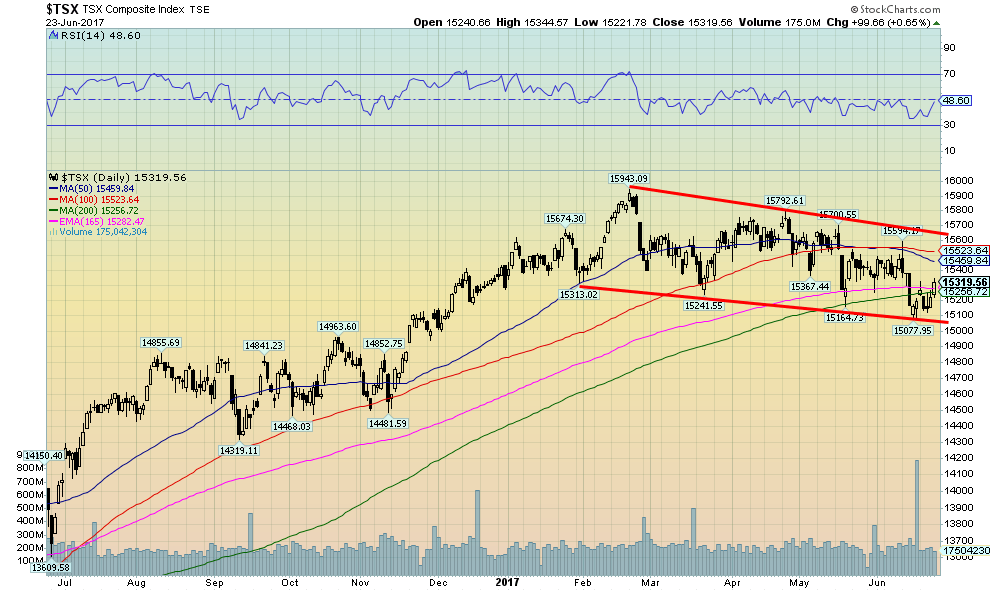
The S&P TSX Composite continues to hold the gentle sloping down channel that got underway with the top in February 2017. The market bounced nicely this past week thanks to pick up in the financial stocks following the announcement that Warren Buffet and Berkshire Hathaway (BRK-NYSE) were riding to the rescue of Home Capital Group (HGC-TSX). Home Capital jumped nicely as did the major banks and other associated mortgage lenders and insurers. Energy stocks remained a drag on the index because of weak oil prices. But materials, led by gold stocks, enjoyed a solid up week.
So is a low in? Thus far the 200 day MA appears to be holding the downtrend. The reality is, however, the TSX needs to regain above 15,500 and especially above 15,600 to suggest that new highs above the February high of 15,943 could occur. New lows below 15,078 would confirm the downtrend. The gentle sloping down channel appears to be holding the market thus far. And the pattern forming does not appear to be a descending triangle that would suggest a breakdown once the pattern is complete. However, a solid breakdown under 15,077 could suggest a decline to at least 14,200.
But the TSX has always been about being in the right sector at the right time. The action this week appeared to suggest a move to financial and material stocks. But avoid energy stocks.
(Source)
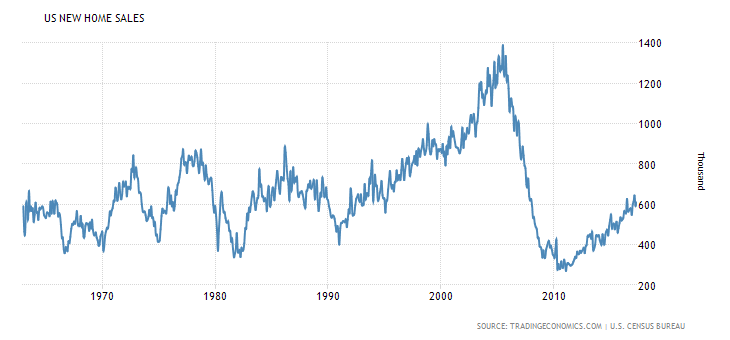
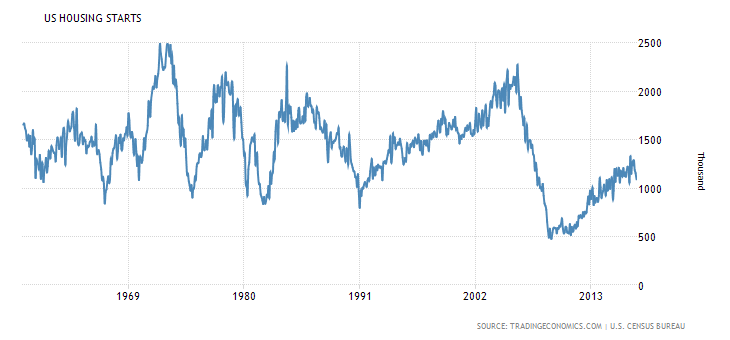
They keep telling us how great the US economy is doing. If that is the case, why are new home sales hovering closer to lows in the 1970s, 1980s, and 1990s than to highs of those periods? And they are certainly nowhere near the highs seen in 2006. But then again maybe it’s all relative. Rising interest rates are not going to help these sales. Although in looking at existing home sales they are actually doing better.
(Source)
Even by most standards, housing starts are rather anemic. If new home sales are dragging down around the lows of the 1970s, 1980s and 1990s housing starts are worse, hanging barely above those lows. The past few months the number of new housing starts has actually turned down, as have new home sales. All of this reflects the stagnation in the market and puts a lie to thoughts that the economy is actually improving. Tighter lending conditions, coupled now with rising interest rates by the Fed could squelch whatever activity has taken place.
(Source)
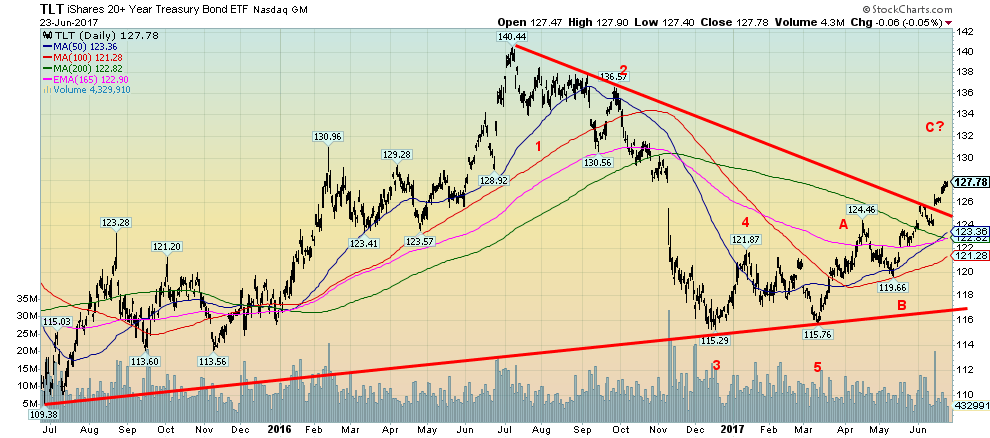
US Treasury bonds as represented by the iShares 20-Year Treasury Bond ETF (TLT) have broken out to the upside. The resistance zone is up in the 130/132 zone. We would be surprised if the TLT were able to break through that level. But the rising prices shows there is some concern that the Fed hiking interest rates will result in a slowdown in the economy. The US 10-year Treasury note yield has fallen to 2.15% and most likely is poised to move lower. But it remains well away from the lows of July 2016 when it hit 1.37%. Canadian bond yields have also come off with the 10-year Government of Canada yield dropping this past week to 1.50%. But there remains some sense that the BofC could hike interest rates at some point because of the improving Canadian economy. However, the current trend is up for bond prices (down in yield as yields move inversely to prices) and the yield curve as a result should continue to narrow. But we remain a long way from a negative yield curve and a strong hint that a crisis could erupt.
(Source)
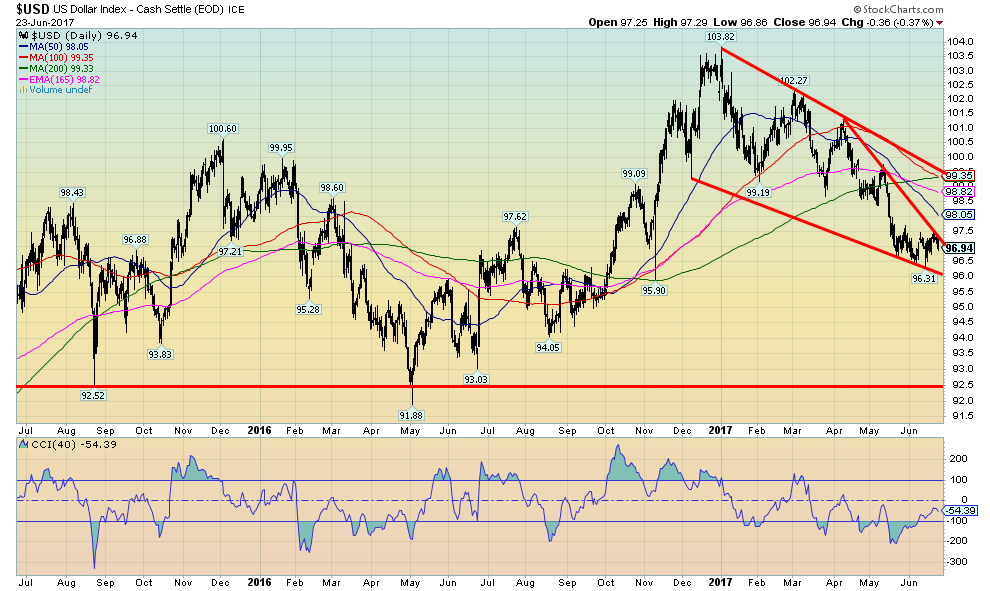
The pattern shaping up for the US$ Index appears to be a descending triangle. If that is correct, the US$ Index should break to the downside. The potential target zone could 90/92 a level that would take it down to a minimum the lows of August 2015 and May 2016. The only thing that would change this is for the US$ Index to regain back above 97.50 and potentially set up a test of 100. But this pattern looks ominous and we would be surprised to see it move higher. A falling US$ could have negative ramifications for the US stock market but would be positive for gold and silver.
(Source)
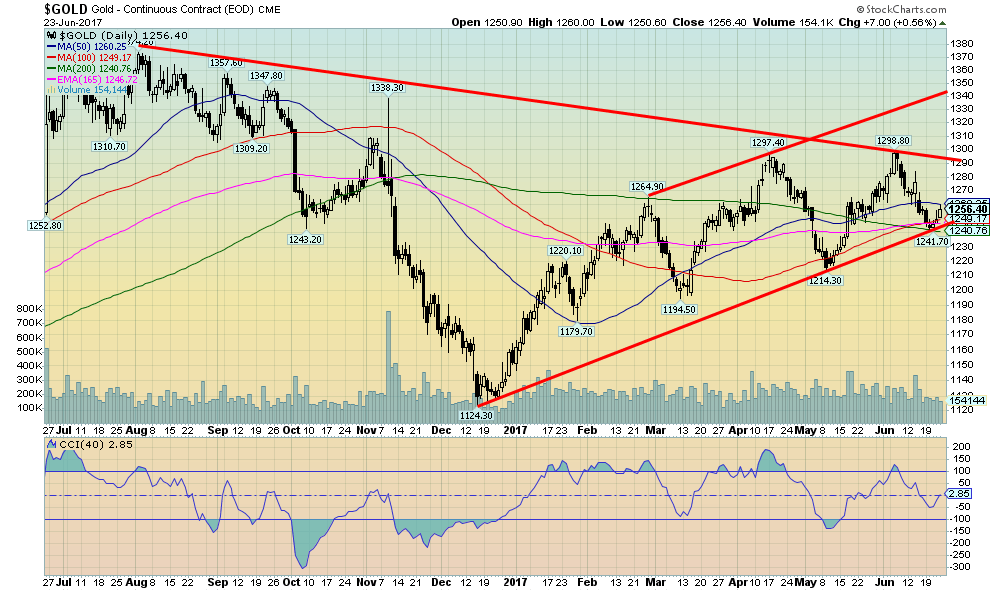
After moving to new lows for the recent down move, gold reversed and closed largely unchanged on the week. This was a positive development as gold held the $1,240 zone and the up trendline from the December 2016 low. If this low is confirmed and gold moves to new highs, it would confirm the uptrend and series of higher highs and higher lows that has been seen since the December 2016 low. The key area is at $1,280. Above that level new highs above $1,299 are likely. A move above $1,300 would target at minimum up to $1,330. It would also suggest that gold could move towards the 2016 high of $1,377. A breakdown under $1,240 and especially under $1,230 would, on the other hand, be bearish and suggest that gold prices could break under the May 2017 low of $1,214. We doubt this will happen but it needs to be noted. We can’t help but note that the gold stocks enjoyed a strong up week with both the Gold Bugs Index (HUI) and the TSX Gold Index (TGD) gaining 4.5% even as both gold and silver were relatively flat. Sentiment towards the gold stocks remains closer to lows then it does to highs. This suggests to us that gold stocks could embark on a considerable run. Gold stocks also remain cheap to both gold and silver on a historical basis.
(Source)
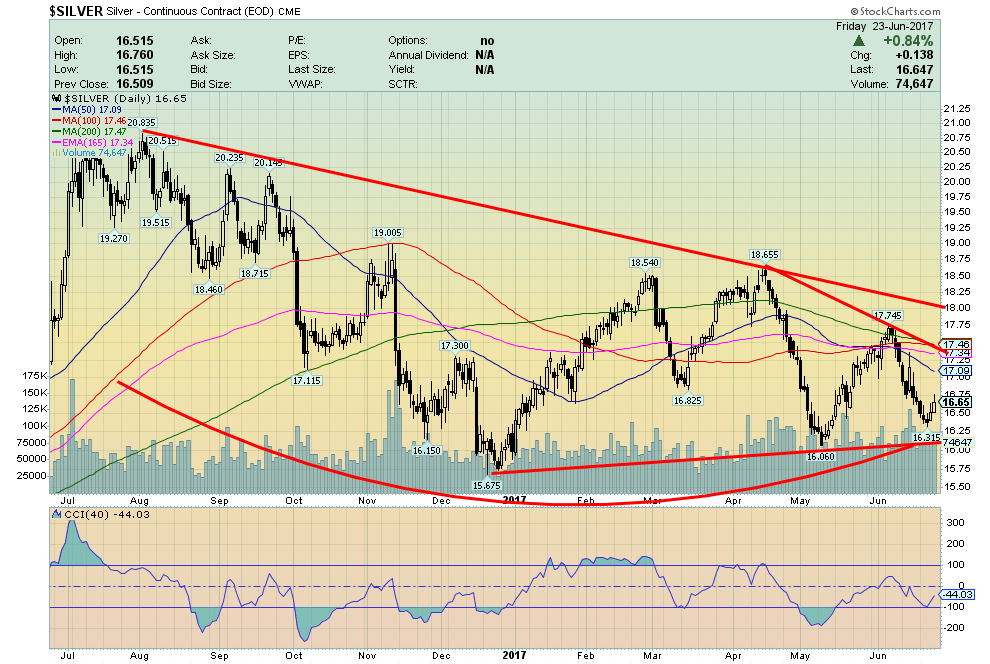
We especially like silver. Silver appears to be forming an interesting bottom pattern. One could say it is a head and shoulders bottom but it is an imperfect one. Nonetheless, there is a breakout point at $17.50 and especially above $18. Once silver breaks out over $18 it could potentially target up to around $23. Sentiment has been terrible towards silver down around 12%. It has been lower but it is interesting it is at these low levels considering silver is currently about $1 above the December 2016 low. Silver appears to have found support in the $16 to $16.30 zone. Regaining $17 would be a start, but we really need to get above $17.50 and $18 to suggest higher prices and confirm the lows.
(Source)
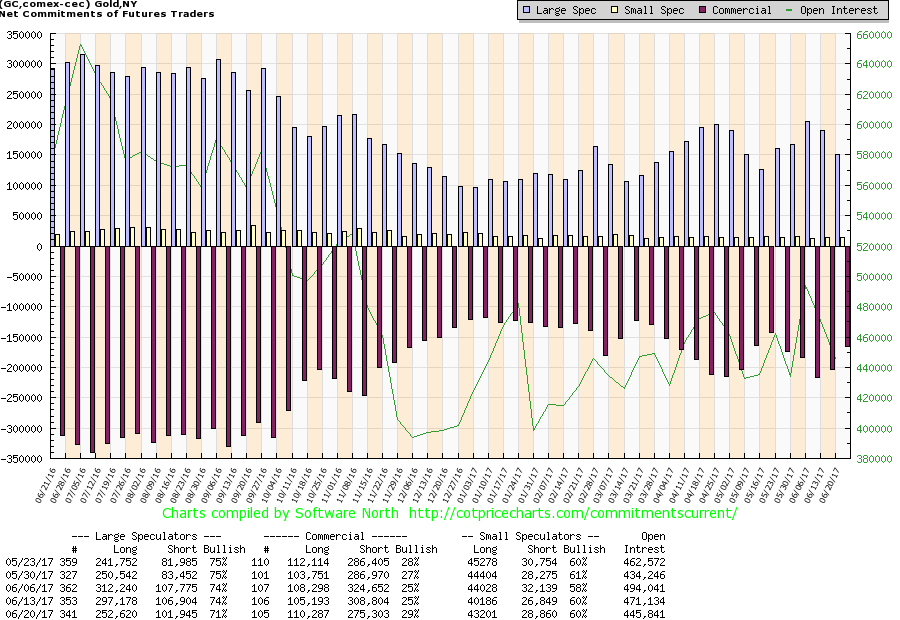
It was probably no surprise that the rise in gold prices this past week was accompanied by an improvement in the commercial COT. The commercial COT jumped to 29% from 25% with a roughly 33,000-contract drop in short open interest and about a 5,000-contract jump in long open interest. Naturally, the large speculators COT went the other way falling to 71% from 74%. We would look for further improvement in this week’s report due out on Friday after the markets close.
Also, note the silver commercial COT also improved from 29% to 33%. These improvements in the commercial COT for both gold and silver give us some confidence that the next move is up.
(Source)
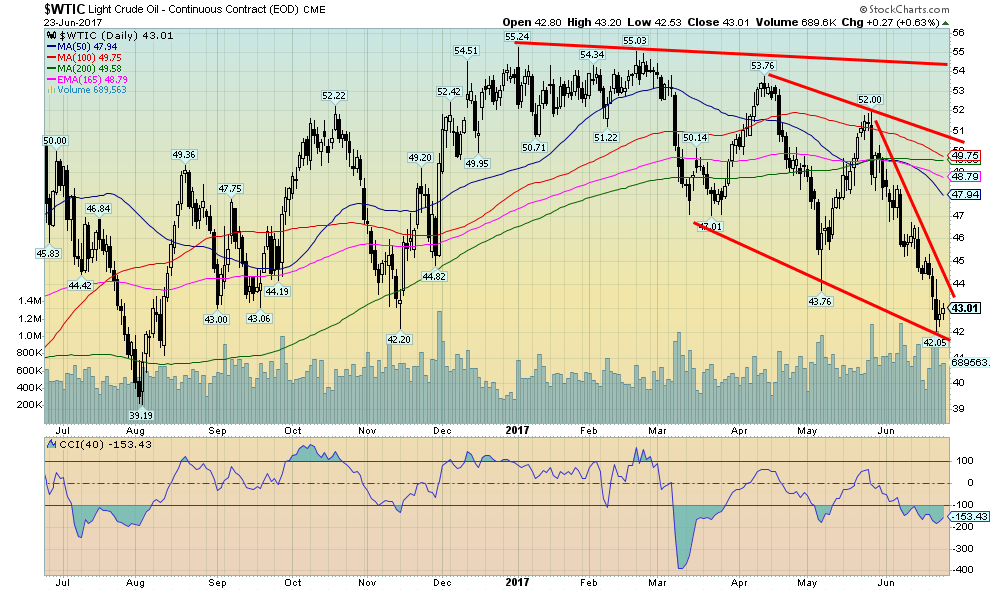
WTI oil prices keep falling down another 4.4% this past week. Oil prices hit down to a support of $42. Oil prices, like the US$ Index, appear to be forming a dangerous looking descending triangle. If correct, oil prices could soon fall into the $30’s. A breakdown under $42 could start a move with potential targets down to $33. This could be bullish for the economy but devastating for the energy sector and energy stocks. Oil prices are now down roughly 20% so far in 2017 and with this dangerous looking chart they could soon be much lower. A bounce may be developing but resistance is seen at $44. Unless we can break above that level and especially above $46 the odds are oil will fall further. One of the big problems cited by many analysts is demand that was expected to develop into 2017 is just not happening. As well, the world’s largest consumer of oil, the US, is becoming less reliant on the Mid-East as production has ramped up domestically thanks to shale oil. But a big drop in prices also puts pressure on extracting shale oil. And none of this is good news for Canada’s oil sands which has had considerable difficulties in adapting to a lower priced world. Despite all of this our expectations are that oil prices should work their way lower.
—
DISCLAIMER: This article expresses my own ideas and opinions. Any information I have shared are from sources that I believe to be reliable and accurate. I did not receive any financial compensation in writing this post, nor do I own any shares in any company I’ve mentioned. I encourage any reader to do their own diligent research first before making any investment decisions.


Cannabis Legalization in Germany: A Mixed Interim Assessment
Germany’s cannabis legalization has reduced criminal cases and eased pressure on the justice system, while the black market is slowly...


Sustainable Restoration of the Haus Hövener Garden in Brilon
The Brilon Construction Workers Association is restoring the Haus Hövener garden into a cultural community space, funded through a €10,000...


Temenos to Acquire Additiv to Boost AI Wealth Management
Temenos is acquiring Zurich fintech Additiv to strengthen its digital wealth management and expand AI-driven financial orchestration. Additiv’s platform connects...


EFPIA Warns Limited SPC Reform Could Weaken EU Pharma Competitiveness
EFPIA supports the EU Biotechnology Law and a 12-month SPC extension but warns the current proposal is too limited. A...


EU Approves €23B Italian Renewable Energy Plan to Boost Climate Goals
The European Commission approved Italy’s €23 billion aid scheme to boost renewable energy and meet 2030 climate goals. Supporting wind,...
 |
|
 |  |
 |
|
-

 Impact Investing1 week ago
ACBC and OVS Partner to Launch Sustainable Footwear Collections for 2026
-

 Impact Investing2 weeks ago
Global Sustainable Funds Return to Inflows as Passive ESG Dominates in Early 2026
-

 Crowdfunding4 days ago
Historic KiHa 2101 Railcar Restored in Japan Through Community Effort
-

 Fintech1 week ago
Barcelona Strengthens Its Position as a Southern European Fintech Hub
You must be logged in to post a comment Login