Business
Why this spring’s wheat stock market has turned into roller coaster
The outlook for spring wheat appears optimistic.
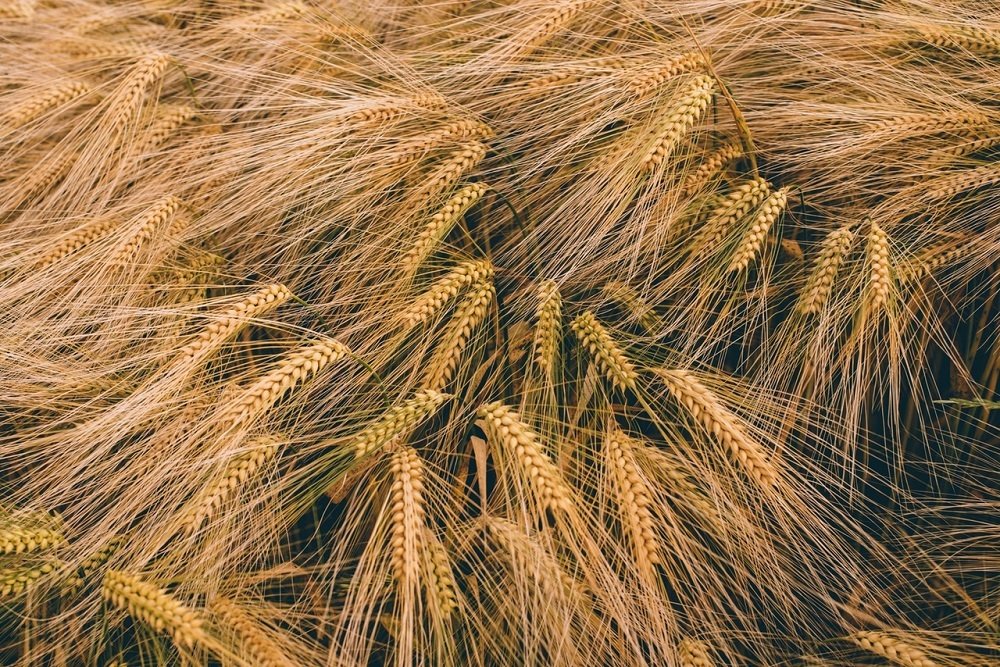
After experiencing many highs and lows the outlook for spring wheat seems positive.
An easy question to ask; uh oh, spring wheat, are you ok? It has been a heck of a roller coaster ride through 2017. Minneapolis May wheat reached a February high of 573’4 on the 13th before beginning a new slide lower as bears once again took control of the entire wheat complex in the middle of February. May has since fallen to a low of 528’0 before recovering to the close on Wednesday, March 15th, at 540’4 for a total slide of 33 cents in the last 21 sessions. New crop, September traded from a high of 578’0 down to 543’6 before recovering that Wednesday as well; losing a total of 25’6 cents over the same time period. Was that all Minneapolis could do and wheat, in general, is being typical wheat by killing any and all optimism?
Fundamentally, the wheat story isn’t the greatest. While it has stopped getting worse, domestically we have a 49.7% stocks to use ratio and 33.7% globally. Needless to say, there is plenty of wheat to go around, however, wheat is not just a general topic or crop. Domestically, hard red winter wheat has stocks to use a ratio of 58.6%; soft red winter wheat at 68.8%; then hard red spring wheat which is much lower at 30.9%, down from 2015/16’s 48.9%. Of the “wheats”, hard red spring wheat’s stock to use ratio has dropped 18% from the previous year compared to wheat in general which has fallen only 0.3%. Is there a story hiding up in Minneapolis?
On March 31st, the USDA is set to release the Prospective Planting report along with the Quarterly Grain Stocks. As reported on the January 12th Winter Wheat and Canola Seeding report, winter wheat acres are down roughly 3.8 million from the previous year and the USDA expected spring wheat-other acres to be down roughly 3% or roughly 350,000 acres.
Looking strictly at Hard Red Spring wheat, not Spring Wheat-Other as the USDA often groups it which has a seven-year average difference of roughly 6%; in 2016 the United States planted 10.95 million acres of Hard Red Spring Wheat and 11.605 spring wheat-other. (Data sourced from the USDA) Using the average difference and taking into account a 3% decline in planted acreage; 2017 Hard Red Spring Wheat acres are estimated near 10.0 million acres. The previous 7 years have an average difference between planted acreage and harvested acreage of roughly 2.25%; leaving potential Hard Red Spring Wheat acres near 9.77 million harvestable compared to last year’s 10.67; continuing with the long term trend of less and less acres which has a 16 year average drop of 206,000 acres per year.
Listed in order, the states of North Dakota, Montana, Minnesota, South Dakota and Washington make up the “big 5” of Hard Red Spring Wheat producers. Given the outstanding soybean crop that has been grown in Minnesota recently makes it easy to guess that Minnesota will give up some acres and the same for South and North Dakota as the Dakota’s have struggled to produce quality Hard Red Spring Wheat; just leaving Montana and Washington. Will Montana increase acres? Maybe, however, North Dakota and Washington are the only “big 5” to see a trend line increase in acreage for the past 7 years.
Using a 10-year trend line yield of 48.0 (which would be a record) and harvestable acres of 9.77 million; production comes in near 469.0 million bushels versus 493.1 million in 16/17. However, a much lower beginning stock of 189.1 million bushels compared to previous year of 272.0 million bushels, supported by a surge in exports, has Hard Red Spring Wheat in a much more favorable position for 2017/18.
Leaving food, feed & residual and exports unchanged year over year, a record yield of 48 bushels per acre would still result in falling US ending stocks by roughly 107 million bushels to 82.1 million bushels and a stocks to use ratio of 13.4%; the lowest since market year 2007/08; a year for the history books as Minneapolis futures prices soared to a February 2008 well into the teens.
As a surge in exports helped break the recent trend of growing ending stocks year over year; however, it has surged past its trend line growth and may be due for a slowdown. Historically, as seen in the market year 2010/11, surging exports is often followed with a large export reduction the next year as 2011/12 exports dropped off by nearly 100 million bushels.
Listed in order; Japan, Philippines, Taiwan, South Korea, Italy, Venezuela, Spain, Thailand, Mexico, Dominican Republic, Indonesia and China make up the “big 12” importers of US hard red spring wheat from 1996/97 through 2013/14. While these 12 countries as a whole have been growing in demand, the world has seen demand falling year over year and may indicate that the surge in exports last year could be short lived and follow historically export patterns. Cutting exports from the 2015/16 export of 320 million bushels to 285, still outpacing trend line, the US ending stocks still could fall to near 117.1 million bushels.
So now, what if? Still using harvestable acreage of 9.77 million, what if yield were to come in below trend line at 44.0 bushels per acre and demand is left unchanged, US ending stocks fall to near 43 million bushels or 7.0% stocks to use ratio; which would be the lowest seen since the start of the century! However, as stated earlier, I feel exports could stand to be trimmed. Staying in check with export trend line growth since 2000/01; cutting exports to 285 million bushels, still above trend line; the US ending stocks are still on the decline and near 78 million bushels or 13.5% stocks to use. Taking an even deeper cut into exports and dropping that amount to 210 as seen in 2008/09, ending stocks still come in below last year.
A wild card to keep in mind is Canada. As US exports soared this past year, Canadian exports have been on the slide for the past three years after reaching a near record export in 2013/14 as production has been on the slide as well. However, a renewed push for higher production this last year could be a cause of lower US exports. Currencies will likely be a driving factor on who will win between the US and Canada which has a currency that closely watches the crude oil market. A return to higher crude oil prices could result in a struggling export environment for our neighbors to the north.
In almost every scenario US Hard Red Spring Wheat ending stocks are likely to decline this coming year. The trend of less and less planted/harvestable acreage is likely to persist through this year as soybeans steal acres in key states like North Dakota, South Dakota and Minnesota. Even if yields were to reach a record 48.0 bushels per acre and exports slide to 215 million bushels; the US would still need to increase total acreage in order to keep ending stocks from declining year over year and an increase in planted acreage is seen unlikely by the market and by me as well.
The outlook for spring wheat appears optimistic. Less planted and harvestable acreage is bullish. Trend line yield near a record 48 bushels per acre may be hard to achieve as the top yield in the last 16 years stand at 46.3 bushels per acre and may have plateaued for the time being; also bullish. While domestic demand and exports could both stand to be trimmed; realistic reduction in these respective categories still allows for a shrinking end stock. Springtime planting in the northern plains will be key. NOAA has already pointed out a strong possibility of springtime flooding in the Dakotas and may very well be for Minnesota as well. Given the strong soybean market, recent struggles to grow quality Hard Red Spring Wheat and the unfortunate fact that many producers are still below breakeven; producers in these key Hard Red Spring Wheat states may have little reason to force the shot in order to get the acres planted.
—
DISCLAIMER: Trading commodity futures and options involves substantial risk of loss and may not be suitable for all investors. You should carefully consider whether trading is suitable for you in light of your circumstances, knowledge and financial resources.


Temotiva Launches Crowdfunding Campaign to Advance Preventive Mental Health
Temotiva Innovación Lab has launched a crowdfunding campaign through Santander X Explorer, marking a new phase for the University of...


Fed Policy Shift Raises Concerns Over Debt and Inflation Risks
The Federal Reserve is criticized for resuming balance sheet expansion through Treasury purchases despite expectations of tighter policy under new...


AI Adoption in Italian Retail Stalls Despite Strong Experimentation
A survey on AI in Italian large-scale retail trade shows companies are increasingly adopting artificial intelligence, but only 1.4% have...


Crypto Market Stays Stable as Bitcoin and Ethereum See Mild Declines
The crypto market remained stable despite slight declines in major coins like Bitcoin and Ethereum. Bitcoin held near $64,362, while...


WNBA Removes Cannabis From Banned Substances List in New CBA
WNBA removed cannabis from its banned substances list in a new CBA running 2026–2032, aligning with NBA policy and allowing...
 |
|
 |  |
 |
|
-

 Fintech1 week ago
Temenos to Acquire Additiv to Boost AI Wealth Management
-

 Africa5 days ago
Remote Work Reshapes Sales Management: Key Lessons for Moroccan Leaders
-

 Fintech2 weeks ago
German Fintech Investment Slumps as AI Becomes Key Focus
-
 Crypto2 days ago
Crypto Market Stays Stable as Bitcoin and Ethereum See Mild Declines
You must be logged in to post a comment Login