Featured
Stock market on the downside due to prolonged US-China trade war
Have the markets topped? Not necessarily the final top but it’s another top comparable to January 2018 and September/October 2018.

As with the previous declines, it is the U.S./China trade war that is once again spooking the markets.
Recession? What recession. No sign yet according to our recession watch spread but our Chart of the Week highlights slipping and sliding areas in the U.S. economic numbers. Bond yields have been falling despite there being no recession nor QE.
Gold and silver rose this past week but remain below potential break out points. No follow through and the gold stocks were weak signaling that gold and silver are likely to fall again. Oil prices fell as well as a negative response to the trade war.
The drums are sounding
War drums continue to pound. And, no we don’t mean the war drums directed at Iran, Venezuela, or even Russia and China. These are the war drums of a trade war that is becoming incessant and dangerous. One Chinese official speculated that this trade war could last until 2035. He could be right. The two sides are not even talking. It is being suggested that one-on-one is becoming essential for Trump and Xi at the G20 in June. Another Chinese official evoked memories of past treaties by saying “this sounds like a return to 1840. Is that fair?” He was referring to the treaty the Qing Dynasty was forced to sign after losing the First Opium War in 1839–1842.
Curiously, the First Opium War broke out between China and Britain because of the huge trade deficits that Britain was running with China. China exported predominately tea, porcelain, and silk. Britain sent them money in those days in the form of silver—lots of it. The trouble was the pound sterling was under pressure and Britain was indebted because of its wars, particularly the Napoleonic wars, which resulted in huge trade deficits for them. The solution was to export opium to China — lots of it. The opium came from Northern India. The opium triggered a drug crisis in China which the Chinese tried to put a stop to. When, in 1839, China arrested a British opium trader and destroyed the opium, that became the excuse to send in the British fleet to bring the Qing Dynasty to heal. China lost, the Qing dynasty was seriously weakened, China was forced to sign an unfavorable treaty, and China began to experience internal problems as the people became disillusioned with the Qing rulers.
Not that today can be compared with what took place in the 19th century, but there is some similarity. China sends goods to the U.S. and China collects U.S. dollars which they then use to purchase U.S. Treasuries. At last count, China had $1.1 trillion, the largest foreign holding of U.S. Treasuries. Many have talked about China using the nuclear option in the trade war with the U.S. The nuclear option is to sell its vast holdings of U.S. Treasuries. Except that wouldn’t work for either as it could put upward pressure on U.S. interest rates, forcing the price of the U.S. treasuries to fall. The Fed could buy the treasuries as other central banks; this would be similar to quantitative easing but in China’s favor. The nuclear option is not likely to happen.
Instead of talking, the trade war has deepened. The stock market is now reacting—to the downside. Should that be a surprise? Probably not. It seems that Wall Street thinks it will continue for a lot longer than people expect. Both the U.S. and China appear to be hardening their positions. To be hit hard is the technology sector. We’ll have to await second-quarter profits. As to the economy, that remains to be seen but retail sales are sliding, construction spending has turned negative, and home sales are falling. Mortgage rates are also falling, it seems, in response to falling home sales as lending institutions attempt to revive business.
The current round started when the U.S. hiked the tariffs on $200 billion of Chinese goods to 25% from 10%. It has been escalating from there. Now the U.S. has banned the giant Chinese tech company Huawei, preventing it from buying U.S. components. The semiconductor index (SOX) has fallen 17.5% since topping on April 24, 2019. Is that the fate for the broader market as well? The SOX is trying to find support at the 200-day MA. Will it hold?
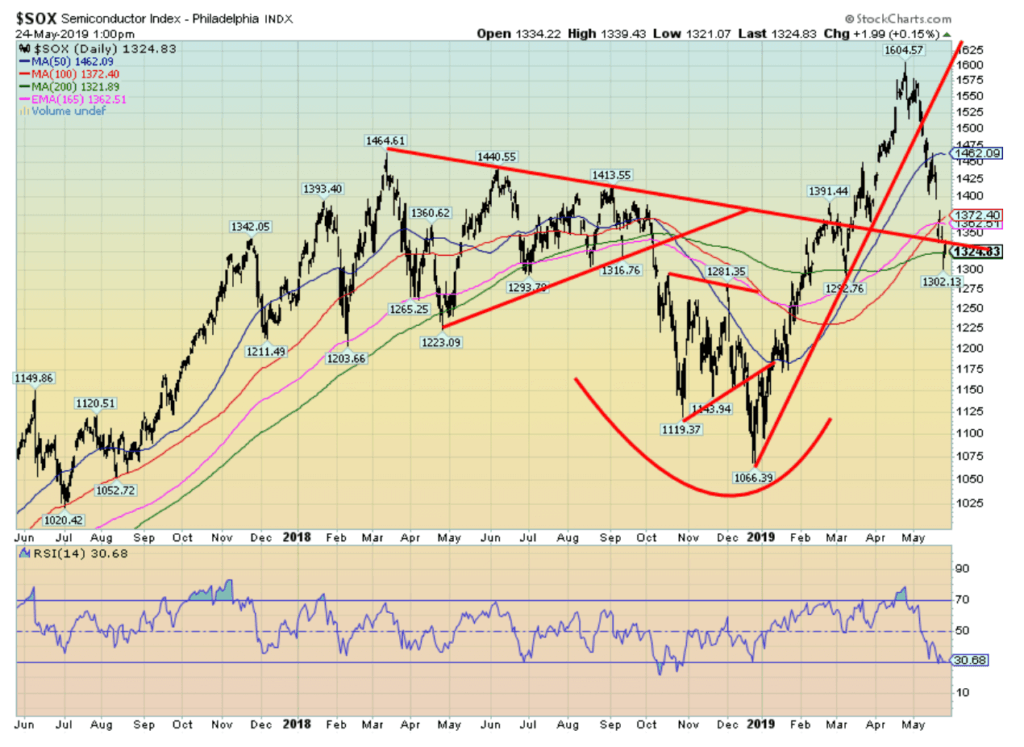
©David Chapman
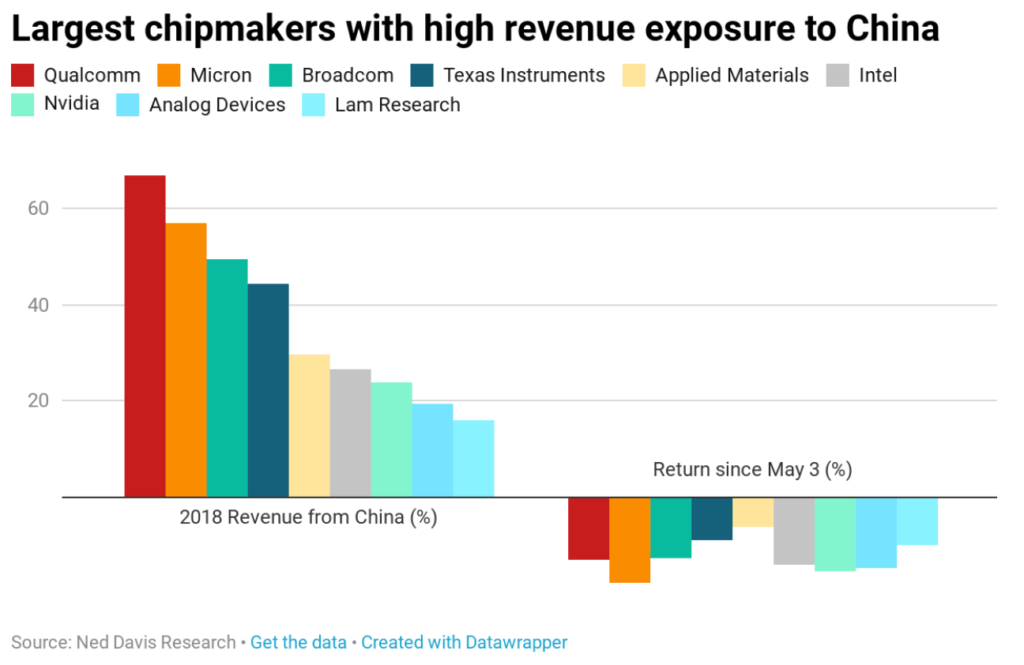
But it wasn’t just semi-conductor stocks taking a hit. There was fear that a slowdown involving the U.S. and China could negatively impact oil demand. WTI oil fell over 5% on May 23, 2019. War with Iran? That doesn’t seem to be a concern. The result was energy stocks fell sharply as well, down about 3.5%.
Business is becoming concerned as they depend on the supply chains from China. Higher costs will be passed on to consumers. It is expected that the tariffs could also add to inflation.
With the Huawei ban, the fear is that China will counter and aim at Apple. The U.S. has warned that other Chinese tech companies could suffer the same fate as Huawei. An attack on more companies would most likely engender a counterattack on U.S. companies. Chinese President Xi Jinping has warned Chinese consumers that China may have to endure another “Long March.”
“All of the Chinese people are ready to embark on a new ‘Long March’ journey with greater courage and resilience and will never yield to foreign bullying and assault,” state-run Xinhua News Agency said in a commentary on Friday.
©David Chapman
The IMF has weighed in that the tariffs have been borne almost entirely by U.S. importers. Those costs, of course, will be passed on to the consumer. American business is becoming concerned. “Filling U.S. coffers” with $100 billion a year according to Trump is just not going to happen. Chinese firms and consumers are also footing most of Beijing’s countermeasures. On both sides, firms and consumers are being hurt. At this point neither will be crippled by the trade war. But what if it gets worse?
China can hit the U.S. in other ways. China accounts for more than 90% of global rare earth mine production. Rare earths are used in everything from ceramics to consumer electronics. And, of course, they are used in military components. While China does import rare earths as well, including from the U.S., it also exports rare earths to the U.S. Rare earths could be on the agenda for banning.
Despite the tariffs and Trump’s calls that the U.S. can win the trade war, the U.S. trade deficit has actually been widening.
U.S. Balance of trade
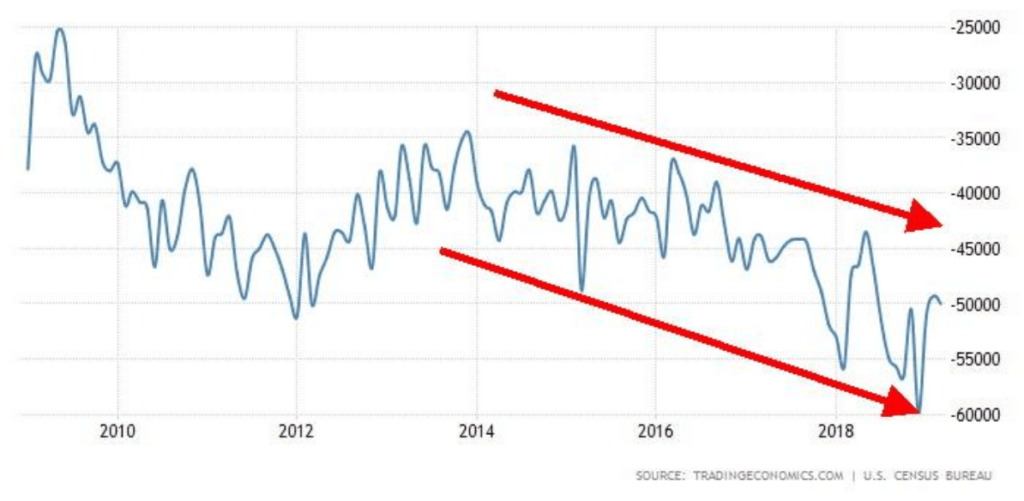
©David Chapman
The U.S. trade deficit has been on a downward path since late 2013. The trade deficit has also been widening since Trump started the trade war in January 2018. In December 2018 the trade deficit hit $59.9 billion, the highest level since August 2000 when it hit $67.8 billion. The March 2019 trade deficit was $50.0 billion, following a $49.3 billion deficit in February. The February trade deficit was an 8-month low.
The Fed has weighed in on the trade war as well. The Fed doubts that households could stomach the costs of tariffs on a further $300 billion of Chinese goods. A Fed study has noted that 39% of households couldn’t meet a $400 emergency, 60% couldn’t cover three months of expenses if they were to lose their job, and, 25% said they did not seek medical care in the past year because of financial problems. U.S. farmers have been particularly hard hit as China shifted the purchase of soybeans, and now pork, to other countries. As a result, a $16 billion bailout is being planned for the farmers that have been hurt by the trade war.
The potential for the most damage comes in technology wars. The line between who produces what in China and the U.S. is often blurred. Not only is technology used in military but it is also used in telecommunications, satellite networks, robotics, artificial intelligence, and 3D printing. Companies regularly interchange technologies between China and the U.S. Any breakdown in that supply chain could dramatically impact the industry. Yet the U.S. is threatening bans and restrictions in the national interest.
In an effort to allay fears, Trump has indicated that Huawei could be a part of a broader trade deal with China. The stock markets bounced back a bit on May 24, 2019, following the near 300-point drop the previous day as a result of Trump appearing to offer a compromise. Gold and interest rates also reacted to the threat of an increased trade war as gold jumped $10+ on Thursday while the 10-year U.S. Treasury fell to its lowest level since October 2017. There are a few safe havens amongst the trade war carnage, it seems.
Markets and trends
*New highs/lows refer to new 52-week highs/lows. ©David Chapman
©David Chapman
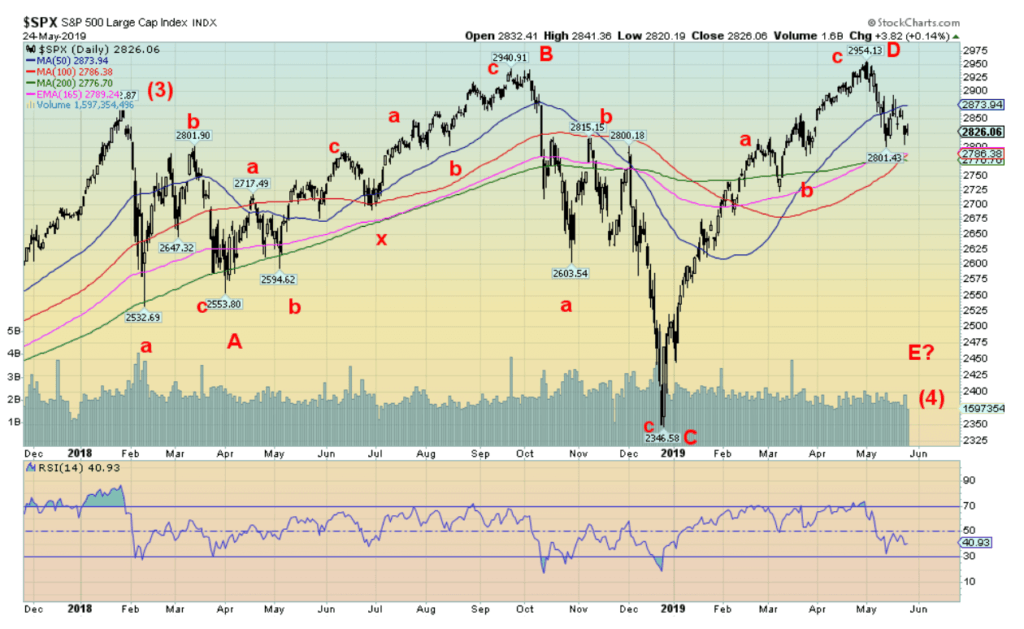
We have been somewhat mystified as to how to look at this market over the past several months. The collapse from the high in September 2018 to the December 2018 low was significant as the market fell just over 20%. It was the steepest decline since the May to February correction in 2015–2016. In looking at everything, all we saw were corrective patterns following the top in January 2018. So, we have re-labeled how we see the current market. It is possible that since the top in January 2018 the market is tracing out a complex ABCDE-type pattern. The A wave appears to have bottomed in April 2018 following an ABC decline. The B wave took us to top in September 2018 in an abcxabc zig-zag pattern for the B wave. The C wave bottomed in December 2018, again in an ABC decline. Finally, the D wave may have topped here in May once again with an ABC rise even as it made small new all-time highs but only 14 points over the previous high.
What follows next is an E wave that could fall in five waves and take the market down 20% plus. What should then follow is another sharp rise in the market that takes us once again to new all-time highs. Grant you, this is just an interpretation and remains to be seen. We remain in what should be the period for the four-year cycle low counting from the lows of August 2015 and February 2016. The range on the four-year cycle low is 3–5 years so we are well within that time frame of 2018 to 2020 or even 2021. Following runs to new highs we would then fall into the 6.5-year cycle low that has a range of 5–8 years or 2020 to 2023 or even 2024 with the likelihood that it occurs in the 2020–2023 range. We note that our short-term trend has turned down and the intermediate trend, which is more important to investors, remains up but is weakening.
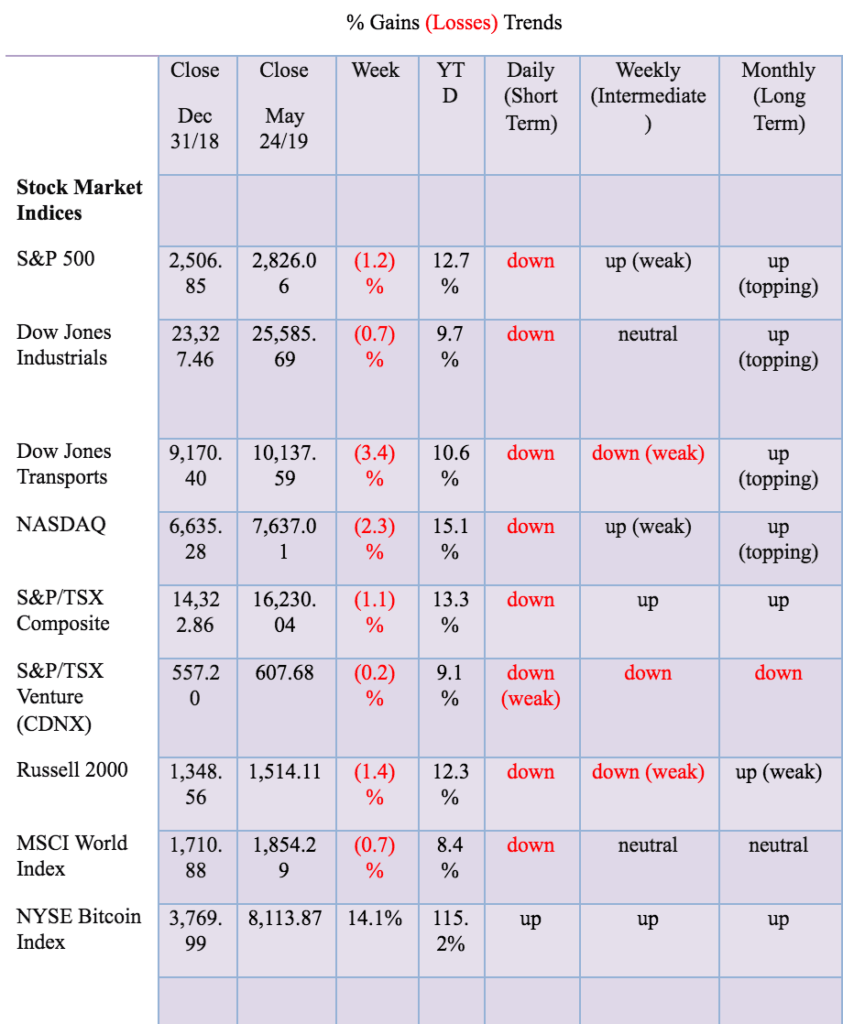
For the record, the S&P 500 fell 1.2% this past week, the Dow Jones Industrials (DJI) was off 0.7%, the Dow Jones Transportations (DJT) was hit harder down 3.4%, and the NASDAQ dropped 2.3%. All were driven lower by the renewal of the U.S. China trade war. The small-cap Russell 2000 was down 1.4%. Elsewhere, the TSX Composite dropped 1.1% while the TSX Venture Exchange (CDNX) was off 0.2%. Overseas, the London FTSE 100 fell 0.8% against the backdrop of Brexit and the resignation of Theresa May, the Paris CAC 40 dropped 2.4%, and the German DAX was down 1.9%. In Asia, the Shanghai Exchange (SSEC) was down 3.5%, reacting even more negatively than the U.S. markets. The Tokyo Nikkei Dow (TKN) bucked the trend with a small 0.4% gain.
Volume continues to be a concern for this market as it has remained weak throughout the rally that got underway back in late December 2018. Key to this market is at 2,722 the low of March 8, 2019. A break under that level and especially under 2,700 could trigger further declines. That would also take us under the 200-day MA. Regaining 2,900 would be positive and suggest at least another test of the recent highs. Note that we do have divergences because the S&P 500 made small new all-time highs but the DJI did not, nor for that matter did the DJT.
©David Chapman
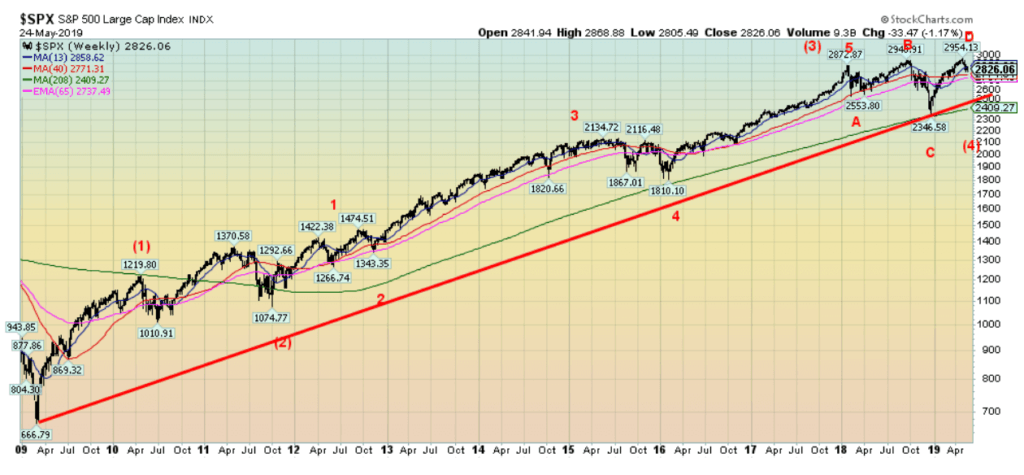
Here is our re-labeling of the market from the important March 2009 low. We have labeled the rise to April 2010 as intermediate wave 1. Intermediate wave 2 was the upward correction (the EU Greek debt crisis) that bottomed in October 2011 (S&P down 21.5%). Intermediate wave 3 unfolded in five waves, topping in January 2018. Minor wave 1 topped before Brexit and minor wave 2 was again an upward correction bottoming with the U.S. election of November 2016. Minor wave 3 topped in May 2015 while minor wave 4 bottomed in February 2016. Minor wave 5 topped in January 2018. Intermediate wave 4 is still unfolding in what appears to be a complex ABCDE pattern and has not as yet made its final bottom. Wave E to come.
©David Chapman
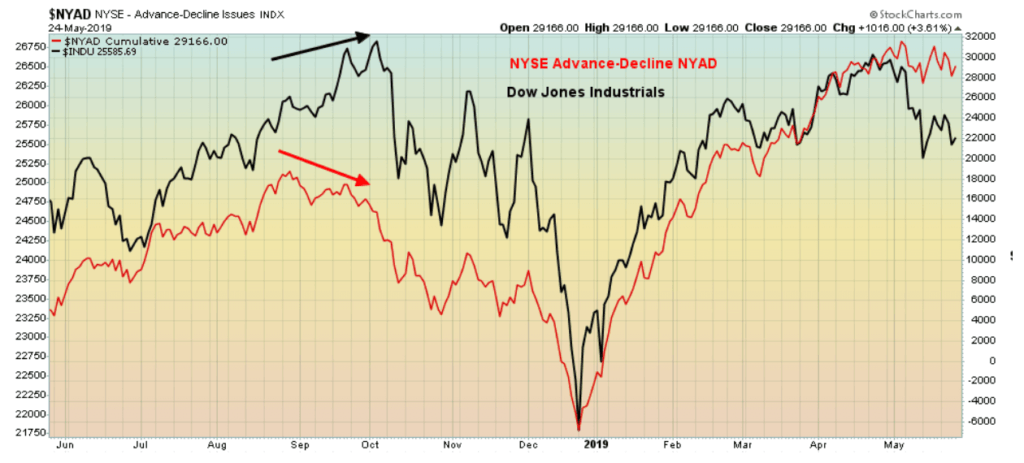
Since the lows in late December 2018, both the Dow Jones Industrials (DJI) and the NYSE advance-decline have been climbing. One of the mantras of the bulls is that the NYSE advance-decline started making new all-time highs sometime in late February/early March and has been climbing to successive highs ever since. This was signaling that the stock market should also continue to rise to new all-time highs. Except it hasn’t quite worked out that way. The DJI has not made new all-time highs, even as the NYSE advance-decline did. Now the markets have turned down. The NYSE advance-decline is no longer making new highs. We have been baffled about what appeared to be a divergence between the index and the advance-decline line.
Usually, if a divergence appears it is the index making new highs and not confirmed by the advance-decline line. That occurred at the top last October 2018. But this time it has been the other way around. Elliott Wave International recently noted that they did find an earlier occurrence. They noted that in September 1976 the advance-decline was making new all-time highs even as the DJI started a decline. That, they said, provided a hook that kept investors in the market. As well, the initial decline saw the DJI down less than 5% after five weeks of declines. This time the market has been down for five weeks and has fallen only 4.4% again less than 5%. So, what does this all mean? Well, in 1976, what followed was the DJI fell some 28% into a low in 1978. Could history be repeating itself?
©David Chapman
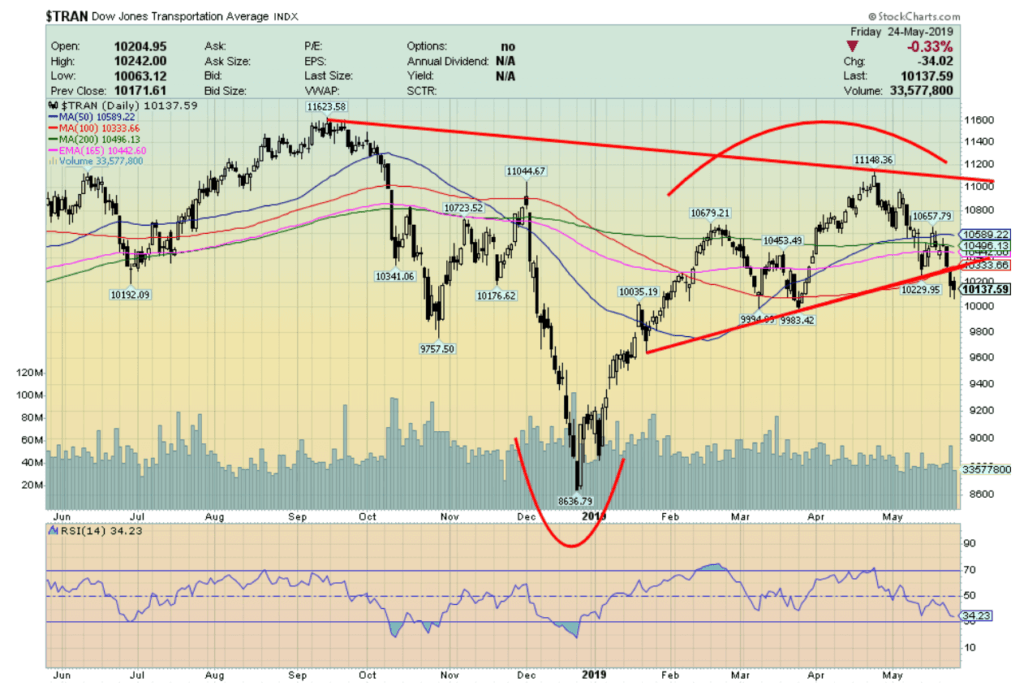
Is the Dow Jones Transportations (DJT) acting as a leading indicator? Neither the DJI or the DJT made new all-time highs on this up move from December 2018 even as the S&P 500 and the NASDAQ did. We’d have preferred if one of them had while the other did not. That would have been a classic Dow Theory divergence. We can note, however, that the Dow Jones Utilities (DJU) has made new all-time highs even as the DJI and the DJT have not. Nonetheless, a few things stand out with the DJT that are not being seen on the DJI.
The DJT made a very clear ABC rise from the December 2018 low to the recent top. The DJT has fallen below its 200-day MA. The DJI is currently finding support at the 200-day MA. The DJT intermediate trend has turned down, although weakly so far. The DJI’s intermediate trend has turned neutral but another down week could see its intermediate trend also turn down. The DJT appears to be breaking down from a topping pattern. Still, we would need to see a breakdown under 9,980 and the lows seen in March 2019 to confirm a breakdown. Only a move back above 10,700 would start to negate this scenario. If the DJT is breaking down, then the other indices should soon follow.
©David Chapman
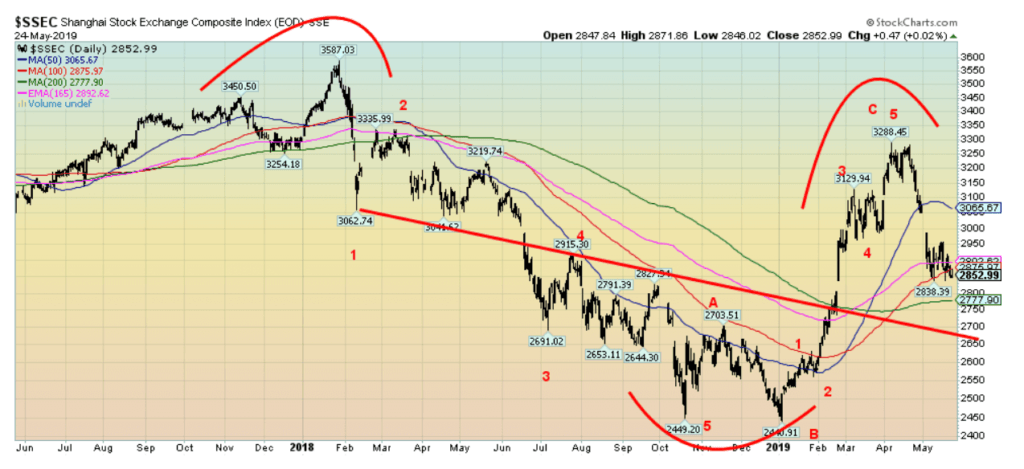
Chinese stocks are reacting negatively to the U.S./China trade war. The Shanghai Composite (SSEC) recently gapped down and is now down 13.3% from its recent high. Key support of the 200-day MA looms below at 2,778. Usually, when the SSEC has gapped down in the past it has signaled that further declines lie ahead. The pattern from the low in early 2019 appears to have unfolded as an ABC. Major support can be seen down at 2,700. The gap is not filled until the SSEC regains back above 3,100. Could the SSEC be signaling that the U.S. markets will eventually follow? Note the similarities in the top from November 2017 to January 2018 and the current top formed between March and April 2019. The final top in January 2018 was followed by a 32% decline for the SSEC into January 2019.
©David Chapman
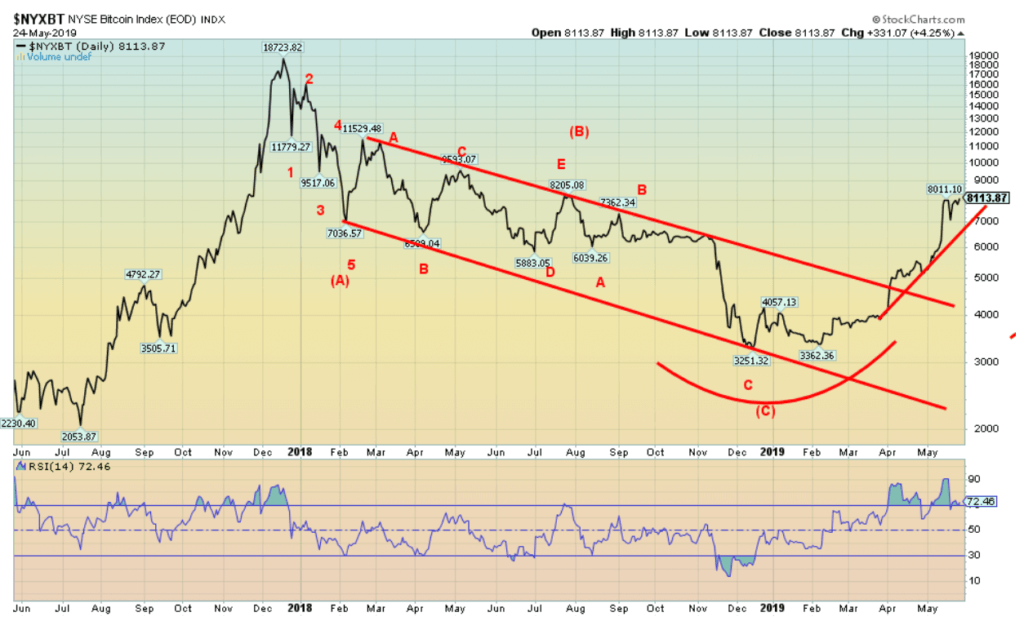
The collapse back toward $7,000 for Bitcoin was short-lived and once again Bitcoin is rising. A new bull appears to be underway. The question is, will this end like the other one? The next target appears to be $9,000. Above $11,500 Bitcoin could start another runaway move. Overbought (RSI over 70) is merely a condition and not a suggestion that the market is about to fall. So, what is driving Bitcoin and the cryptocurrencies higher? Well, institutional buying for one. Apparently, some pension funds have put a chunk of money into cryptos. The halvening of Bitcoin is also helping to drive prices higher. Technical indicators have gone off and that has brought in some fresh money. The number of people owning Bitcoin and cryptos has also recently grown. And finally, some large orders have helped push prices higher. That regulators haven’t fully worked out all the wrinkles doesn’t seem to be a barrier these days. Nor are reports of hacks and frauds.
All this has helped push the market cap of all cryptocurrencies to $250.2 billion, which is still a pretty small market. Bitcoin’s market cap is $142.4 billion or 57% of the crypto market. There are 2,209 different cryptos listed at Coin Market Cap. And there are 16 cryptos with a market cap over $1 billion led, of course, by Bitcoin.
©David Chapman
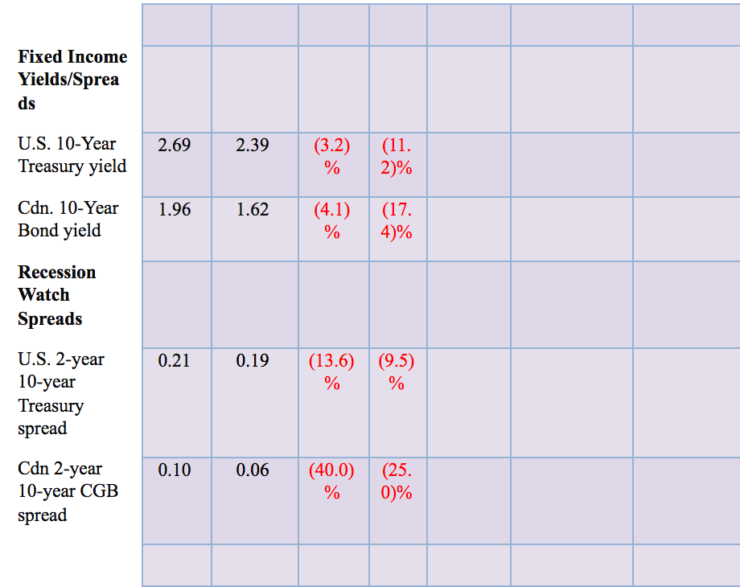
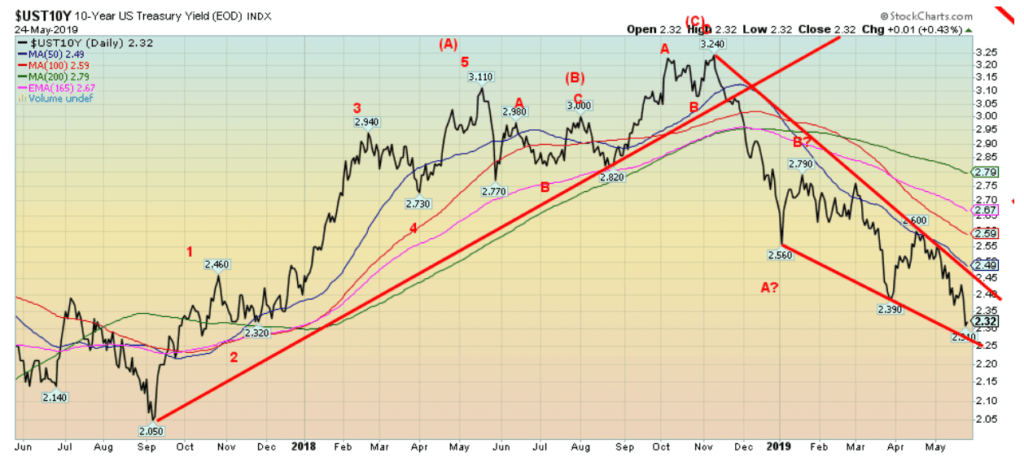
U.S. bond yields continue to fall with the 10-year U.S. treasury falling this past week to 2.32%, down from 2.39% the previous week. U.S. bonds were pushed lower in yield (prices move inversely to yield) as the U.S./China trade dispute deepened. The expectation is that the dispute could cause the U.S. to fall into recession and bonds are responding. Bonds also act as a safe haven. Targets appear to be for the 10-year to fall to around 2.20%. Current support is down to 2.25%.
©David Chapman
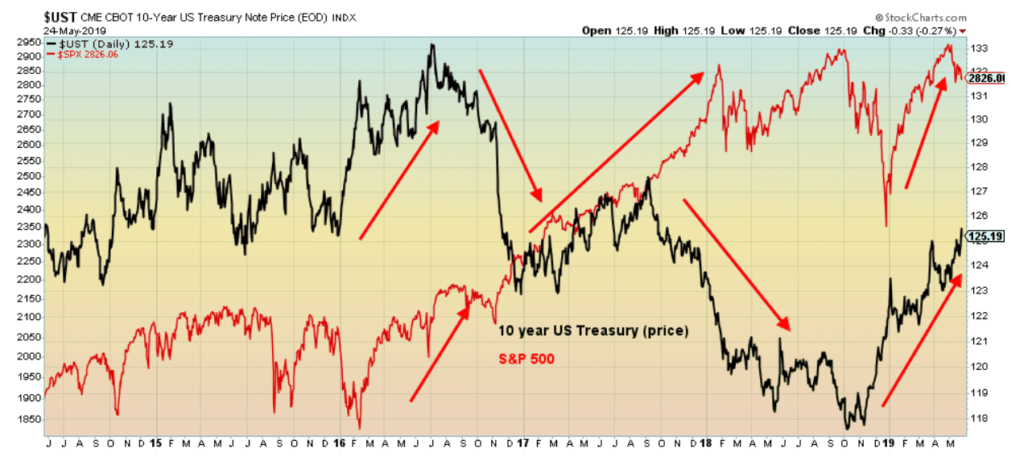
Here is a picture of the 10-year U.S. Treasury note vs. the S&P 500. The 10-year is depicted using price (yields move inversely to price) so that both are in sync using price. Note that bond prices were falling from early in 2016 as QE came to an end and the U.S. economy was signaling strong growth. As well, the tax cuts and projections that the debt would grow also helped to push up bond yields (prices down) even as the stock market rose to record levels. Bond prices began to stabilize in 2018 when the stock market first reacted negatively to the U.S./China trade dispute. When the stock market fell sharply from October to December 2018 bond prices started to climb because of recession fears. With the stock market rising again starting at January 2019 bond prices also climbed. With the U.S./China trade dispute heating up once again bond prices have risen further even as the stock market has begun to falter. Is the bond market anticipating an economic slowdown?
Recession watch spread
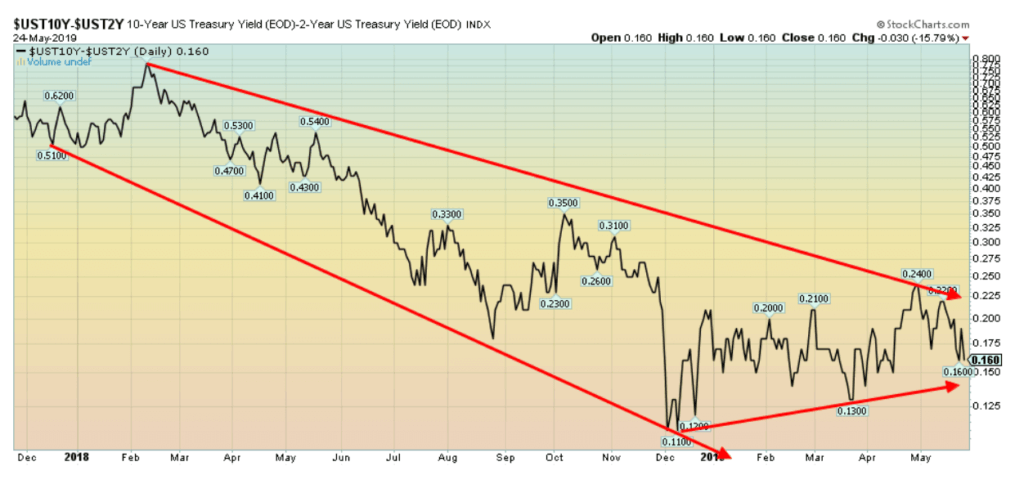
©David Chapman
Any thoughts of an impending U.S. recession are just that, thoughts. The widely watched 2–10 spread (2-year U.S. Treasury notes less 10-year U.S. treasury notes) came in at 16 bp this past week, down from 19 bp the previous week. It is a long way from turning negative although it could fall rapidly. Some other watched spreads have turned negative but typically these spreads turn negative months before an actual recession. Even the 2–10 spread is negative historically at least six months before the start of any recession. The Canadian 2–10 spread is narrower at 6 bp. But still not negative.
©David Chapman
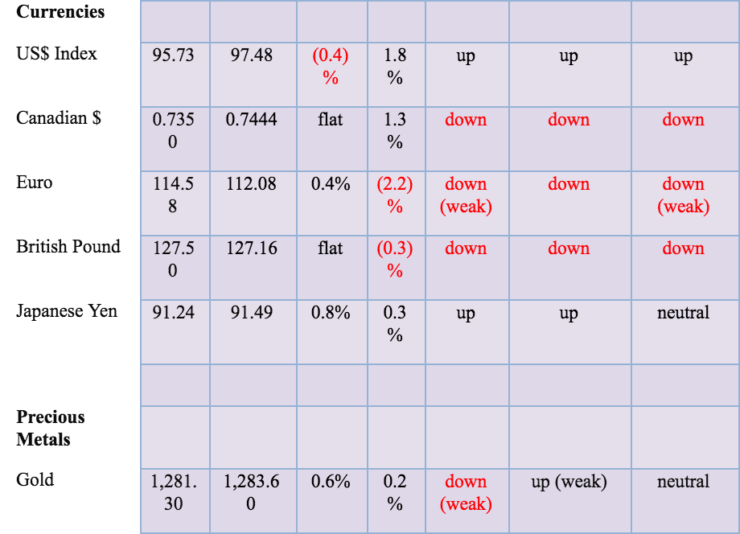
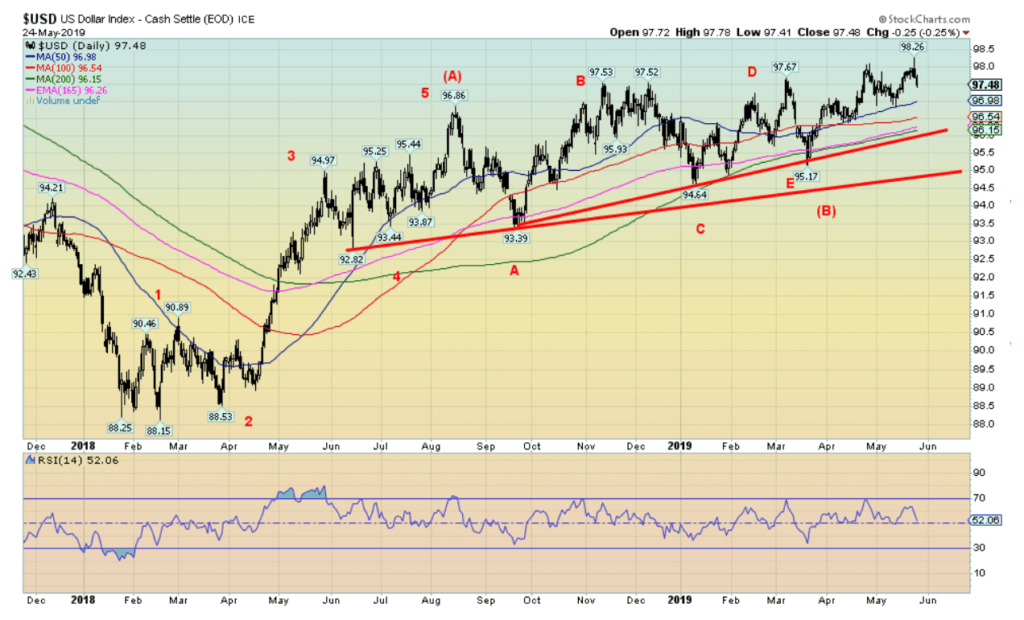
Has the US$ Index topped? Hard to say. The US$ Index made a new high for the recent move at 98.26, then reversed and closed lower on the week losing about 0.4%. The complex pattern that formed between the August 2018 high at 96.86 and the March 2019 low at 95.17 appears as a potential ABCDE-type pattern. Objectives on this pattern were up to 101.60 to 102.00. Minimum objectives would be at least 98.50. At 98.26 we are short of that objective. The pattern only busts if the US$ Index falls back below 96.81 the low of May 13, 2019.
So, it is possible there is more upside on the US$ Index before this is complete. The euro was up 0.4% on the week after hitting a new low for its move at 111.07. The pound sterling was flat on the week, falling at first during the week but bouncing back on Friday following the resignation of Theresa May. The Japanese yen was the most successful on the week, up 0.8% while the Canadian$ was flat on the week. The US$ was strong earlier in the week but fell as the U.S./China trade dispute deepened. Traders viewed the dispute as negative for the U.S. economy. Major support remains down to around 96. New highs above 98.26 would start the US$ Index towards its next objective of at least 99.10/99.25.
©David Chapman
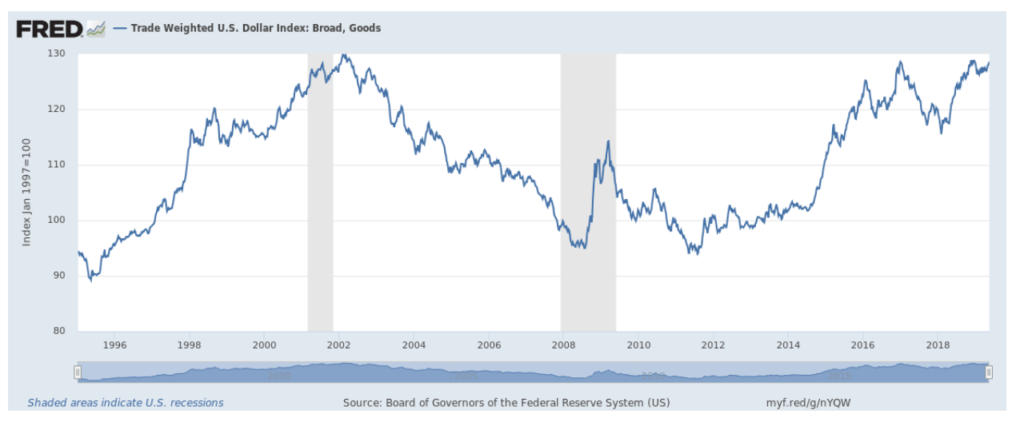
The trade-weighted U.S. dollar index is a much better measurement of the US$. The trade-weighted U.S. dollar index is made up of a broad group of U.S. trading partners. It includes all the biggies found in the US$ Index (euro, yen, sterling, Cdn$, Swiss franc, and Swedish krona) plus a basket of 21 other international currencies that includes as well the Chinese yuan. So, in many respects, it is a better measurement. The trade-weighted U.S. dollar index made new highs in December 2018 and is threatening once again to make new highs. As we have noted the widely followed US$ Index is nowhere near its old highs of 103.
©David Chapman
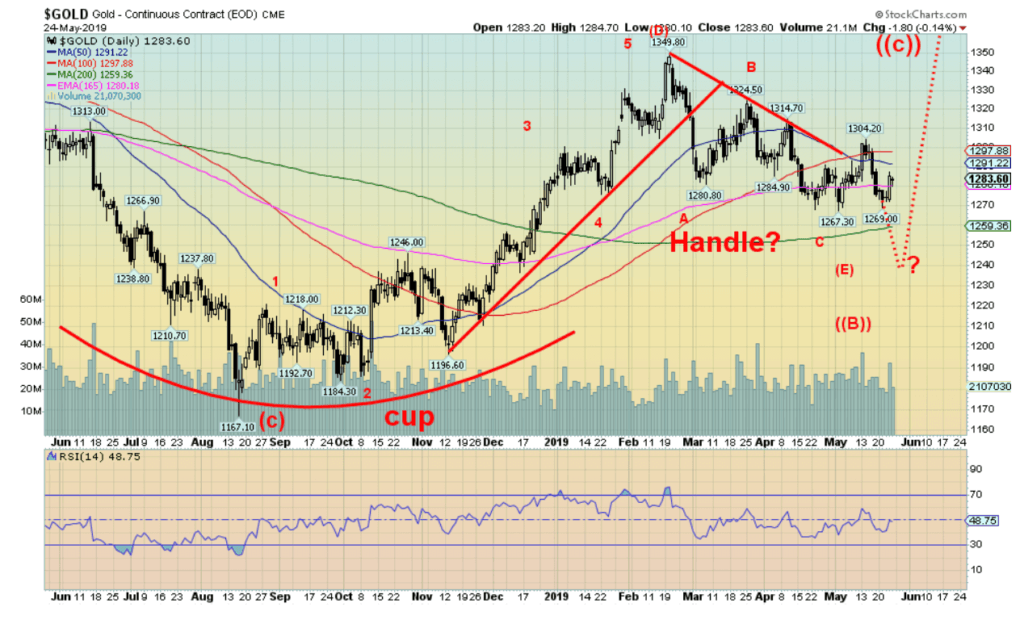
The U.S./China trade dispute saw gold jump a sharp $11 on Thursday. However, Friday saw only feeble follow-through as gold was actually off $1.80 or 0.1%. On the week gold jumped 0.6%. The low on the week was at $1,269 which was shy of the previous low of $1,267. However, the low was sufficient to suggest to us that we should most likely see new lows below $1,267. We could argue that gold could be forming a small head and shoulders top with the recent low at $1,267 and recent high at $1,304. Any move above $1,290 might suggest that the pattern is busting.
Nonetheless, a return to the downside and breakdown under $1,270 could suggest a decline to $1,233. That is very close to our ultimate target zone of $1,235/$1,250 for gold. Once this low is in, we should have completed the E wave down and, by extension, complete the complex corrective pattern that got underway with the top in July 2016. Gold could be forming a cup and handle bottom pattern. A breakout to new highs above $1,350 suggests a potential move to at least $1,535. Any move below $1,200 would, however, suggest that something far more bearish is at play. We are not expecting that. Seasonals start to turn positive past June.
©David Chapman
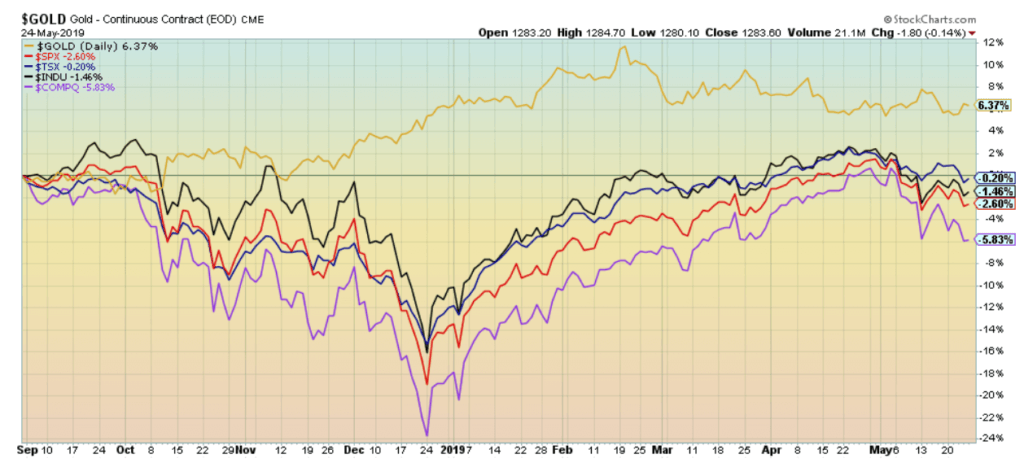
Since the stock markets topped last September 2018 gold continues to be the best performer up about 6.4%. All of the indices remain in negative territory despite the recent powerful rally. The NASDAQ has been the weakest off 5.8% with the TSX Composite the best of the bunch, down only 0.2%.
©David Chapman
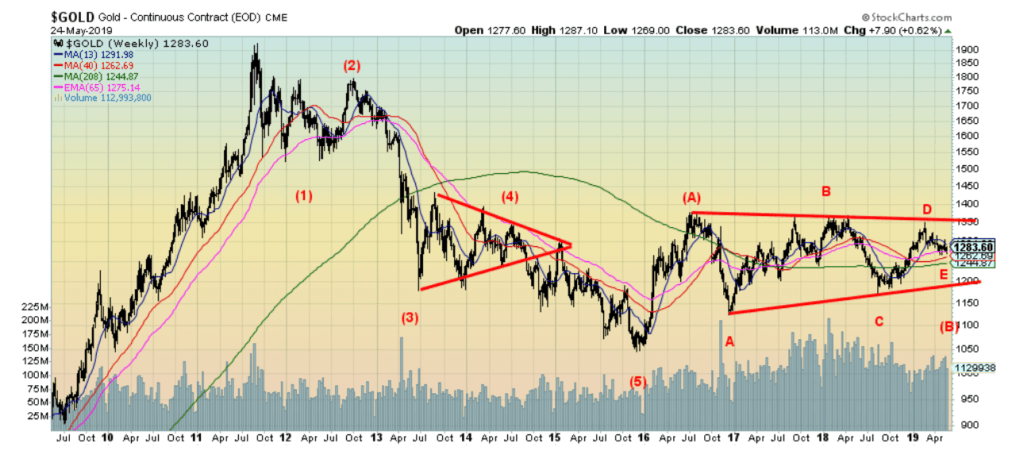
Once again, a peek at the bigger picture for gold. Gold continues to make what appears to us as a multi-year bottom pattern. A possible 5-wave decline was seen for gold from the top in September 2011 above $1,900 to the final low in December 2015 at $1,045. What followed the December 2015 low was a strong move that took us to a top in July 2016 at $1,377. That is labeled as wave (A). What followed that high appears to be a complex ABCDE-type pattern with the A wave bottoming in December 2016, the B wave topping in February/May 2018, the C wave bottoming in July 2018, and the D wave topping in January 2019.
We believe we are now working on the E wave. The E wave is usually the shortest of the waves. We expect that this wave should ultimately find its final bottom somewhere in the $1,235 to $1,250 zone. Note the 4-year MA is currently at $1,245. An argument could even be made for the final low to be down near the trendline, currently near $1,200. Only a breakdown under $1,200 would suggest that something far more bearish is at play. We doubt that scenario. The major breakout comes above $1,350, preferably $1,370. Potential targets from this pattern are up to $1,750 with minimum objectives of $1,475.
©David Chapman
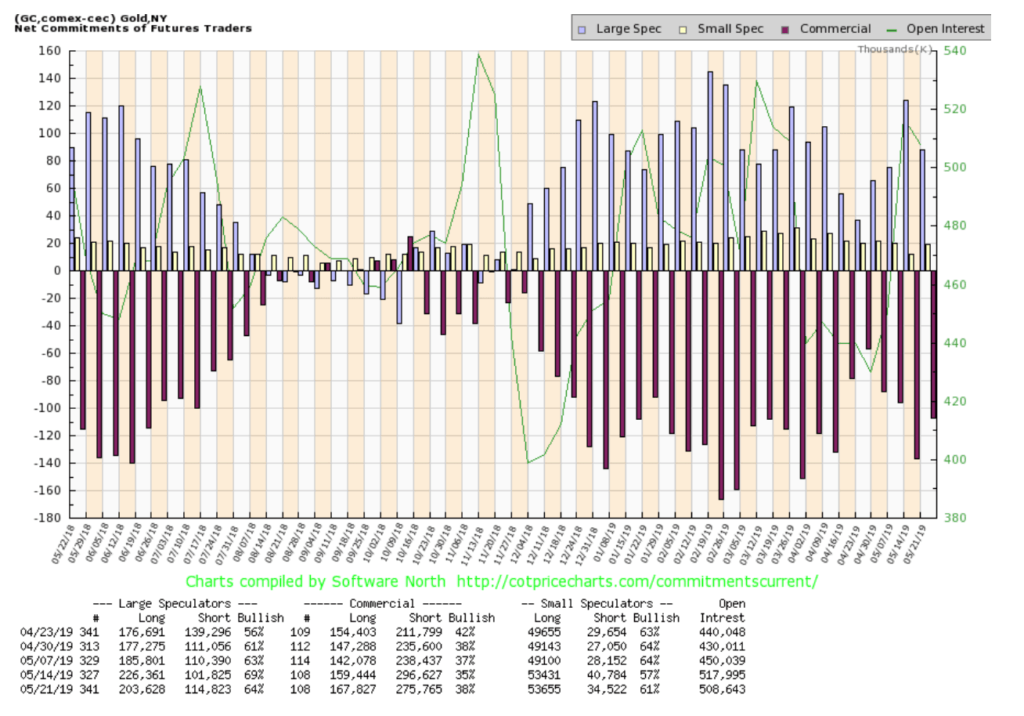
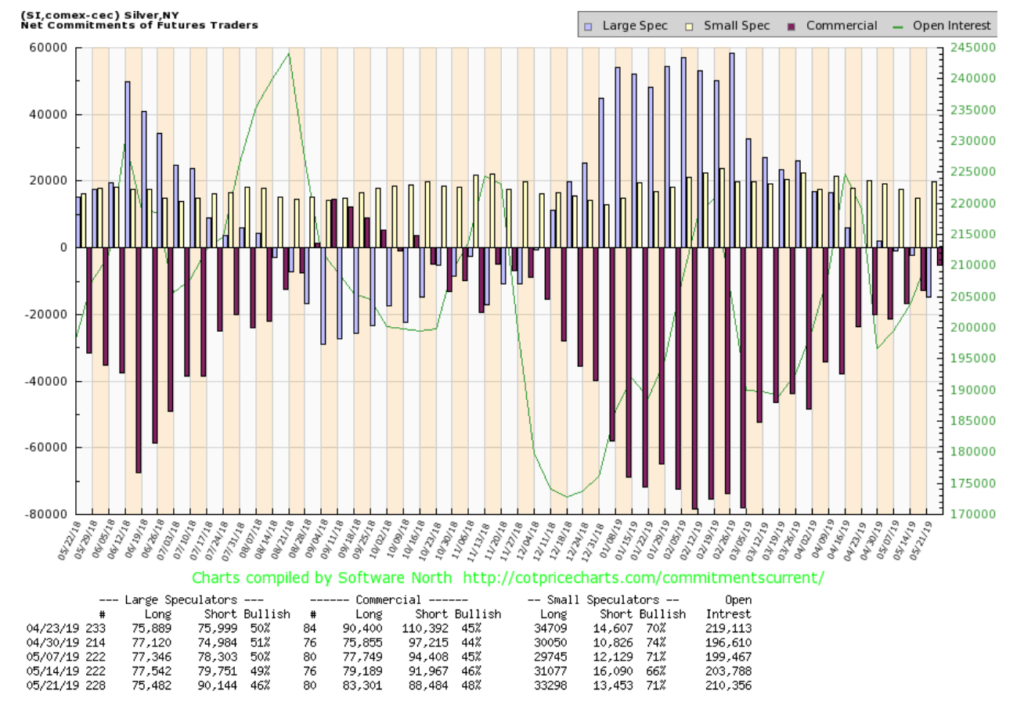
The gold commercial COT jumped to 38% this past week from 35%. Long open interest was up over 8,000 contracts while short open interest fell about 21,000 contracts. This is a positive development. Despite the improvement, the commercial COT is still nowhere near the levels recorded last August/October when gold last made an important low and before its more recent run to $1,350. The commercial COT reached to 50% and slightly higher than. We’d like to see that happen again. It would give us more confidence that we are likely making an important low. Gold sentiment has been waning but it is still not under 10%, levels often associated with key lows. The large speculators’ COT (hedge funds, managed futures, etc.) slipped to 64% from 69% as their long open interest fell about 23,000 contracts and short open interest jumped about 13,000 contracts. The direction on the COT is right but it is still not at levels where we would consider a low in.
©David Chapman
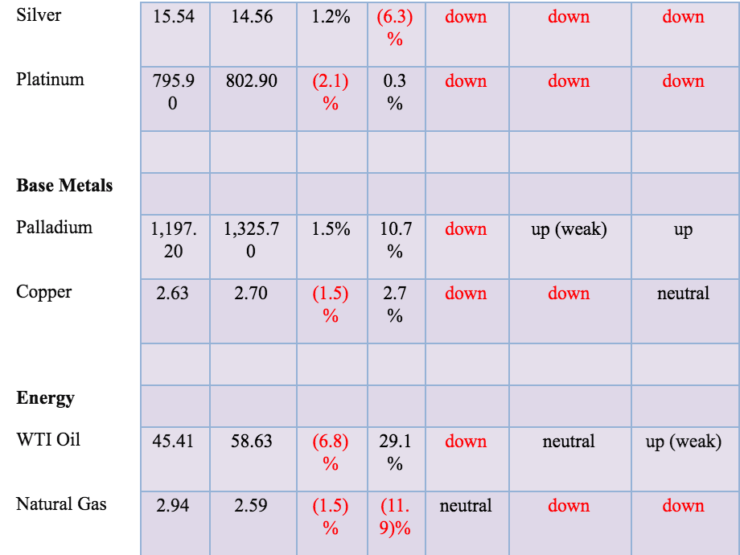
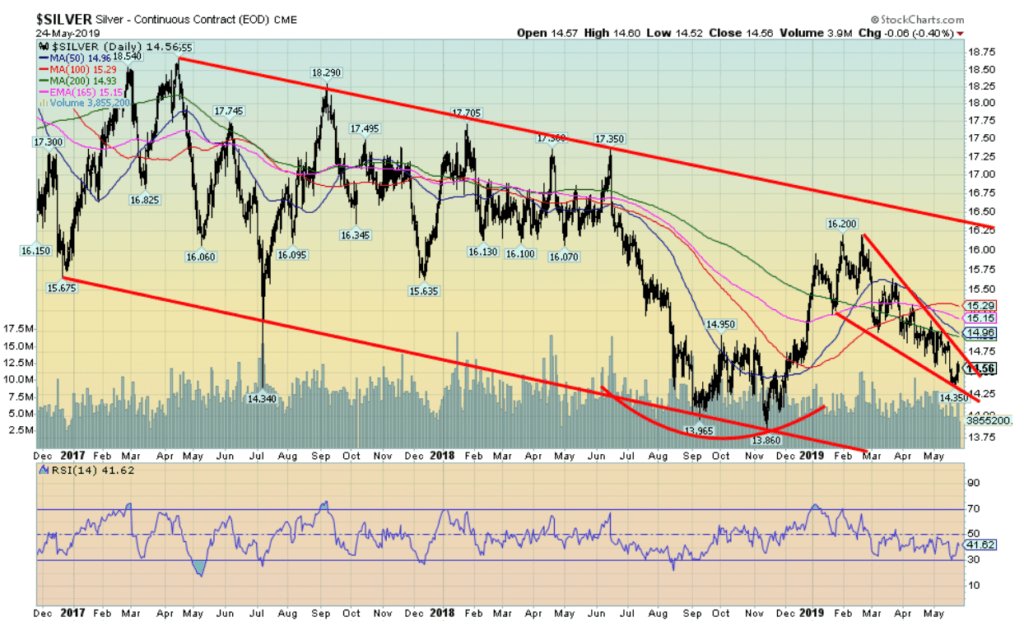
Silver prices fell to new lows for the move this past week at $14.35, then reversed and managed to close up at $14.56 putting in a gain of 1.2% on the week. A reversal week is positive; however, follow-through to the upside this coming week is essential if the reversal is to be confirmed. Silver continues to form what could be a descending wedge triangle (bullish). The triangle breaks out at $14.75 and suggests a move back to the recent highs over $16. A larger pattern that appears to be forming could suggest a move to $18.50 once the recent high of $16.20 is taken out.
Silver, like gold, remains in a seasonal weak period until at least mid-June. It can also last into mid-July. Ideally, we would like to see either gold or silver make new lows while the other does not. So far, silver has made new lows for this move but gold has still not made new lows. Given the waning volume, we believe that downside risk is lessening, but given the pattern, a decline to $14.25 is quite possible.
©David Chapman
The silver commercial COT jumped nicely this past week to 48% from 46% the previous week. Long open interest was up roughly 4,000 contracts while short open interest fell 3,500 contracts. We are not yet at levels over 50% that we saw last September/October before silver had a good run from about $14 to $16. The large speculators COT fell to 46% from 49% as their short open interest position jumped over 10,000 contracts and long open interest fell about 2,000 contracts. We view the direction on the commercial COT as positive for silver, but we may not yet be at a level that sees our final low.
©David Chapman
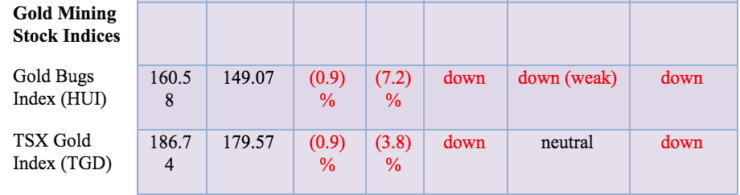
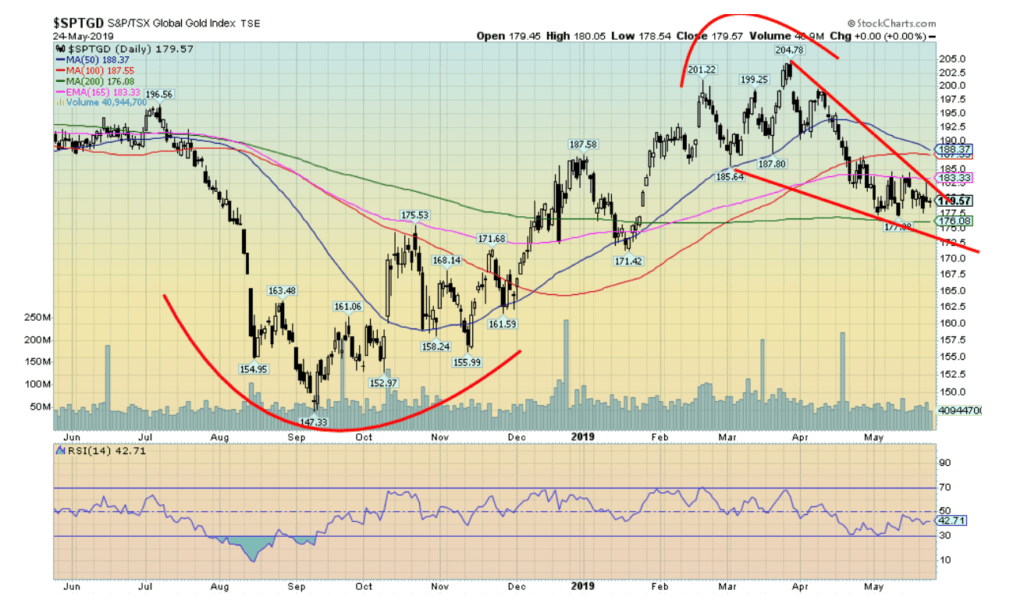
Despite an up week for both gold and silver, both the Gold Bugs Index (HUI) and the TSX Gold Index (TGD) were down on the week. Both indices fell 0.9%. With both indices down on the week, it raises the possibility that both gold and silver could fall once again. The gold stocks often lead both gold and silver. We note that the TGD appears to be forming a descending wedge triangle. If correct, we could see new lows near 172 before this move is over. Preferably the gold stocks do not make new lows even as gold and silver might. The TGD breaks out over 182, but we’d be more comfortable seeing the TGD break out over 188 to suggest the final low is in. As noted, downside appears limited now to around 172. The 200-day MA is currently at 176 and that too might hold any further decline. Quite a number of gold and silver stocks have been making new 52-week lows.
©David Chapman
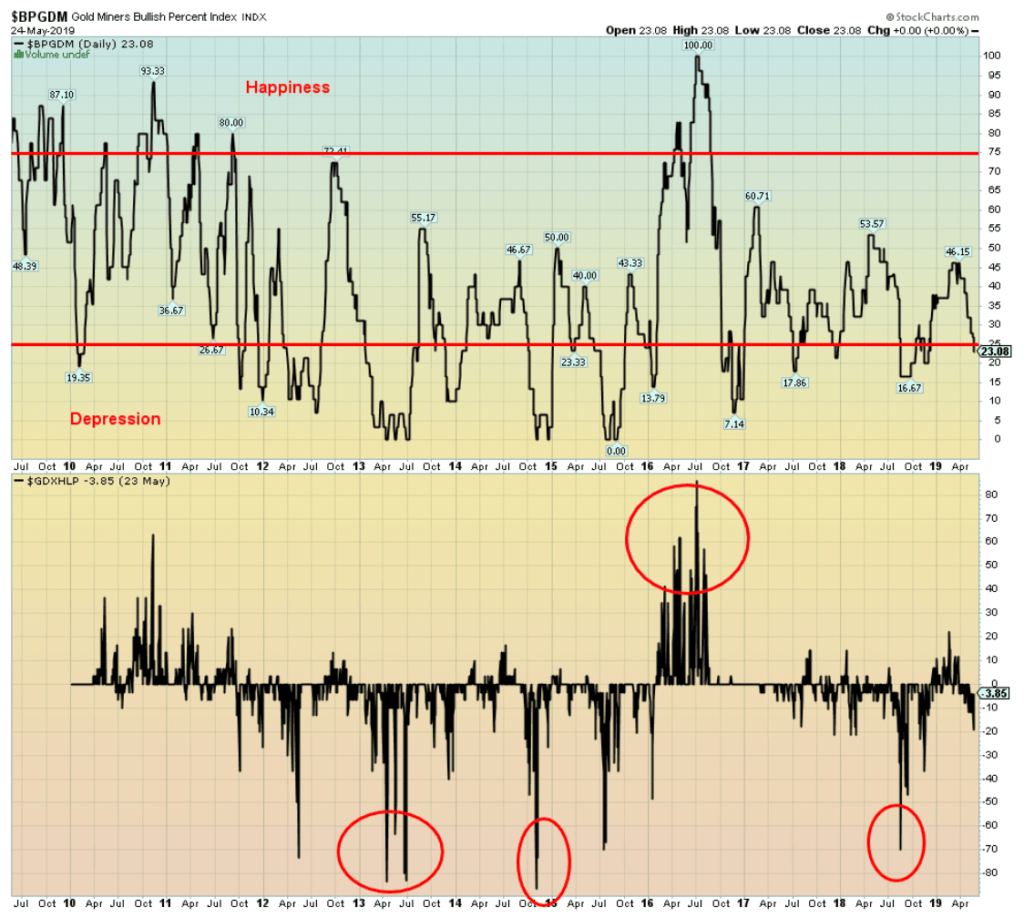
Sentiment on the gold stocks has fallen into what we have labeled as “depression” territory on the gold miners bullish percent index (BPGDM). Still, it is not at a level that might suggest a low. The gold miners’ new highs-new lows % index (GDXHLP) has fallen into negative territory but has not spiked low enough yet to suggest a final low. As the last few years show, the GDXHLP can remain below zero for quite some time before it returns to the upside. And sometimes the indicators don’t remain in negative territory for very long. Nonetheless, the indicators have now moved into negative territory and one can at least start to think about accumulating to ready oneself for the next up move. Interesting that these indicators are making or have made new lows but the HUI and the TGD are not.
©David Chapman
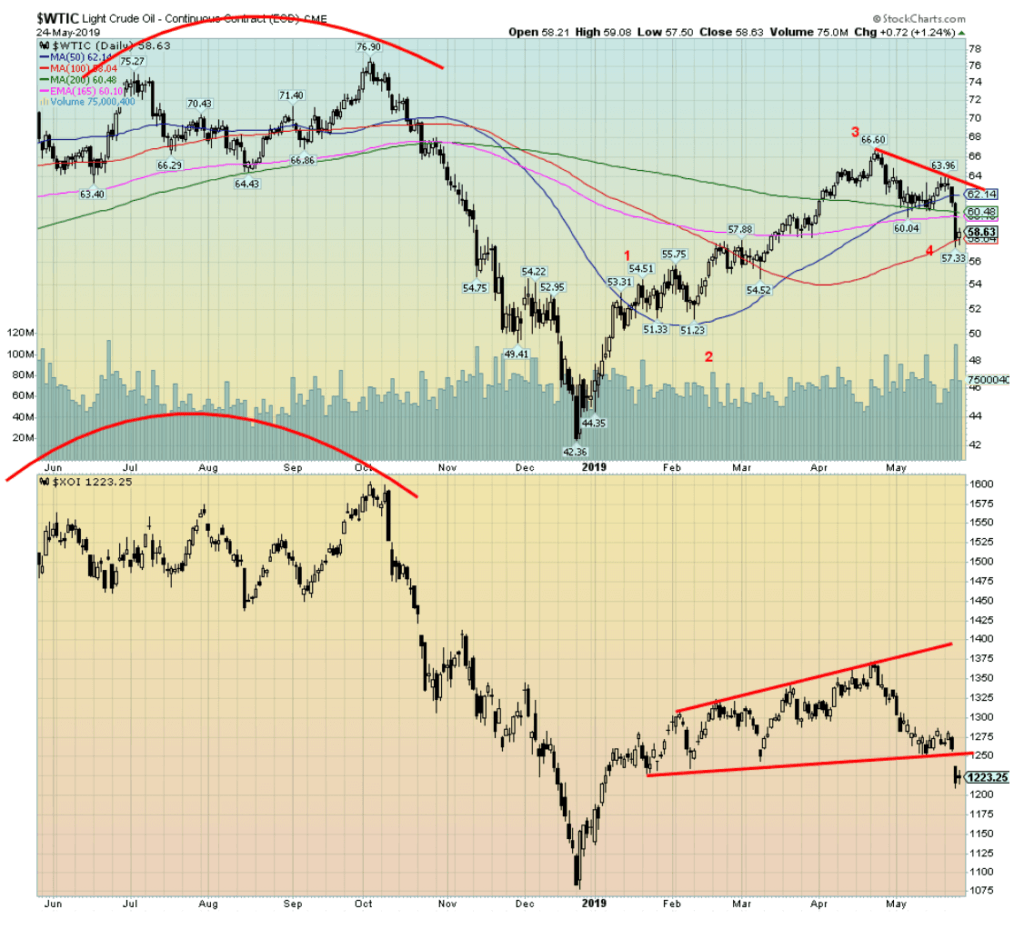
WTI oil and the energy stocks took the path of least resistance and that was down. Last week we mused as to whether the market could rise once more, and there was a case for it but acknowledged that since we were so close to breakdown that if we put in new lows we could fall quickly. We did. The Oil & Gas Index (XOI) did even gapping down on Thursday as WTI oil fell a sharp 5.7%. WTI oil wound up down 6.8% on the week. It was the worst week since December 2018. The XOI fell 3.4% while the TSX Energy Index (TEN) dropped 5.5%. Oil prices fell because of the U.S./China trade dispute and the fear that the dispute would slow the global economy down, thus lowering the demand for oil. Iran seemed suddenly very far away and not much of a consideration any longer despite the ongoing saber rattling.
Clearly, few believe anything will actually happen there. The question is, what next? WTI oil found support at the end of the week at the 100-day MA. Targets on the recent drop could be down to $56. With a low on the week at $57.33, we are not that far. As to the XOI, targets could be down to 1,150 while the TEN could fall to 127. Most minimum objectives appear to have been achieved given the sharp drop this past week. WTI oil needs to regain back above $62 to suggest that the down move is over and that we might make another assault on recent highs. If a 5-wave pattern is unfolding for oil to the upside then this is wave 4. If what we saw was an ABC correction then the top is in. However, only a breakdown under $51 suggests that new lows or at least, a test of those lows is possible. The world still has plenty of oil but both the Saudis and the Russians would like to see higher prices. Lower prices could jeopardize the shale industry in the U.S. given it is highly leveraged.
Chart of the week
This week’s “Chart of the Week” is not just one chart but a few charts to show what appears to be weakening in the U.S. economy. No, the economy is not about to slide into a recession but there are signs of weakening. Weakening has appeared in the past over the past decade since the “Great Recession” of 2007–2009 but each time things snapped back. The question is, will it snap back this time?
Retail sales month over month
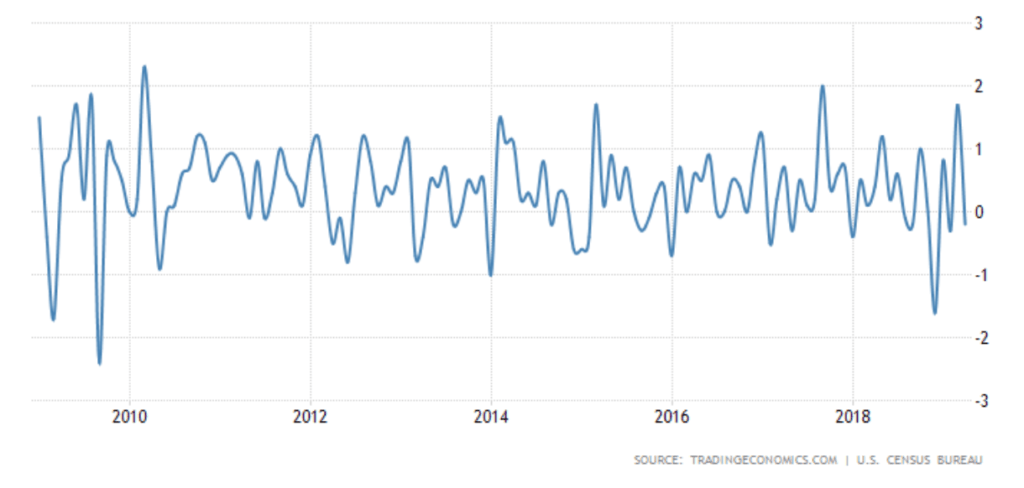
©David Chapman
Retail sales have been in a slow downward trend for the past year despite a spike in sale in March. March might have been a catch-up after weak sales in the previous few months. Retail sales in April 2019 fell 0.2% when the market expected a gain of 0.2%. Year-over-year, retail sales are up 3.1%. But note U.S. population is up 0.5% in the past year so one would expect retail sales to rise. Particularly weak were automotive sales. The effects of the $1.5 trillion tax cut are wearing off and the tariffs are beginning to kick in. Bad weather and continued flooding in the mid-west also hurt sales. The strong employment numbers helped buoy sales. Consumer spending accounts for upwards of two-thirds of economic activity.
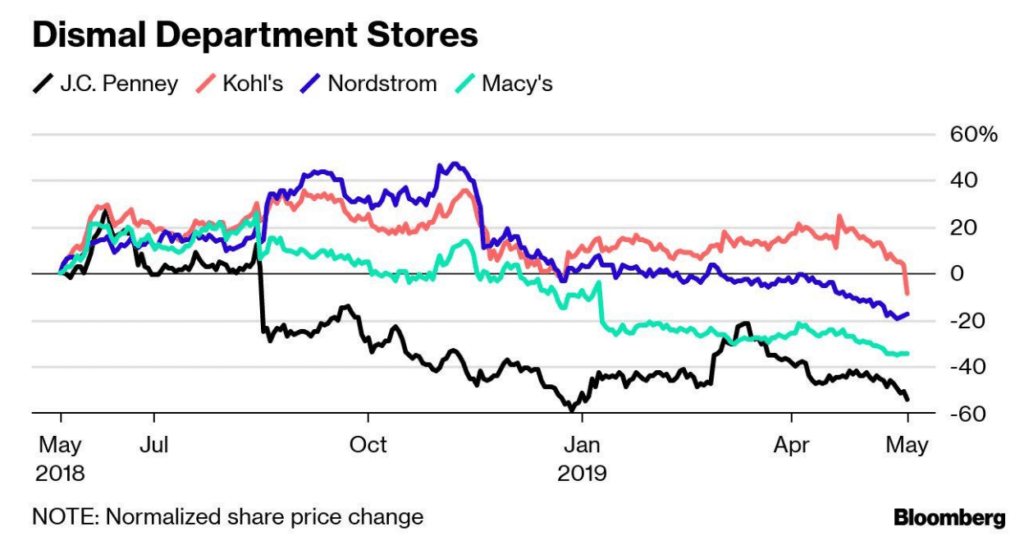
©David Chapman
Department store sales have been sliding for the past year, affecting the major consumer stocks as many have been hit hard lately. There are exceptions as Target has been beating estimates. Walmart has said they will be passing on the costs of the tariffs to consumers. That, in turn, could hurt Walmart sales. The trade war with China is biting into all retailers, given the amount of clothing imported that is “made in China.”
Construction spending
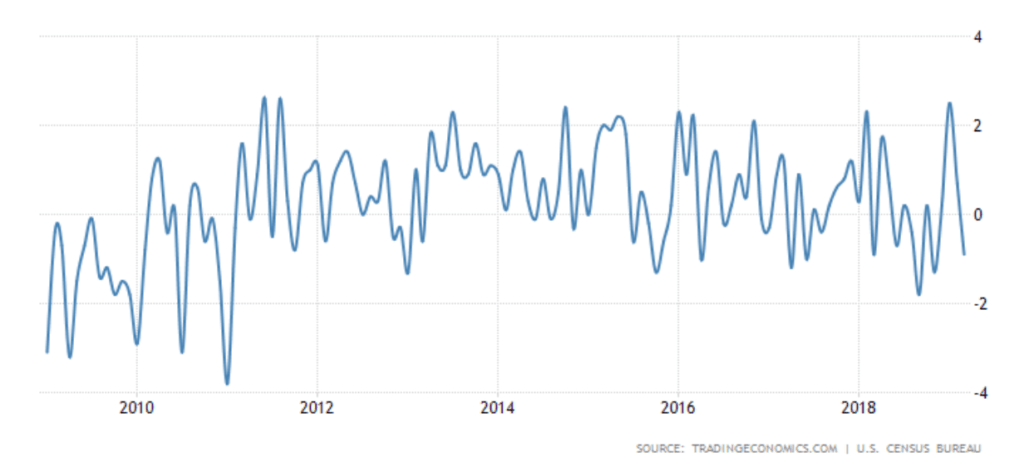
©David Chapman
Construction spending also has a downward tilt over the past year despite a spike in January. Construction spending fell 0.9% in March, quite a drop from the expected gain of 0.1%. It was the steepest decline in seven years. U.S. construction spending peaked in May 2018 at $1.324 trillion, but the most recent numbers were at $1.282 trillion. Not shown here is the breakdown between residential and non-residential construction spending. Residential construction is falling at a faster rate than non-residential. Residential spending is down 8.4% year over year in March while non-residential spending was actually up 4.8% and at a record high of $775 billion. But residential spending has fallen to $507 billion.
We also note that housing sales for both existing and new home sales are also softening over time with a downward trend. Prices have also been slipping as the Case Shiller home price index is off its recent highs. That may explain why mortgage rates are falling in an attempt to encourage house buying. Between housing and retail sales, one is looking at a big chunk of the economy.
—
DISCLAIMER: David Chapman is not a registered advisory service and is not an exempt market dealer (EMD) nor a licensed financial advisor. We do not and cannot give individualized market advice. David Chapman has worked in the financial industry for over 40 years including large financial corporations, banks, and investment dealers. The information in this newsletter is intended only for informational and educational purposes. It should not be considered a solicitation of an offer or sale of any security. The reader assumes all risk when trading in securities and David Chapman advises consulting a licensed professional financial advisor before proceeding with any trade or idea presented in this newsletter. We share our ideas and opinions for informational and educational purposes only and expect the reader to perform due diligence before considering a position in any security. That includes consulting with your own licensed professional financial advisor.


Graph Therapeutics Secures $5M to Advance AI-Driven Precision Therapies
Biotechnology company Graph Therapeutics raised 5 million dollars in a funding round led by Daphni, with support from existing investors....


DEA Hearing Signals Historic Turning Point for U.S. Cannabis Policy
The DEA has begun a key hearing on reclassifying cannabis from Schedule I to Schedule III, following a recommendation from...


Italy Leads Europe in Digital Sustainability Reporting for SMEs, EFRAG Finds
Italy leads Europe in digital sustainability reporting tools for SMEs, according to EFRAG’s second mapping of VSME platforms. The ecosystem...


RLUSD Launch in Japan Amid XRP Price Decline and Uncertain Outlook
Ripple and SBI launched the RLUSD stablecoin in Japan after JFSA approval, signaling strong progress in tokenization. However, XRP fell...


Youth Cannabis Use in Colorado Is Falling — But the Full Story Is More Complex
The 2026 Colorado survey shows teen cannabis use fell to 10 percent in 2025, down from 21 percent in 2015....
 |
|
 |  |
 |
|
-

 Impact Investing1 week ago
Coastal Cities Lead as Heat Strains Italy’s Urban Livability
-

 Fintech2 weeks ago
Trade Republic Brings Back Human Support and Launches Customer Council
-

 Biotech4 days ago
Eli Lilly Hits $1 Trillion Valuation Amid Strong Bullish Momentum
-

 Africa1 week ago
Moroccan Bond Market Shows Mixed Signals as Primary Eases and Secondary Pressures Persist