Featured
Stock market indicators mixed amid sluggish global economy, trade wars
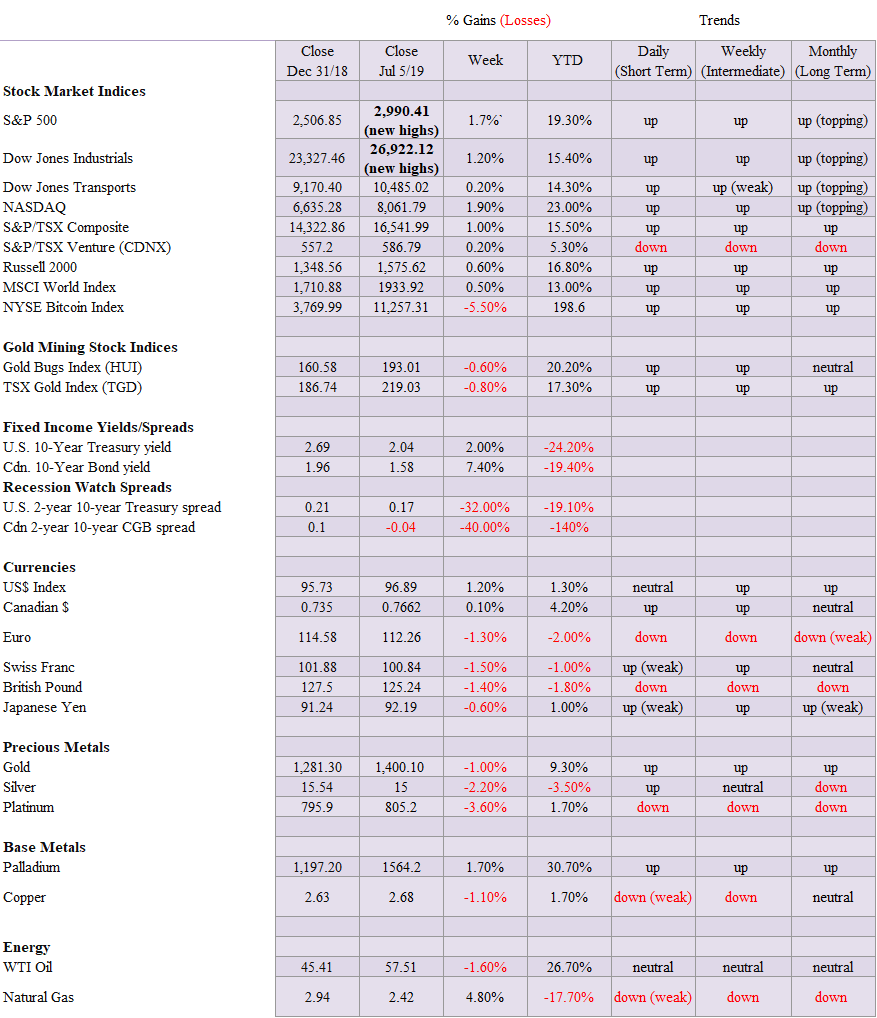
Another week of record highs. It is all playing out against the backdrop of a slowing global economy and rising trade and currency wars, despite the so-called rosy jobs report that came out on Friday in the U.S.

Gold is taking a needed breather but still looks higher. Stock market indicators are mixed with some suggesting higher while others are suggesting caution. Bond yields also ticked higher following the job numbers and thoughts of a Fed rate cut softened.
Our recession watch spread narrowed this week following the release of the June job numbers. While our traditional 2 year-10 year spread narrowed most others remained negative. In Canada, the 2 year-10 year spread did turn negative. Still a reminder that the spread can remain negative for months before a recession strikes.
We believe we are approaching a top in the market so some caution is suggested. But gold should soon resume its upward trajectory. When things are deteriorating markets turn to the safety of gold.
U.S. stock market and all-time highs
As the U.S. stock market indices steam their way to new all-time highs, we are reminded that this is occurring against the backdrop of a slowing global economy and declining bond yields that are supporting the move to slower growth and reduced expectations for future growth. The ECB is already loosening monetary policy as is PBOC while President Trump continues his attacks on Fed Chair Jerome Powell to cut interest rates.
In the latest salvo, Trump has nominated two more governors. One, Christopher Waller, is already connected with the Fed as director of research for the St. Louis Reserve bank president James Bullard. Bullard was the lone dissentifng vote for lower rates at the most recent FOMC. The other is Judy Shelton, an informal advisor to Trump, who has publicly supported lower rates. Shelton is also a firm proponent for a return to the gold standard. Twice before, Trump’s nominees failed to pass the Senate.
Two charts below show the slowing economy. Since the U.S. and China make up almost 39% of the global economy, it is not surprising that they should be our focus. Both the U.S. and China show a deteriorating manufacturing PMI. While the U.S. growth rate remains positive as does China’s, the Chinese economy is showing a faster rate of deterioration.
Signs of a slowing economy seem out of place when one looks at the latest job numbers released on Friday by the Bureau of Labour Statistics (BLS) (see Chart of the Week). The June surge seems to suggest that May’s slowdown in job growth was a fluke. Also, the U.S. just surpassed the longest period ever without a recession, again seemingly putting a lie to any slowdown.


Despite all of Trump’s maneuvering on the trade front, the U.S. balance of trade is actually deteriorating as this next chart shows. The U.S. balance of trade widened to $55.5 billion in May 2019. The market had expected $54 billion. The trade deficit with China actually went up to $30.2 billion despite the trade tariffs. In May, both imports and exports rose but imports grew faster.

All of this is coming against the backdrop of slowing global trade.

While the above chart is only good until January 2019, the numbers since then do not show any significant improvement and indeed may be worsening. Trade wars do not encourage global trade and, ultimately, they also negatively impact profits.
Aside from signs of a slowing global economy, the ongoing concern has to be the ongoing trade dispute between the U.S. and China. It actually goes deeper than just the trade dispute. China is on a mission to bring about the integration of Europe and Asia via its Belt and Road Initiative (BRI). It is the rebuilding of the ancient “Silk Road” that was a network of routes by land and by sea that linked Asia, the Middle East, Africa, and Europe.
Only a cynic would dismiss the U.S.’s involvement in the Middle East as a part of putting up roadblocks to China’s BRI. Countries such as Afghanistan, Iran, Iraq, and Syria are key cross points for the BRI. The U.S. believes China’s BRI is China’s route to global hegemony. At best it is challenging U.S. global hegemony. A host of Asian and African countries have already signed on to China’s BRI but European nations, mostly in the south, have also signed on. The most notable is Italy, a G-7 nation. But the BRI is now encompassing Latin American nations as well, right in the U.S.’s backyard. Antigua, Barbuda, Bolivia, Panama, Suriname, and Trinidad & Tobago have signed on. China has provided funding for projects in other countries including Brazil and Argentina.
It goes deeper, as in many cases, particularly in Africa, China has built military bases. And China’s close ally Russia has also involved itself militarily in Latin America by providing help to Nicaragua, loans to Cuba, and significantly soldiers and other military assistance to Venezuela, helping to prop up Maduro. Nothing could more in the backyard of the U.S. than that. Speaking of backyards, a reminder that U.S. led NATO is lined along the border of Russia in Europe and U.S. warships and warplanesthe regularly patrol the waters off of China including the Straits of Taiwan.
China inaugurated the Asian Infrastructure Investment Bank (AIIB) in January 2016 as a direct challenge to the U.S.-dominated World Bank and IMF. Several U.S. Asian allies including Philippines, South Korea, Thailand, Vietnam, and Singapore have joined the AIIB. And so did those outside of Asia, including the United Kingdom, Germany, Italy, Australia, New Zealand, and France. In Latin America, Brazil is a key member.
It goes further as China developed the Cross-Border Interbank Payment System (CIPS) as an alternative to SWIFT, the U.S.-dominated global payment system. This is particularly important as the U.S. applies sanctions against numerous countries that includes blocking them from SWIFT. CIPS is sometimes referred to as the China Payment System. Whereas SWIFT deals in US$, CIPS deals in yuan. The EU has also joined the fray as they created INSTEX—short for Instrument in Support of Trade Exchanges—in order to allow EU companies to deal with Iran.
It is again a workaround to SWIFT. Iran has been banned from SWIFT. How well it actually works is another question. The U.S. has vowed to apply sanctions on anyone using INSTEX to circumvent Iran sanctions. The number of countries and companies against which the U.S. has applied sanctions is growing and will soon encompass a huge portion of the world. In some respects, the U.S. is shutting itself out of the global trading system.
Trade blocs are emerging as the U.S. intensifies trade wars and sanctions. The EU, Mercosur in Latin America, Asian trading blocs dominated by China, and even the Trans-Pacific Partnership (TPP) are all trading blocs or emerging ones and interestingly all exclude the U.S. Currency wars are also escalating as the U.S. not only accuses China of currency manipulation they now apply that to the EU as well.
It all helps to put the slowing global economy and the U.S./China trade war in perspective. As we have consistently noted, there are no winners in trade wars or currency wars. Trade wars and currency wars have historically lead to real wars. Now that is something the world doesn’t need.
Markets and trends

This past week the Dow Jones Industrials (DJI) and the S&P 500 made new all-time highs. They weren’t exactly alone as the S&P 100 (OEX), the Russell 1000 and 3000, the NASDAQ 100 Index, and surprisingly the Wilshire 5000 also made new all-time highs. The Dow Jones Utilities (DJU) and the NASDAQ Composite both were just below their previous all-time highs. Many others did not, most notably the Dow Jones Transportations (DJT) as we note below. We are sharing various thoughts as to where we are. Elliott Wave analysis is useful, but it is difficult to calculate if you are a serious student and changing your wave count is not unusual. We are visual so we note the S&P 500 above appears to have made five waves up from the major low of March 2009.
Waves (1) and (2) were seen through the EU/Greek Debt crisis of 2011/2012 while this one suggests that Wave (3) topped in in October 2018. We still might be working on Wave (4) or it was completed with the collapse from October to December 2019. If that is correct, we are working on Wave 5 to the upside. It doesn’t mean it has to make screaming new highs but it could see further new highs even from here. Or this is a B wave of an ABC pattern and the A wave bottomed in December. The C wave is to come once this wave tops. Following the C wave another big wave up could get underway. Or as it suggests this wave up is the fifth wave. Which is it?

Our broadening top of the Dow Jones Industrials (DJI) continues to play itself out. For the record, the DJI was up 1.2% during this holiday-shortened week, making new all-time highs once again. The S&P 500 gained 1.7% while the NASDAQ was up 1.9%. The Dow Jones Transportations (DJT) gained a small 0.2%. The small-cap Russel 2000 was up 0.6%. Internationally, in the EU the London FTSE was up 1.8%, the Paris CAC 40 gained 1.1%, and the German DAX was up 1.4%. In Asia, China’s Shanghai Index (SSEC) fell 0.5% but the Tokyo Nikkei Dow (TKN) gained 1.9%. And for the record, protest-plagued Hong Kong saw its index rise 0.8%.
Here we are showing the action since the top in January 2018 as a large corrective pattern. The first wave down into December appeared to unfold as an ABC and the current wave up also appears as a large ABC pattern. The top of the channel is up around 27,400. That is not that far from Friday’s close of 26,922. The DJI hit 27,000 this past week, another milestone. What could follow a potential pending top is another decline. That would tally well with the traditional weak markets of August/September and a bottom in October. We say this despite indicators that we should continue higher.
The advance-decline line is still rising, the new highs minus new lows index remains positive, and our favourite—the McClellan Summation Index (ratio-adjusted), known as the RASI—has turned bullish, currently over 700. The RASI turns cautious under 500 and bearish under negative 500 although it also turns bearish under 0. However, momentum indicators are diverging as the market is making new highs but they are not. Daily Sentiment Indicators have reached highs with the S&P 500 at 88% and the NASDAQ at 90%. It just signals the market is quite bullish, it does not signal a top even as it suggests caution should be the order of the day. The advance has also become narrower as fewer stocks make new highs. A break back below 26,700 would signal that at least a short-term top is in.

Here is another look from the lows of February 2016. We have labeled events. A significant top was seen in January 2018 followed by a large ABC correction into December 2018. If this interpretation is correct, then we are approaching the top of Wave 5 to the upside. Note the RSI is also getting high at 69 but not extreme until it goes over 70. We note the declining volume to the upside. There may well be more upside in this market, but everything we look at suggests that we could be approaching a significant top. The major indicator that keeps this market alive is the NYSE advance-decline line that continues to surge to new highs. But could it be misdirecting us? It has happened before, back in the late 1970s.

We continue to follow the DJI and the DJT for market confirmation. The picture remains the same. The indices continue to not confirm each other. While the DJI made small new highs this past week the DJT is nowhere near its highs of 2018. In fact, it remains below highs seen in early this year in April. Dow Theory states that the indices must confirm each other. Failure to confirm could suggest a change of trend is imminent.

The Baltic Dry Index (BDI) is reported daily by the London-based Baltic Exchange. It is a proxy for dry bulk shipping stocks and general shipping market behavior. We have noted lows were made on the BDI at the time of the 2008 financial crisis, the 2011–2012 EU/Greek debt crisis, and when the Fed ended QE in 2015–2016. The most recent lows were seen in the trade war panic of late 2018. Since then, the index has been rising, suggesting an improvement in global shipping. However, since a top back in 2009, the highs have been consistently lower. The most recent low was the first time we did not see new lows since the 2008 financial crisis. We are approaching that downtrend line so it will be interesting to see if it can break above it. Over 1,600 would seal the breakout.

The global MSCI World Index (ex U.S.) has been moving higher, but it is struggling. We appear to be in an up channel but could also now be forming an ascending wedge triangle as we move higher. The top of the current channel is just over 1,980, so one should keep an eye on this index as a proxy for the rest of the world.

The TSX Composite gained about 1% this past week and remains well within what appears to be a huge broadening channel. The top of the channel is up above 16,800, so in theory, the TSX could still run up another 300 points. Currently, the TSX sits just below its all-time high of 16,672 seen back in April 2019. Volume on the rise continues to be lethargic so that keeps us believing this rise is nothing more than a corrective or even a sucker’s rally. The TSX’s bullish percent index BPTSE sits at 60% well below its highs of 2014 at 84.50%. The last high in the index was seen back in August 2016 near 82%. Since then the index has been making a series of falling highs, suggesting to us that despite the index itself rising to new heights it is not been confirmed by some of its indicators.
The TSX has been led by Income Trusts, Utilities, Telecommunications, Real Estate, and, to a lesser extent, Consumer Staples. The mining sector—Gold, Metals & Mining, and Materials—is in early up stages and could be considered an early new leader, while Financials, Health Care, and Consumer Discretionary have been up but are now moving sideways. Energy has been a drag on the index and remains that way. The TSX Composite is struggling right now but we believe it still has room to move higher; however, one should be very cautious given it is late in the game.

We are maintaining our Bitcoin watch, especially since Bitcoin has decided to take off into the stratosphere once again. We may have hit a temporary top at $12,802. We can discern five waves up from the low of $3,251 seen in late 2018. It has been quite a run as Bitcoin is up almost 200% in 2019. Bitcoin remains highly speculative; liquidity is a potential issue as are hackers and scams. Support can be seen back to $9,000 but below that level, a decline towards $7,000 can’t be ruled out. Bitcoin’s market cap has surged to $205.4 billion in a market where the entire crypto universe has a cap of only $328.3 billion. Bitcoin is 62.6% of the entire market.
Apple’s market cap of $940 billion is almost three times the market cap of the crypto world. There are now 2,320 different cryptos listed at Coin Market Cap. Incredible! And there are 19 with a market cap of $1 billion or more. Strangest story of the week—an Australian couple was scammed out of $20,000 and the perpetrator taunted them. Beware the crypto market. Even Dogecoin (DOGE), which was introduced as a joke currency, has a market cap of $440 million.

The 10-year U.S. Treasury note fell under 2.00% to a low of 1.96% this past week, the lowest level since September 2017 when it hit 2.05%. The stronger than expected U.S. job numbers sent yields up (prices fell as prices move inversely to yields) and the 10-year closed at 2.04% on the week. The stronger than expected June job numbers lessened the odds that the Fed would cut rates at the July FOMC. Resistance, as we can see, is way up at 2.25% and the falling 50-day MA. It is possible that we have now bottomed for this phase.
The all-time low in yields was seen in July 2016 at 1.37%. We have noted in the past that we believe yields have made an important cyclical low back in 2016. However, the high of 3.24% came in roughly 18 years following an important high for yields in early 2000. The 18-year cycle appears to be alive and the next one is not due until 2035. However, the 18-year cycle does subdivide into three 6-year cycles, so the next high in yields is due in 2024 +/- 1 year.
Recession watch spread

The traditional 2-year U.S. Treasury note—10-year U.S. Treasury note spread dropped this past week to 17 bp as the 2-year was up more than the 10-year after the release of the June job numbers. The odds of a Fed cut at the July FOMC have fallen sharply. A breakdown under 15 bp could send the spread hurtling once again towards zero. This spread has held up remarkably well as it remains positive, even as others have all turned negative.
Recession Watch Spread 2

We started watching the 10-year U.S. Treasury note—3-month U.S. Treasury bill spread as an alternative to the traditional 2–10 spread. This spread has been negative since late May and is currently at negative 19 bp. Historically, that points to a potential recession but one that could still be months away.

Here we are showing the S&P 500 against the backdrop of the 10-year 3-month spread. Note that in 2006 the 10–3M went negative in August 2006, yet the S&P 500 continued to rise into October 2007. The spread turned positive in June 2007 just before the S&P 500 made its first drop and even as the final high was still a few months away.
This time the 10-3m spread turned negative in late May 2019. We may have over a year of the S&P 500 ultimately working its way higher if the 2006–2007 pattern plays itself out. The 10–3m spread turned negative in June–July 2000, just before the S&P 500 made its final high. The events of 9/11 actually helped turn the spread positive once again. It is difficult to predict what will happen this time. A largely coincident top or a top that is still months away?

The US$ Index had a good week, especially on Friday after the release of the June job numbers that came in higher than expected. That was good news for the US$, as the expectation now was the Fed would hold the line on any interest rate cuts at its July FOMC. While Friday’s gain for the US$ was strong, it is noted that many traders were away for a long July 4 holiday weekend. Volume was thin so it wouldn’t take much to move it higher. Nonetheless, we expect the US$ to labor from here. The 50-day MA is just above at 97.03. It is possible that the US$ fell in five waves from the May 23 high at 98.26. We are now embarking on a corrective pattern that could last through July before the decline continues. There is resistance up to 97.20 and above that at 97.45. Above 97.50 a test of the 98.23 high is possible. Under 96 the decline should get underway once again. The US$ Index breaks down under 95.

Gold has finally started to work off some of its overbought condition. The RSI had stayed over 70 for most of June. In that respect, the decline this past week has to be viewed in a positive light. We note that, despite the spook from the higher than expected U.S. job numbers, gold managed to hold the line at $1,400. It had, earlier in the day, fallen to a low of $1,388. As we note in our Chart of the Week, the job numbers are as usual somewhat misleading and tend to mask a deteriorating situation. Gold held at $1,400 and the gold stocks closed down less than 1% on the week.
A pause was needed because the market had become overbought and bullish speculation was rising. Gold did achieve one target at around $1,435 (high was $1,442) but higher targets remain. The cup and handle pattern suggests potential targets up around $1,515, and longer-dated patterns formed over the past several years suggest targets up to around $1,725. We wouldn’t be surprised if the first wave up ended somewhere between $1,500 and $1,550 before a longer correction set in. Following that correction gold could embark on its next leg to the upside with the targets of $1,725. New highs above $1,442 would suggest we are on the next leg up towards $1,500. There is a major support for gold down to around $1,370.

We thought we’d emphasize the fact that while gold in US$ remains roughly $500 below its all-time high, that is not the case for gold in other currencies. We live in Canada, so gold in Cdn$ has some meaning to us. On Friday, we closed at $1,827 and that is less than $100 from its all-time high seen in 2011. Gold has broken out in euros, yuan, yen, Swiss, and Aussie$. This massive triangle formed by gold in Cdn$ suggests a potential ultimate price of over $2,400, another 33% move from current levels. That would translate into even more for the gold stocks as represented by the TSX Gold Index (TGD). First, however, we need to see new all-time highs and then the target price begins to look more plausible.

Because of the July 4 holiday in the U.S., this week’s COT report is delayed until after market on Monday, July 8. Last week’s report saw the commercial COT for gold stay at 28%. However, there were shifts as long open interest jumped almost 19,000 contracts even as short open interest leaped by almost 55,000 contracts. Quite the contrast. The large speculators COT (hedge funds, managed futures, etc.) rose to 83% from 80% as long open interest leaped almost 26,000 contracts and short open interest fell about 9,000 contracts. The large speculators are getting too bullish, so maybe this week’s small decline in gold wasn’t really a surprise.

Silver prices did not fare well this past week, falling by 2.2%, outperforming gold prices to the downside. In closing down to $15 silver left us in a quandary as to the next move. We closed near support of the 50-day MA (currently $14.86), so it is possible to test a bit lower and still not take out the key MA. Volume has fallen on this pullback which is positive. Bullish sentiment has also fallen quickly. Silver is clearly outperforming gold to the downside. We appreciate silver’s leadership, but we need this outperformance to the upside as well. It is possible that we could form an awkward-looking head and shoulders bottom. We’d like to see silver hold above $15 on a close basis. Friday’s low was seen at $14.91.

The last reported silver COT showed the commercials dropped precipitously to 37% from 42%. Sure enough, silver prices fell this past week. Long open interest dropped by roughly 10,000 contracts while short open interest rose around 9,000 contracts. The large speculators COT jumped to 59% from 54%.

The gold stocks, as represented here by the TSX Gold Index (TGD), continue to look good. This past week the TGD lost a small 0.8% while the Gold Bugs Index (HUI) was off 0.6%. Both remain well up on the year with the TGD up 17.3% and the HUI up 20.2%. Many individual gold stocks have done better than that even as many continue to lag. We like the fact that, despite the pause over the past week and a half or so, the TGD has held what appears to be a measuring or runaway gap. It is also holding above the trendline drawn from the February and April highs. It bounced off the line on Friday as the TGD (and the HUI) closed well off their lows even if they were down on the day and the week. This pause takes away some of the bullishness which is a good thing. The chart continues to indicate that TGD is going higher. The measuring gap suggests potential targets up to 238/240.

To attack Iran, or, not to attack Iran—that is the question (with apologies once again to Shakespeare). Despite all the rhetoric, an attack on Iran is probably not imminent, if at all. But that doesn’t mean mischief doesn’t occur in the world’s hottest oil conduit. The latest is the seizure of an Iranian oil tanker destined for Syria, seized by the U.K. as it was going through the Straits of Gibraltar. Now Iran is threatening to seize U.K. oil tankers. As we said, mischief is afoot here. But oil prices have rolled over. We note the drying volume on the recent rise. If a real breakthrough was about to happen volume would be rising, not falling. Instead, volume rose on the recent decline towards $50. The trend is down for now. A breakdown under $50 and WTI oil is probably headed for a test of the lows of December 2018 near $42. Triangles tighten. WTI oil really only breaks out above $64 and for the XOI above 1,300. We await a bottom in WTI oil.
Chart of the wffffffffeek

It must be that time of the month again. The monthly employment data. It was a surprise. Nonfarm payrolls surged in June in the U.S. by 224,000 above the expected 160,000. That was a far cry from May’s gain of 75,000. Overall, April and May’s numbers were revised downward by 11,000. That meant that average job growth in the first six months was 172,000/month vs. 223,000 in 2018. Job growth has slowed down.
The unemployment rate (U3) notched higher at 3.67% vs. 3.62% in May. That was primarily due to a surge of workers looking for working as the labor force participation rate rose to 62.9% vs. 62.8%. It was 63.1% in December 2018. Overall, what that means is that since the end of the year fewer people are looking for work which lowers the labor force. The result is, the unemployment rate falls. It cleverly covers up deterioration in the economy. That shows up in the 335,000 gain in the size of the civilian labor force. Civilian employment rose 247,000 during June. But we also note that since the end of 2018 the civilian labor force has actually fallen 259,000.
If there was a bright spot, it was that full-time employment rose 453,000 while part-time employment fell 174,000. The civilian employment-population ratio remained unchanged at 60.6%. That ratio peaked in 2000 at 64.4%. Again, fewer people actually working translates into a lower unemployment rate. The ratio hasn’t even recovered its pre-financial crash 2008 level of 63.3%.
The U6 unemployment rate, which includes short-term discouraged workers and other marginally attached workers, including those working part-time that prefer full-time, rose to 7.23% from 7.09% in May. The Shadow Stats number that is U6 plus long-term discouraged workers, plus those defined out of the labor force in 1994 rose to 21.2% from 21.1%.
With the force actually showing signs of contraction rather than expansion, that may explain why wages are being held down. The rise in wage growth was 1.5%, its weakest since January 2018. Year over year, job growth as measured by both the establishment survey (survey of business and government agencies) and the household survey (survey of actual households) are both showing a downward trend. The U.S. Coincident Employment Index has also been showing a downward trend and has hit its lowest level since 2013.
The stronger than expected nonfarm payrolls have put thoughts of a possible rate cut at the July 30–31 FOMC on hold. Suppressed wages, on the other hand, could still get the Fed to act—that, along with concern about low inflation and the ongoing U.S./China trade war. Constant pressure from President Trump to lower rates also plays into this.

Canada reported that they lost 2,200 jobs in June. The market had expected a gain of at least 10,000. But it did have a silver lining as full-time employment rose 24,100 while part-time employment fell 26,200. The unemployment rate rose to 5.5% from 5.4% even as the labor force participation rate remained unchanged at 65.7%. Note Canada’s higher participation rate. That translates into a higher unemployment rate than in the U.S. Canada has added 421,000 jobs in the past year according to StatsCan. In 2019 Canada added 248,000 jobs, the best 6-month growth stretch since 2002. Wage overall also ticked higher, up 3.8% year over year in June. It was the second-best reading in a decade. If there is a problem with the wage gains, it is that the top end has done well while the lower end has fared not so well. Overall, this report is not going to encourage the BofC to cut rates in July.
__
DISCLAIMER: David Chapman is not a registered advisory service and is not an exempt market dealer (EMD). We do not and cannot give individualized market advice. The information in this article is intended only for informational and educational purposes. It should not be considered a solicitation of an offer or sale of any security. The reader assumes all risk when trading in securities and David Chapman advises consulting a licensed professional financial advisor before proceeding with any trade or idea presented in this article. We share our ideas and opinions for informational and educational purposes only and expect the reader to perform due diligence before considering a position in any security. That includes consulting with your own licensed professional financial advisor.


Bitcoin Stalls Near $60K as Strategy Moves, ETFs Outflow, and EU MiCA Rules Take Effect
Bitcoin hovers near $60,000 with ETF outflows, while Strategy boosts reserves, sells BTC, and raises dividends to reassure investors. Ethereum...


Cannabis Dominates Global Drug Use: Trends, Risks, and Shifting Markets
Cannabis remains the world’s most widely used illicit drug, with 256 million users in 2024, surpassing all others combined. Growth...


Italy Approves First Hydrogen-Powered Train for National Rail Network
ANSFISA has approved Italy’s first hydrogen-powered train, the Alstom HMU214, for use on the Brescia–Iseo–Edolo line. Capable of 140 km/h,...


Cotton Market Weakness Persists Despite Brief Rebound
Cotton prices fell to new lows last week before a modest rebound. USDA data shows crop conditions remain worse than...


Eli Lilly Hits $1 Trillion Valuation Amid Strong Bullish Momentum
Eli Lilly stock hit a record high, surpassing $1 trillion market value after strong product demand. Shares surged over 7%,...
 |
|
 |  |
 |
|
-

 Fintech1 week ago
Mollie Expands Across EEA With €350M Investment to Strengthen European Payments Network
-

 Cannabis2 weeks ago
Europe’s Cannabis Shift: Rising Use, and New Risks
-

 Crowdfunding5 days ago
AI Venture Builder Launches €600K Crowdfunding Round to Scale Secure AI Solutions
-

 Impact Investing2 weeks ago
AI Adoption in Italian Retail Stalls Despite Strong Experimentation