Featured
US-China trade dispute continues to disrupt stock markets
Perception is everything and any suggestion that the two parties are still talking, the stock market rallies.

As a result, it was a very whipsaw week. Other signals are mixed as well leaving us examining support/resistance for clues as to the next move. Recession? What recession. No sign yet of any recession according to the 2-10 spread. Consumer confidence hit its highest in years but that was before the latest round of U.S.-China trade spat.
The precious metals fell again and silver made new lows for the current move. But gold and the gold stocks did not. A divergence? Monday is the Victoria Day holiday in Canada and a week after Monday, the U.S. has its Memorial Day holiday.
Is everyone enjoying the volatile whipsaw market?
When China announced it will raise tariffs on $60 billion of U.S. goods starting June 1, 2019, the markets cratered on May 13, 2019, by some 2.5% from the close of May 10, 2019. Three days later they were up 2.8% from the May 13 low. Traders could be excused for feeling whipsawed.
There appears to be no easy solution to the trade dispute between China and the U.S. As we previously noted, the U.S. wants to tie down ironclad agreements. The U.S. alleges that China has been stealing technology and forcing foreign companies to hand over trade secrets. They also claim that China has failed to open up its economy and allow more political freedoms as was expected when China was admitted to the World Trade Organization (WTO) in 2001.
China does not want agreements imposed on them that would make them appear acquiescent. China has a long memory of attempts by foreign powers to control them during the 19th century. The Opium Wars between the Qing Dynasty and Great Britain (First Opium War 1839–1842, Second Opium War 1856–1860) were trade disputes involving tea and opium. Many studies have concluded that before the Opium wars China’s economy was the largest in the world and had been for centuries. China was also a net exporter and had large trade surpluses with most Western countries. After the wars, China’s economy was effectively cut in half and they were forced to acquiesce to the Great Powers at the time (Great Britain, U.S., Russia, France, and, later, Japan).
This eventually led to the Boxer Rebellion of 1899–1901 where Chinese rebels fought the Great Powers. The rebels lost, which led to the collapse of the Qing Dynasty in 1912, followed by years of civil war and war (WW2), then followed again by civil war and the “Great Leap Forward.” The period lasted roughly fifty years from the end of the Qing dynasty in 2012 until the early 1960s. The period was characterized by the death of tens of millions due to war and famine.
Today, as the world’s second largest economy, China has been challenging U.S. supremacy and hegemony; for example, through the Belt and Road Initiative (BRI) and the setting up of counterparts to Western-dominated institutions such as the World Bank and the IMF. China is also aiming to establish the yuan as a global reserve currency. To do this, they have been building up their gold reserves. The yuan also makes up almost 11% of the IMF’s Special Drawing Rights (SDR) having been added in 2015. The other currencies making up the SDR are the U.S. dollar, the euro, the Japanese yen, and the pound sterling.
The U.S. has moved to economic warfare to try to pressure countries into conceding to U.S. demands. With China it is tariffs, but with others such as Russia, Iran, and North Korea they use economic sanctions. The U.S. has even threatened tariffs against the EU and it was the delay of those tariffs that helped spark a market rally on May 16, 2019. The U.S. also uses the threat of military action without actually doing so (Geopolitical Futures—May 14, 2019) as part of their strategy. China’s attempt to break out of the South China Sea is to ensure the safe passage of its exports. However, the U.S. wants to ensure its dominance of the Western Pacific; hence, their large military buildup in the area. The U.S. is also building up its military presence in the Gulf region (Iran) and, along with NATO, the border of Russia in Europe as well as in the Baltic and Mediterranean seas.
The U.S. is the world’s largest military power, and the world’s largest economy and importer. The world deals with the U.S. but increasingly with China as well. The two have considerable incentive to resolve trade disputes. Two-way trade between the two is roughly $660 billion (2018). China’s trade with the U.S. totals about $540 billion, representing some 19.0% of China’s exports. On the other hand, the U.S. exports roughly $120 billion to China, representing about 8.6% of its exports. The U.S. trade deficit with China is about $419 billion (2018).
China exports computers and electronics, clothing, machinery, electrical equipment, and more. The U.S. exports transportation equipment, computers, and electronics, oil and gas, farm crops, plus more. Each can hurt the other. U.S. companies are preparing to pass on the cost of the tariffs to consumers. China has stopped buying U.S. food crops (soybeans, pork, etc.), hurting the midwest farmers. The U.S. has had to provide a huge subsidy to bail them out.
The Chinese economy is decelerating and the trade war with the U.S. is hurting consumer and business confidence. China’s Shanghai Index (SSEC) has recently fallen almost 11% since the recent round of trade wars got underway. PBOC, China’s central bank has been easing credit conditions to combat the effects of the trade war. The yuan (See Chart of the Week) has fallen to its lowest level since the October/December 2018 mini-crash. The fall should help Chinese exports but is negative for the huge amount of Chinese debt denominated in U.S. dollars. Trump continues to pester Fed Chair Jerome Powell to cut interest rates to help the U.S. economy. The U.S. stock market has faltered despite this past week’s rebound. On May 17, 2019, the market fell once again to the downside then rebounded once again.
Nobody expects this to be resolved overnight. Both China and the U.S. have vital interests and it is to the benefit of both parties to find common ground. Both their economies depend on it as does the global economy. Numerous smaller countries (economy) are caught in the middle of this epic battle between economic giants and are being forced to choose sides. The health of the global stock markets also depends upon it. Talks are supposed to resume, with Trump and Xi planning to meet at the G20 summit in June in Osaka, Japan.
The two sides need to ensure this doesn’t escalate. The banning of China’s Huawei from 5G and selling its gear along with threatening its supply chain is not going over well in China. It hasn’t gone over well in the U.S. either, hitting U.S. chipmakers. Other countries have joined the ban but many have not. Combine all of these tensions with military pressures and the risk of an accident is high. The same could be said about the confrontation with both Russia and Iran. The global economy is dependent upon the two to resolve their differences.
Markets and trends
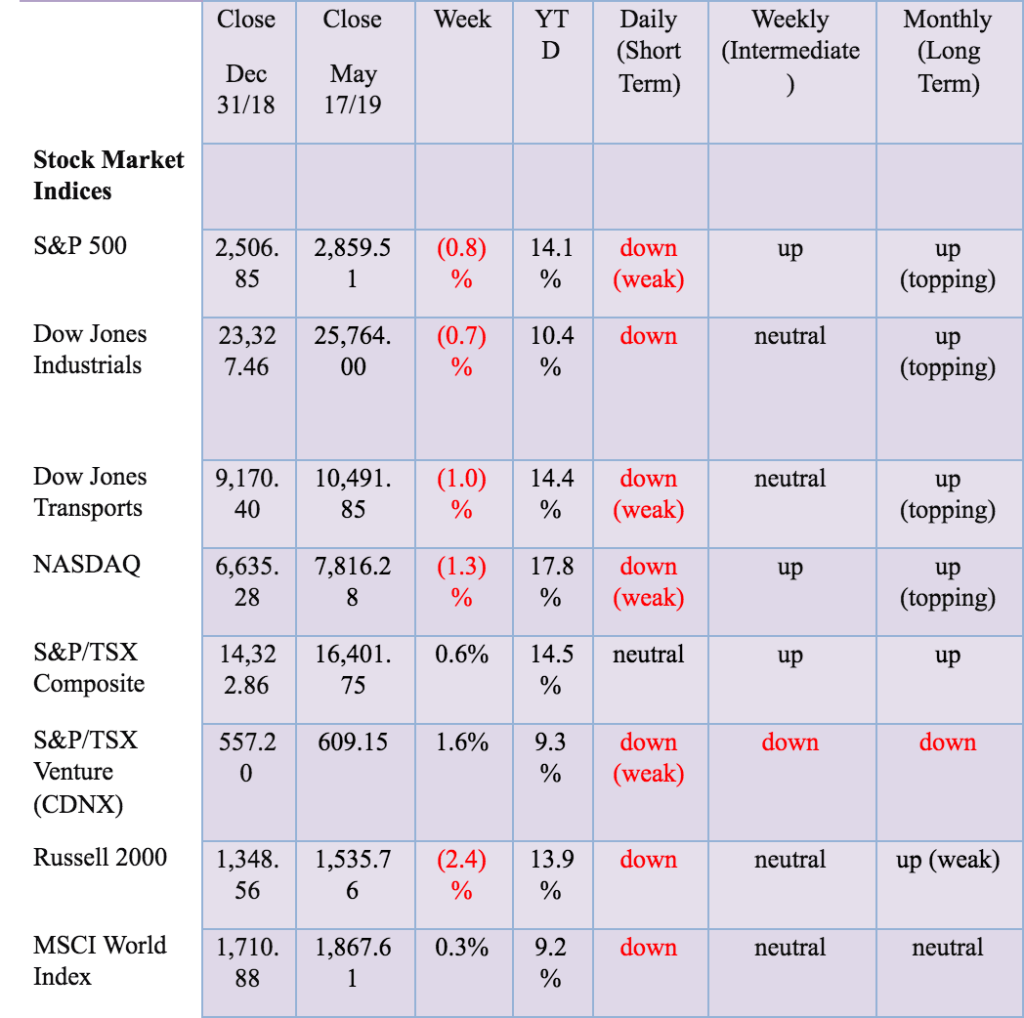
% Gains (Losses) Trends
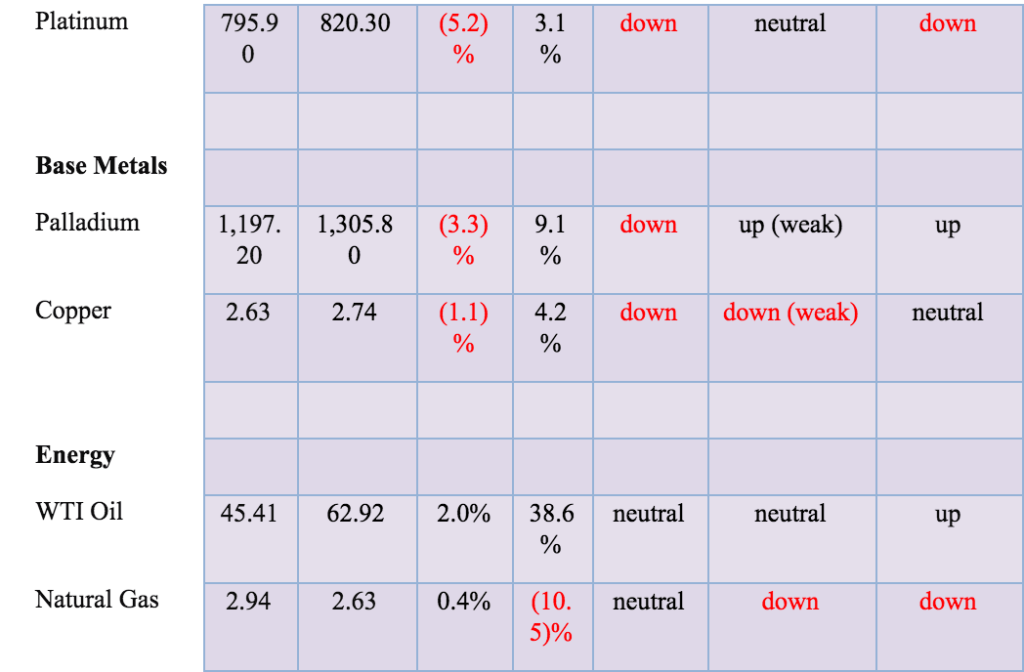
*New highs/lows refer to new 52-week highs/lows. ©David Chapman
©David Chapman
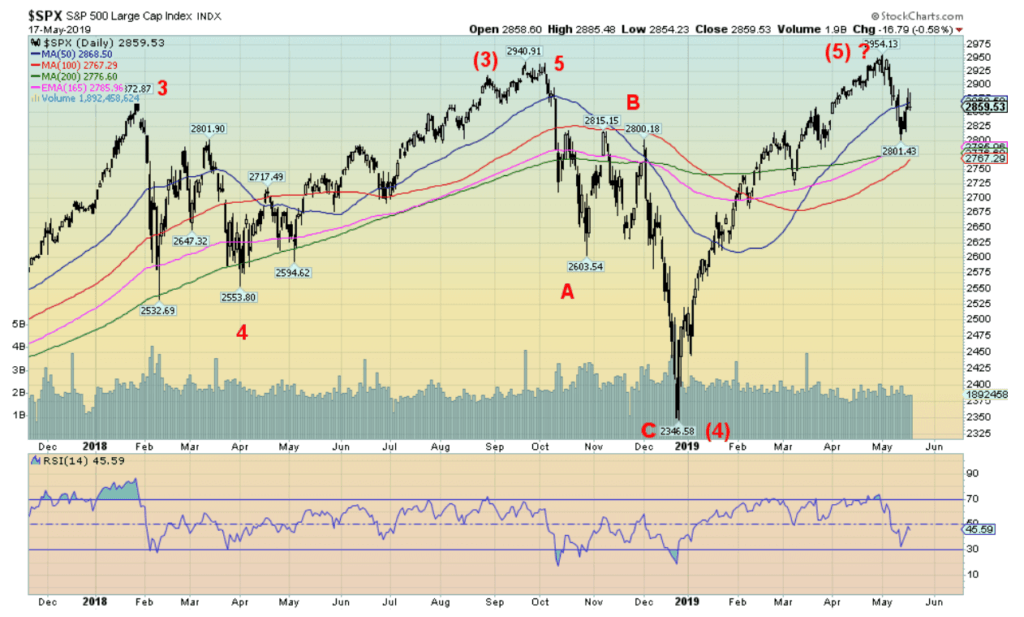
Trying to interpret where we are on the stock market indices has become increasingly difficult of late. The interpretation above is just one. Have we completed a final wave to the upside? Or is this just another wave in a more complex pattern that has not been completed? The S&P 500, along with the NASDAQ, the S&P 100 (OEX), the Dow Jones Utilities (DJU), and Russell 1000 eked out new all-time highs. However, the Dow Jones Industrials (DJI), Dow Jones Transportations (DJT), NYSE, Russell 2000, Russell 3000, S&P 400, S&P 600, Dow Jones Composite (DJC), and the AMEX did not make new all-time highs before turning down. Divergences between the indices are often present at significant tops (and bottoms) in the market.
This past week the S&P 500 fell 0.8%, the DJI was off 0.7%, the DJT fell 1.0%, while the NASDAQ was down 1.3%. The small-cap Russell 2000 dropped 2.4%. In bull markets, the small-cap stocks are supposed to lead. However, since the rally got underway in December the Russell 2000 (and the S&P 600) have trailed the S&P 500. Now when the markets are falling the small-cap indices are leading the way as they are supposed to. The U.S.-China trade dispute is weighing on the market. The tensions in the Middle East do not appear to be a significant factor despite the bombings of some Saudi and UAE oil tankers. Blame is being attributed to Iran despite little or no evidence that they are actually behind the attack. This did, however, raise the specter of a false flag, much like WMD in Iraq to justify the invasion of Iraq in 2003.
In international markets the London FTSE 100 gained 0.9% (despite all the negative goings on surrounding Brexit), the Paris CAC 40 jumped 2.3%, and, the German DAX was up 1.5%. Things were less rosy in Asian markets, however; the Shanghai Index (SSEC) did rise 0.6% but Japan’s Tokyo Nikkei Dow (TKN) fell 1.6%.
Other signals for the markets are mixed. As we note below, the NYSE advance-decline line has failed to rebound and make new highs and now appears to be turning down again. The put/call ratio has been consistently above 1 since May 6, indicating that more puts than calls are being purchased. The overweight inputs is often interpreted as a bullish sign. The NYSE new highs-new lows index remains positive and the McClellan Summation Index (RASI) remains positive but it is falling holding above the 500 level; however, the percentage of stocks trading above their 200-day MA for the S&P 500 never reached new highs and is once again falling.
If interpreting where we are is difficult, then we resort to support/resistance to tell us what is happening. A breakdown under 2,800 would be negative and a breakdown under 2,700 would be quite negative. Volume on this rise since December has been tepid at best and suggests that this rally has had no legs and is corrective not an impulse wave to the upside. A firm breakout over 2,900/2,925 would be positive and suggest that new highs are possible. We continue to believe that there remains the potential for new highs once again, but the recent action and the background news are negatives for the market and the long bull market that got underway in March 2009 could be coming to an end, even if it is not over just yet.
©David Chapman
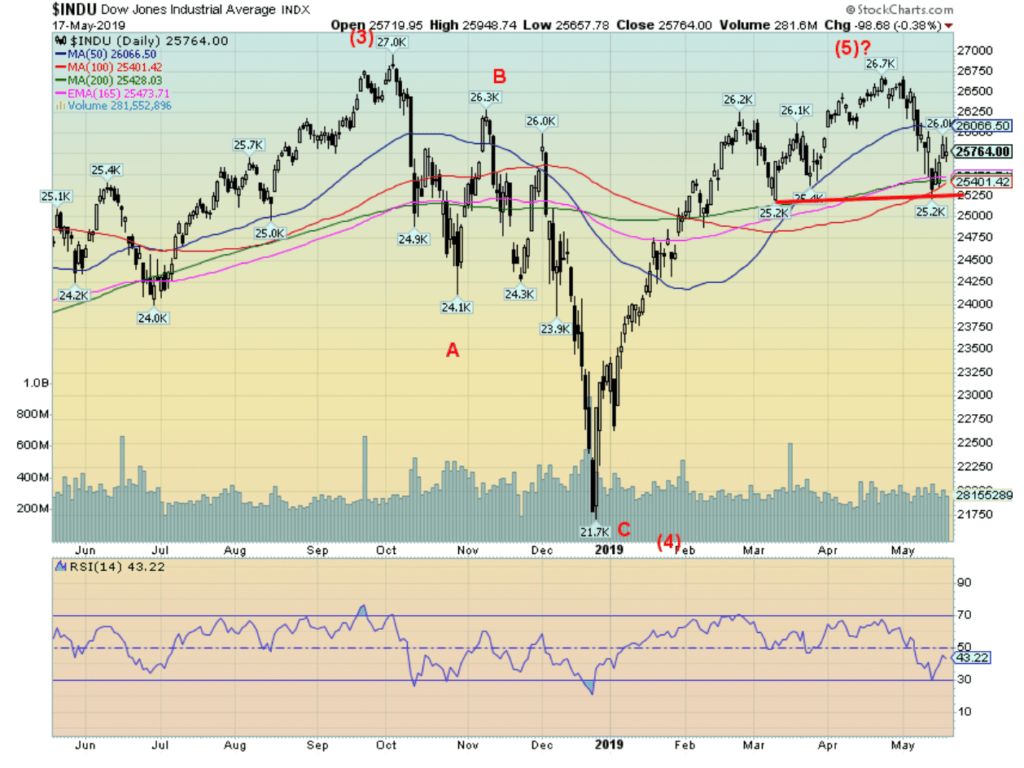
We have not labeled it as such, but could the Dow Jones Industrials (DJI) be in the process of forming a head and shoulders top pattern? The right shoulder may have been formed with the high on February 25, 2019, at 26,110. The head made its top on April 23, 2019, at 26,696. The market is currently working on its right shoulder. Key to the pattern is that the DJI does not take out the April 25 high at 26,110. However, the pattern could still take a few more weeks to form. The breakdown point is seen at 25,250 and a break under that level suggests a decline to 23,750. We do not see this pattern in other indices so it might be wishful thinking on our part to think that it is forming a potential head and shoulders top. However, it does bear watching.
©David Chapman
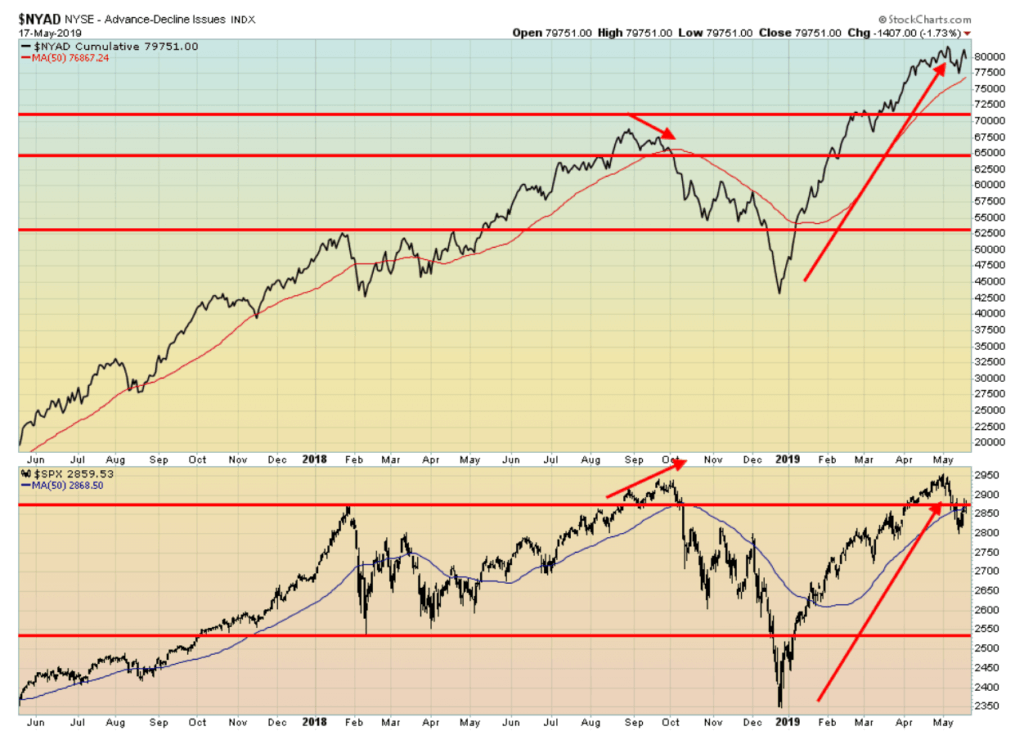
For the first time since this rally got underway back in December 2018, the NYSE advance-decline failed to regain its all-time high and has turned down once again. Note that, previously, every downturn was followed by a move to new highs. Not this time. Or, to be more accurate, we should say that the advance-decline line turned down then started to rise again but now appears to be faltering once again and not making new highs. If it takes out its recent low around 77,500. then the market is falling once again and we may at least temporary top.
©David Chapman
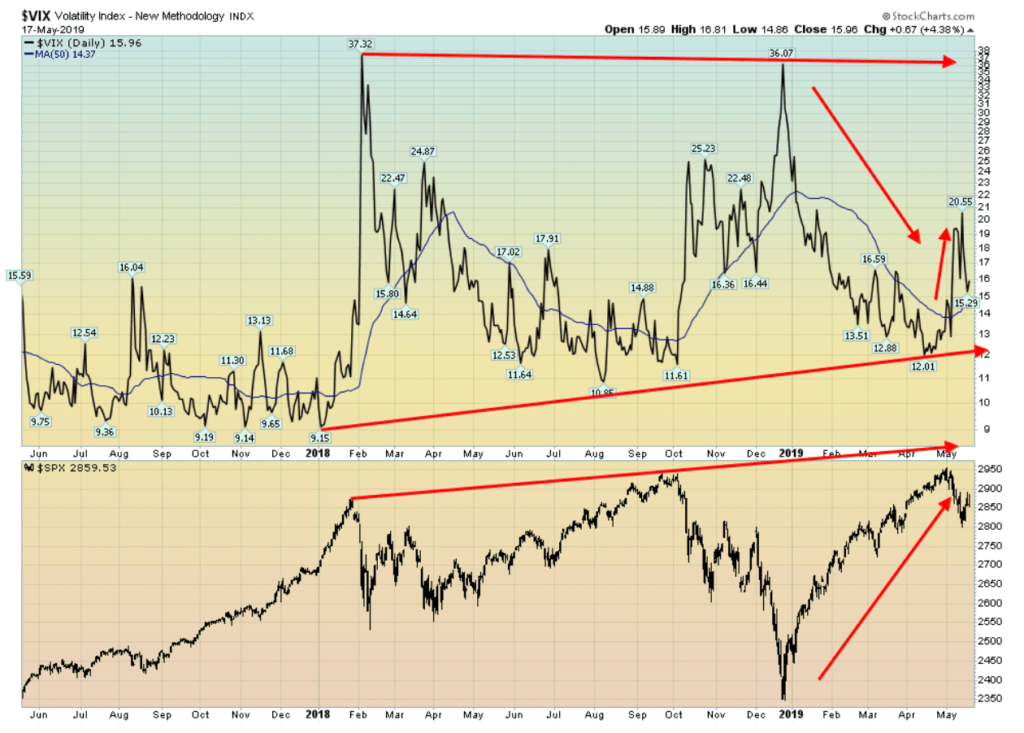
It is no surprise that volatility has returned. The VIX volatility indicator—a measure of fear and greed in the market—spiked to 20.55 when the U.S.-China trade war heated up, but calmed down when it appeared that saner heads might prevail. We note, however, that the 50-day MA has turned up—not a positive sign—so our expectations are that we could see a more volatile period ahead. The 50-day MA turning up appears to precede a rocky period in the stock market. The last time it turned higher was as the market collapsed into the October-December swoon.
©David Chapman
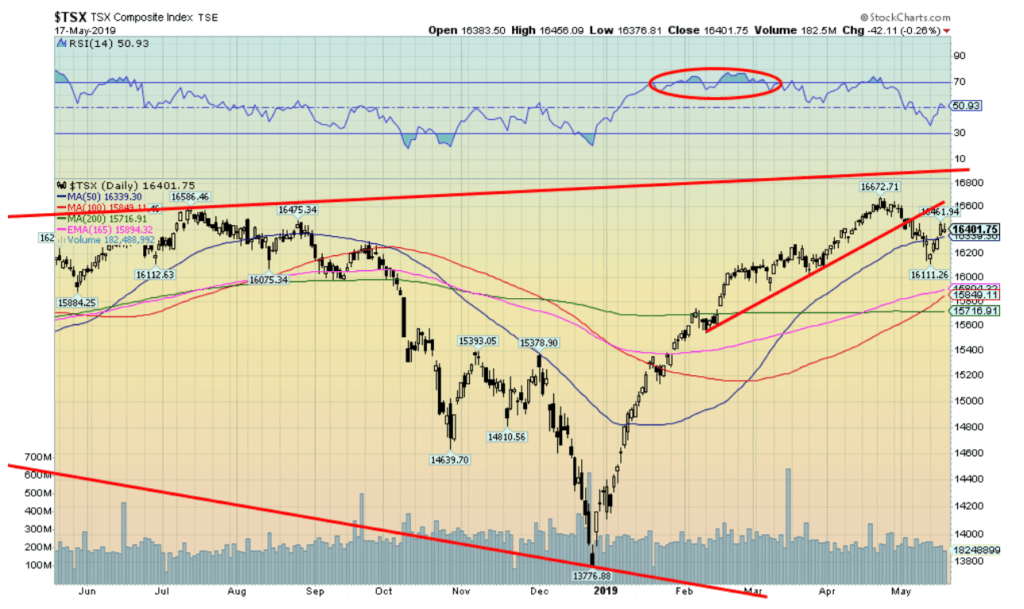
While the U.S. stock indices faltered this past week the TSX Composite did not, gaining 0.6%. The junior TSX Venture Exchange (CDNX) fared even better, jumping 1.6% for its first good gain in a few weeks. The TSX is back over its 50-day MA so it is possible that we could see new highs. We are only 260 points away. Leading the way to the upside were consumer staples, information technology, and industrials—all made new all-time highs. Also, up on the week were income trusts, golds, metals & mining, utilities, and real estate. The TSX made its gains despite both energy and financials falling on the week. Also down were consumer discretionary, health care, materials, and telecommunications. We view the regaining of the 50-day MA as positive. A move over 16,600 would confirm that new highs are probable. New lows lie ahead under 16,100. The ones that seem to have the momentum are the ones up this past week especially those making new highs. If energy and financials turn up, then the TSX should make new all-time highs as well.
U.S. University of Michigan Consumer Sentiment ©David Chapman
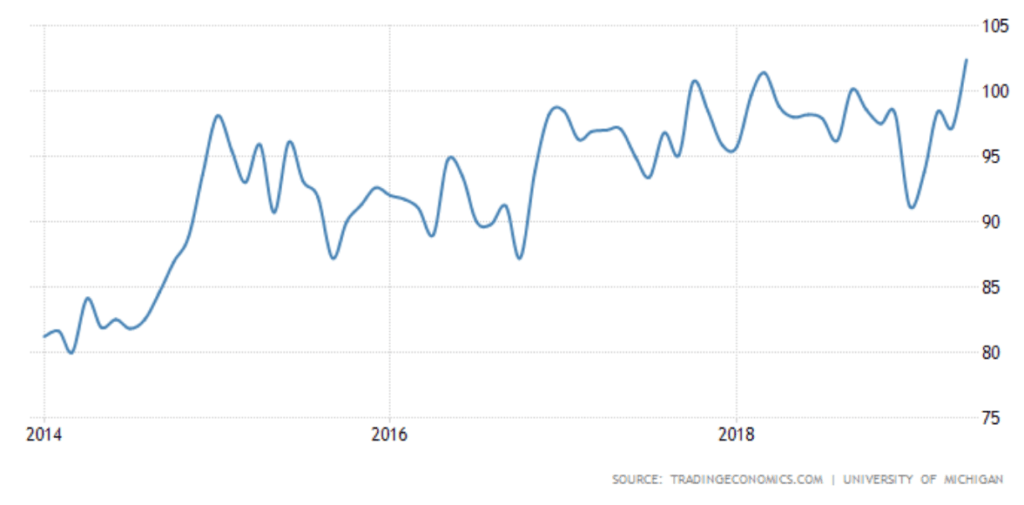
The University of Michigan consumer sentiment index jumped to 102.4 for May 2019, up from 97.2 the previous month. Obviously, the consumer doesn’t seem to care too much about the U.S.-China trade dispute, the potential for war with Iran, or the ongoing drama in the White House. The index is at its highest level since the Great Recession of 2007–2009; it has surpassed the highs of 2017 and 2018 as well as surpassing the highs of January 2004. Although we do understand this survey took place before the recent collapse in trade negotiations with China and before the Iran tensions heated up. So, it is possible the next survey will reflect those concerns and fall sharply back under 100. Sentiment can be fickle.
©David Chapman
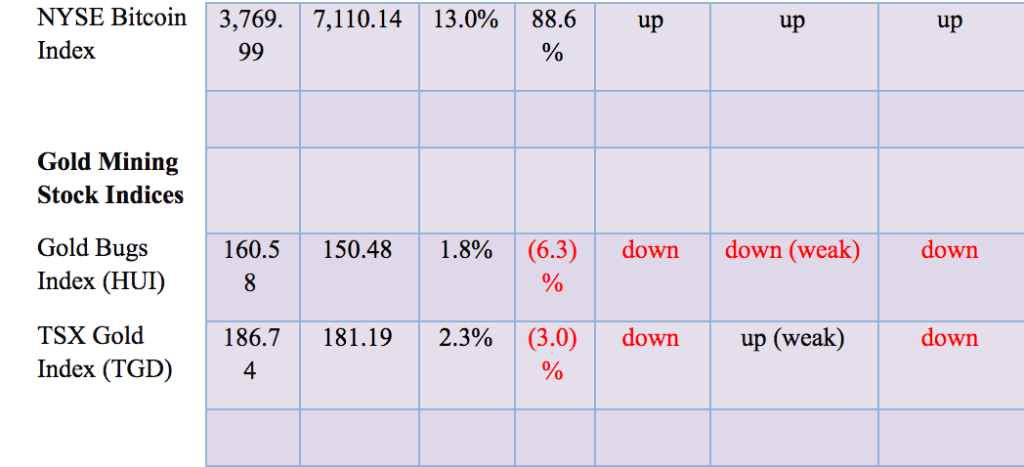
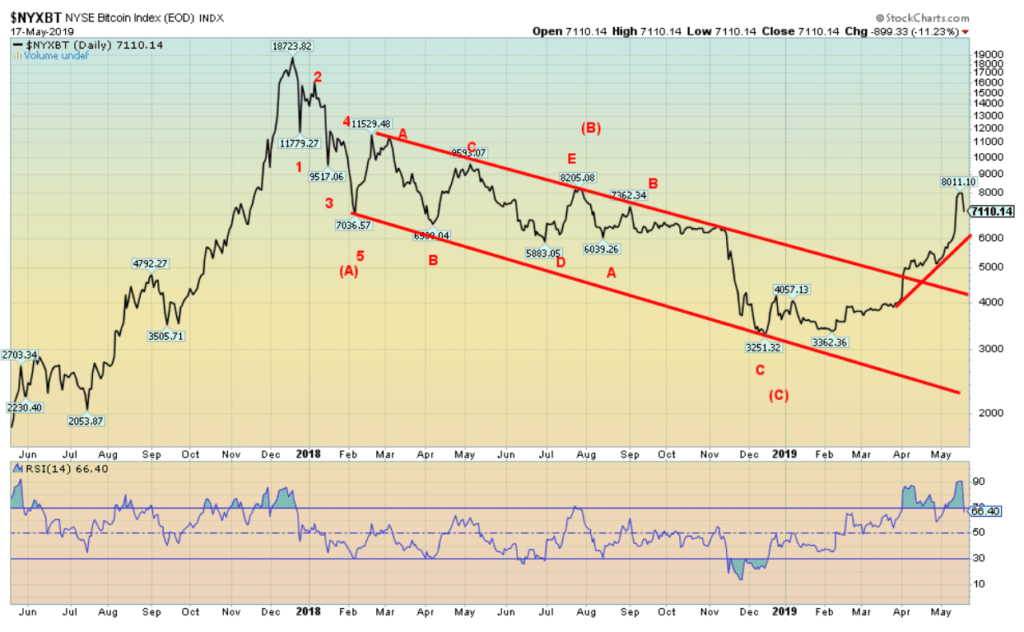
Is Bitcoin really taking off or is it about to crash once again? This past week saw a bit of both—Bitcoin leaped to over $8,000 and then on Friday collapsed over 11%, closing the week out around $7,100. Still, Bitcoin was up 13% on the week and numerous cryptocurrencies put in a splendid week. Talk continues that Bitcoin is once again on its way to $20,000. But Friday was a wild day as at one-point Bitcoin crashed 15% in just 15 minutes from $7,800 to $6,200. Spreads got crazy and were reported to be at least $500/$600 between the bid and offer on Bitstamp a euro exchange.
Some believe it was merely a manipulative move on Friday and once things settle down Bitcoin will continue its recent rise. Some large orders were seen to help spook the market down. The gold market would understand that sort of action. A reminder, however, that crazy action like this was not unusual during the runup in 2017 towards $20,000. Our take is that whatever was going on was, most likely, merely a blip in the current bull run that probably has not run its course. The market is quite thin as volumes are not what they used to be so it doesn’t take much to move the market sharply in any direction. The market appears to be going crazy again so our suspicion is that it will ultimately end badly.
A number of cryptocurrencies listed at Coin Market Cap jumped roughly 20 this past week to 2,186. The market cap of all the cryptos is up to $230.5 billion with Bitcoin making up 56.5% of it at $130.2 billion. Sixteen cryptos have a market cap of $1 billion or more. Ethereum remains a distant second at $25.1 billion. But Dogecoin (yes, it still exists) is ranked 29th with a market cap of $357.8 million. And Dogecoin is just supposed to be a joke; okay, they probably wouldn’t say that as it is listed as a fun, light-hearted cryptocurrency. Unless Bitcoin busts under $6,000, our suspicion is that Bitcoin will recover and move to new highs. A far more important breakout level is up at $11,500.
©David Chapman
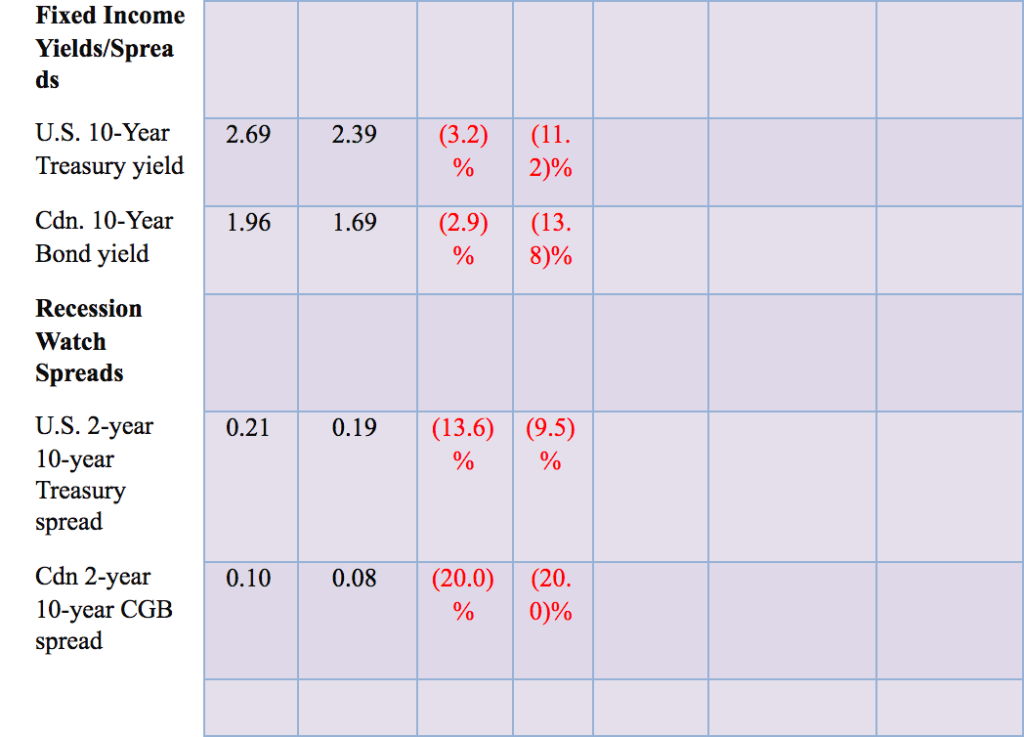
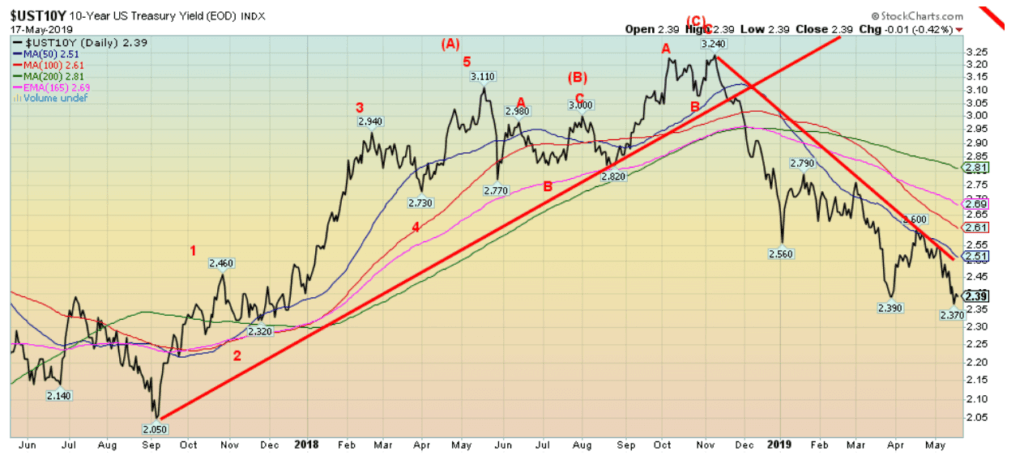
The 10-year U.S. Treasury note fell to its lowest level since November 2017, falling as low as 2.37% this past week before settling at 2.39%. The 10-year appears poised to move low, potentially targeting down to 2.20%. That would be negated if yields rose above 2.50%. Bonds appear to fall in yield because of the U.S.-China trade tensions. Bonds are considered a safe haven and U.S. Treasuries are considered the safest.
Recession watch spread
©David Chapman
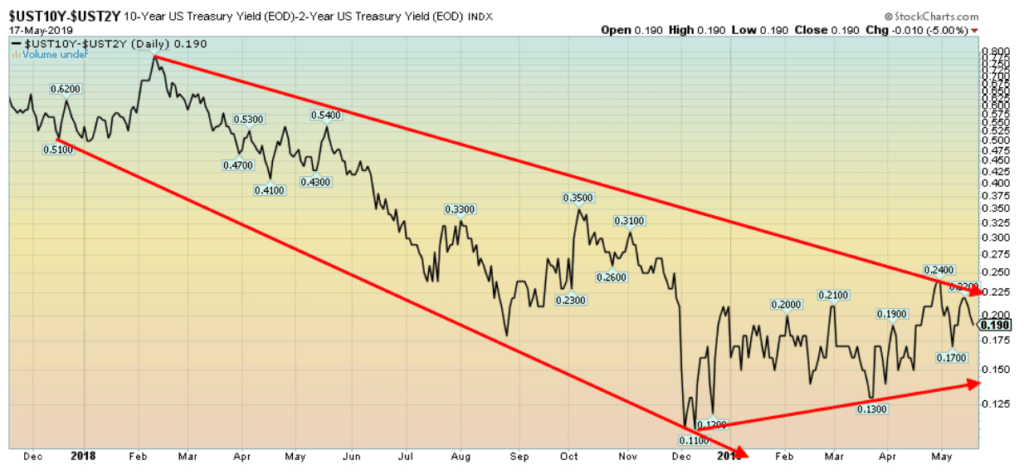
Our recession watch spread slipped this past week to 19 bp, down from 21 bp the previous week. The 2-year U.S. Treasury note less the 10-year U.S. Treasury note spread remains nowhere near signaling a potential recession. Many became excited that a recession was pending when the 2-year U.S. Treasury note Fed Funds (FF) spread turned negative. It remains negative today at minus 9 bp. However, the 2-year FF spread is not as reliable as the 2-year—10-year spread. There are currently few signs of a recession according to the 2–10 spread.
©David Chapman
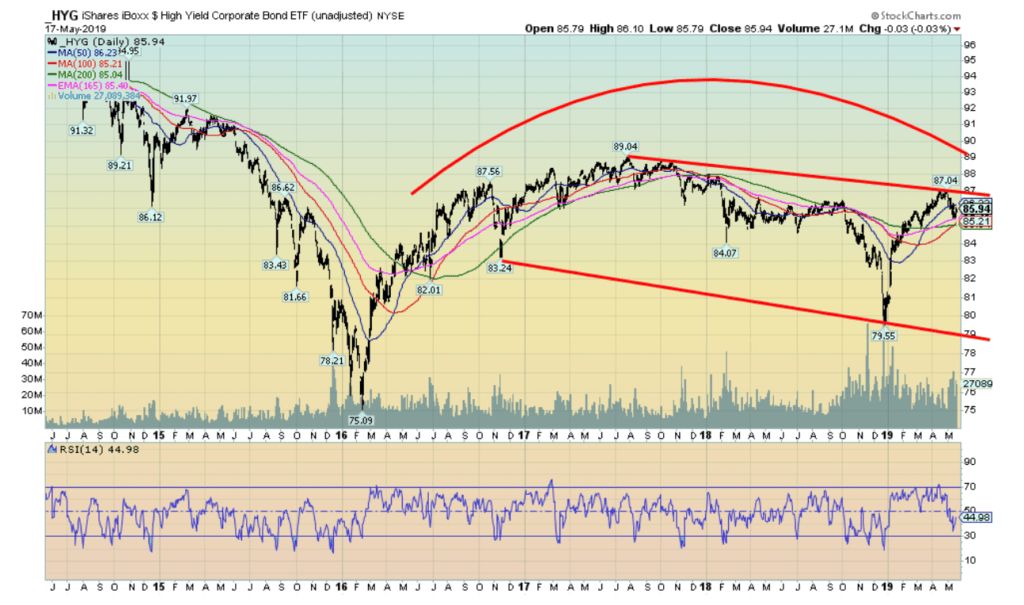
The iShares iBoxx High Yield Corporate Bond ETF (unadjusted) (HYG-NYSE) has bounced back from its December 2018 low but appears to be stalling and rolling over at major resistance of the converging 50-, 100-, and 200-day MAs and the 165-day EMA. We’ll keep an eye on this one as any significant drop in the HYG could spell trouble in the high-yield bond market. Some believe there is upwards of $400 billion of corporate bonds in the U.S. that could easily become junk bonds, falling from their current rating of the lowest level of investment grade bonds (BBB bonds). That could easily trigger a sharp sell-off in the high-yield market where bids can fall quickly and precipitously. Foreign investors have flocked to the U.S. corporate bond market boosting because of the high yields and the rising U.S. dollar. But if yields started rising further and the U.S. dollar fell there could be an equally swift exit. The investment grade bond market in the U.S. is estimated to be as large as $52 trillion.
©David Chapman
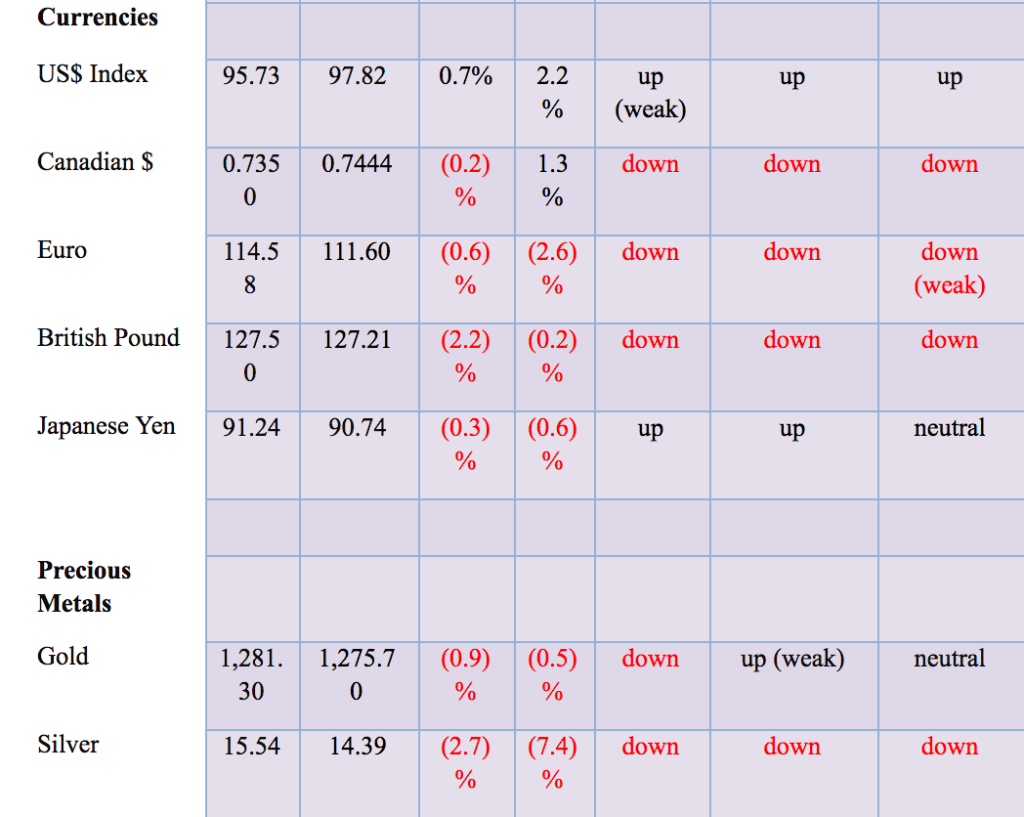
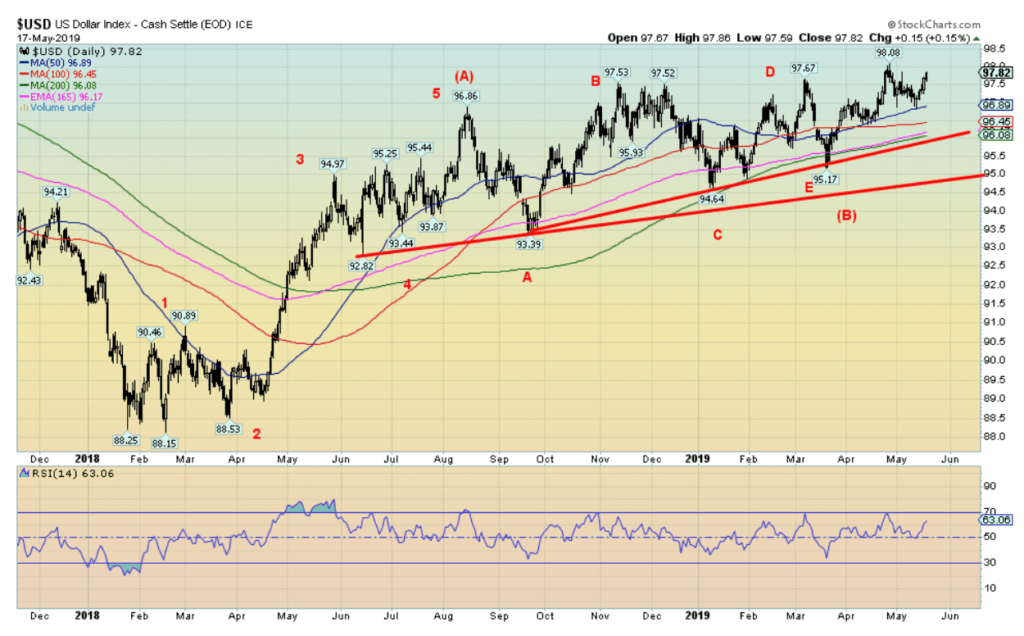
As the trade war continued between the U.S. and China the U.S. dollar strengthened on the week. As our chart of the week shows, the U.S. dollar rose 2.3% this past week against the Chinese yuan. The yuan is not a part of the US$ Index. The US$ Index was up 0.7% on the week as the euro fell 0.6%, the pound sterling was down 2.4%, and the Japanese yen was off 0.3%. The Canadian dollar also fell down 0.2%. The US$ Index appears to be resuming its recent rise with the potential to rise as high as 102, based on what appears to be an ascending triangle that formed between September 2018 and March 2019. This triangle had relatively flat tops but rising lows. Confirmation of the current rise would occur once the US$ Index takes out the recent high at 98.08. Once new highs are seen above 98.08 the US$ Index could next rise to around 99.35. This would only negate itself if the US$ Index were to fall under 97. Under 97 a decline to 96 would most likely take place.
©David Chapman
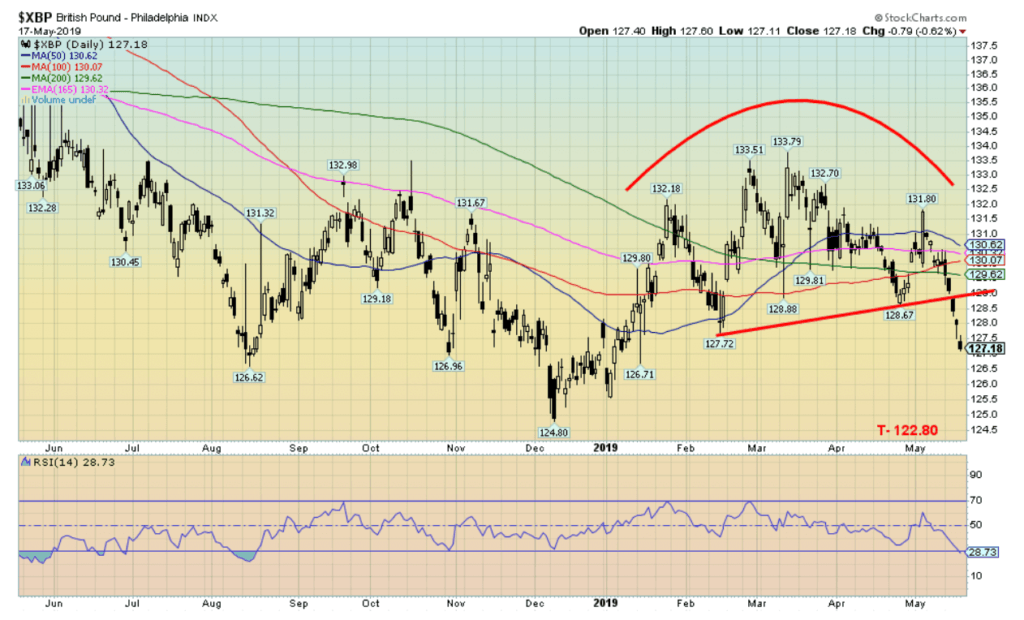
With a messy Brexit becoming a stronger possibility as the major parties in the U.K. cannot agree and breakaway factions are threatening Prime Minister May, the pound sterling fell to its lowest level in weeks. Overall, sterling fell 2.2% this past week. Sterling appears to have fallen out of an awkward looking head and shoulder top pattern that, if correct, projects down to at least 122.80. That suggests new lows below the December 2018 low of 124.80. The RSI has fallen under 30, indicating that sterling is becoming oversold; however, oversold does not mean it is about to turn back up again any time soon. As long as the U.K. cannot get its political act together, odds favor a falling sterling.
©David Chapman
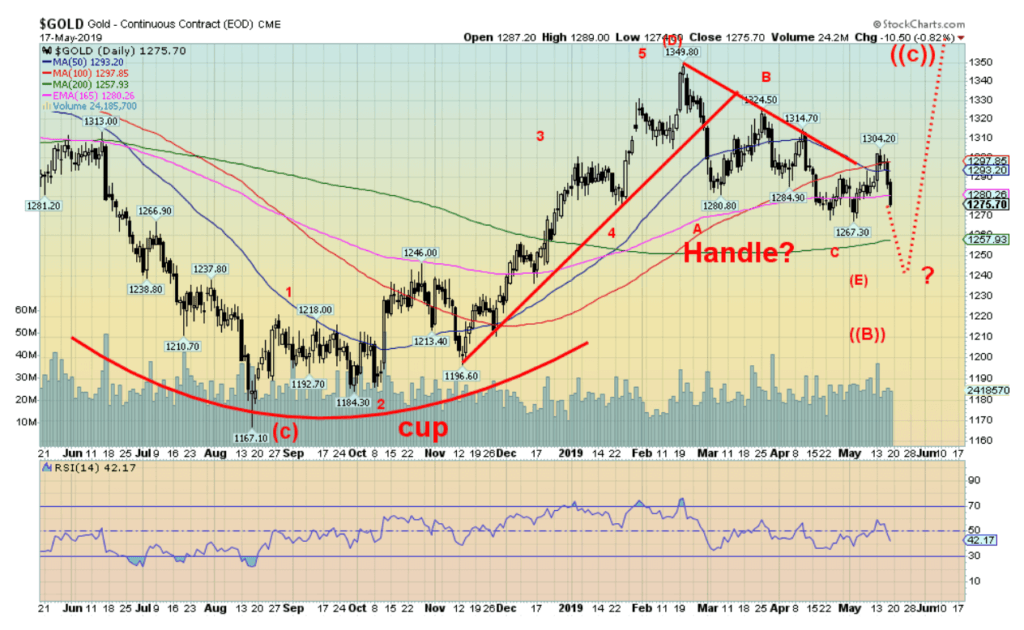
Gold started the week off on the right foot, responding positively to the U.S.-China trade war but by week’s end gold fell sharply, including a $10.50 decline on Friday. On the week, gold was down 0.9% and has now turned negative on the year, down 0.4%. Silver made new lows for the move this past week but gold did not: a potential divergence. Furthermore, the gold stocks were up on the week, another potential divergence. However, as positive as these divergences appear, they have not been confirmed. The confirmation comes only when gold and silver turn positive again and gold does not make new lows. Gold has yet to achieve our potential target zone of $1,235 to $1,250. Note the 200-day MA is down at $1,257. Gold continues to form what could be a cup and handle pattern.
But again, this is not confirmed. The confirmation comes only when gold breaks out over $1,350 the February high. In the interim, there is potential for further losses. The key area we would not want to see breakdown is at $1,200. A move now under $1,270 would suggest a move down to around $1,255 and closer to our potential target zone. Only new highs above $1,304 would negate this scenario. Gold continues to decline in what we are terming wave E down in a large ABCDE-type pattern that started with the high in July 2016. The E wave should be a terminal wave and once that is complete gold should embark on a multi-month rise that could take us to $1,500 and even $1,700. The key breakout zone remains $1,350 to $1,370.
©David Chapman
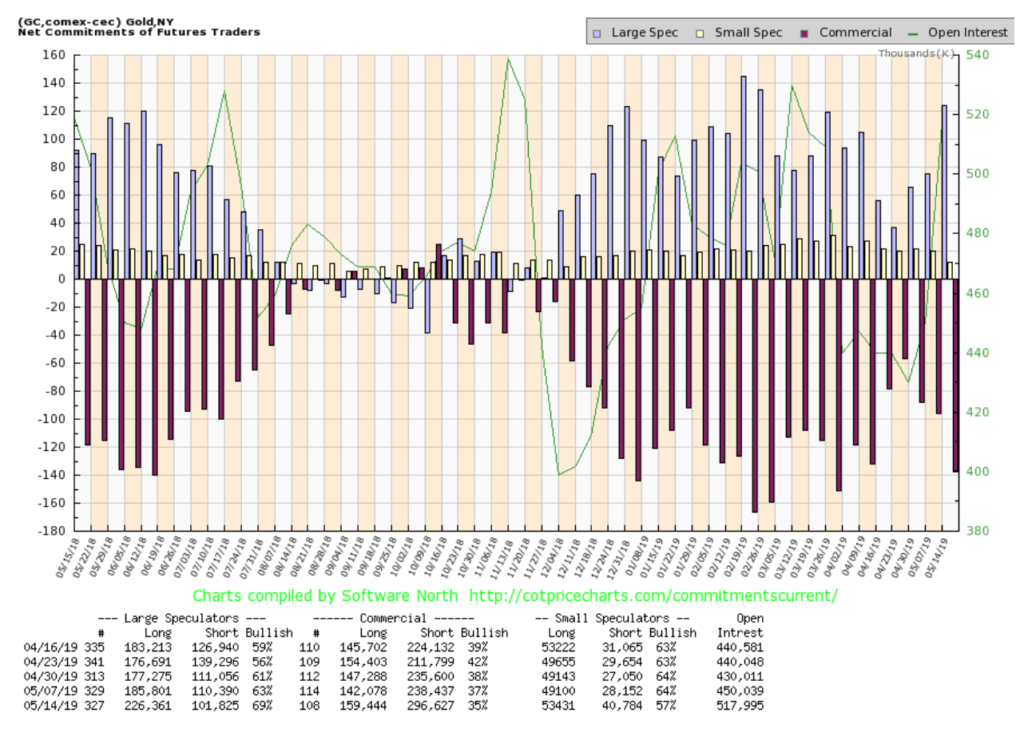
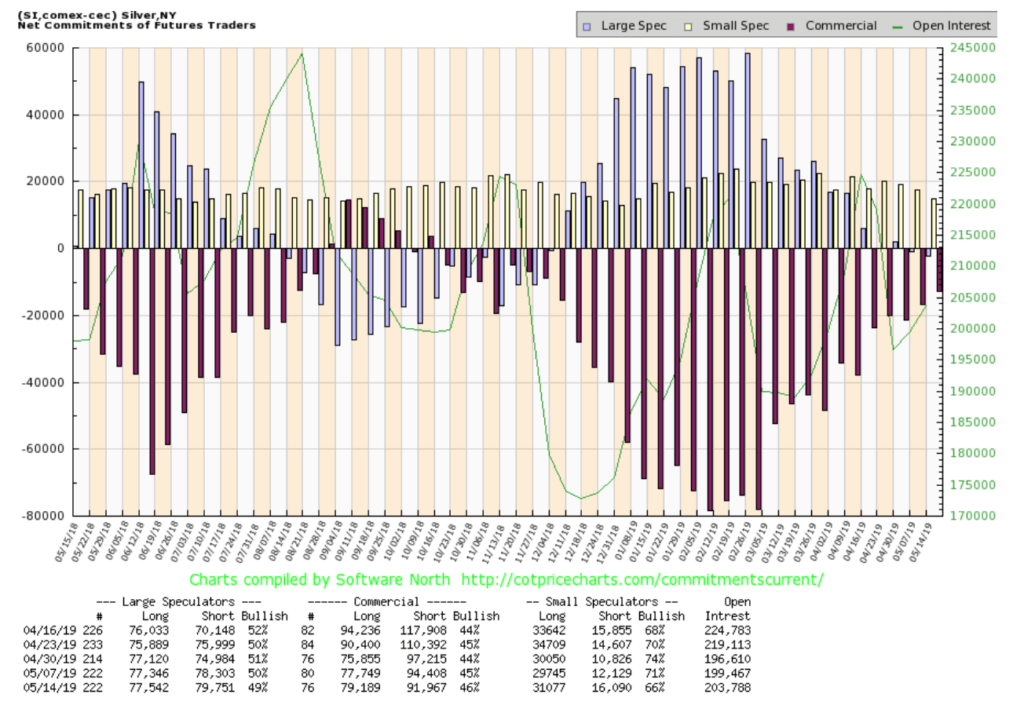
In what appears as a bearish move, the gold commercial COT fell to 35% this past week from 37% the previous week. Long open interest jumped over 17,000 contracts but short open interest jumped even further up over 58,000 contracts. Some of the rise in long open interest may be due to calendar spreads whereby one buys gold for a certain month and sells gold for a different month. But we admit we are surmising as to why both long and short open interest rose. The overwhelming rise was short open interest and for that reason, it appears to be suggesting that gold has a further downside.
©David Chapman
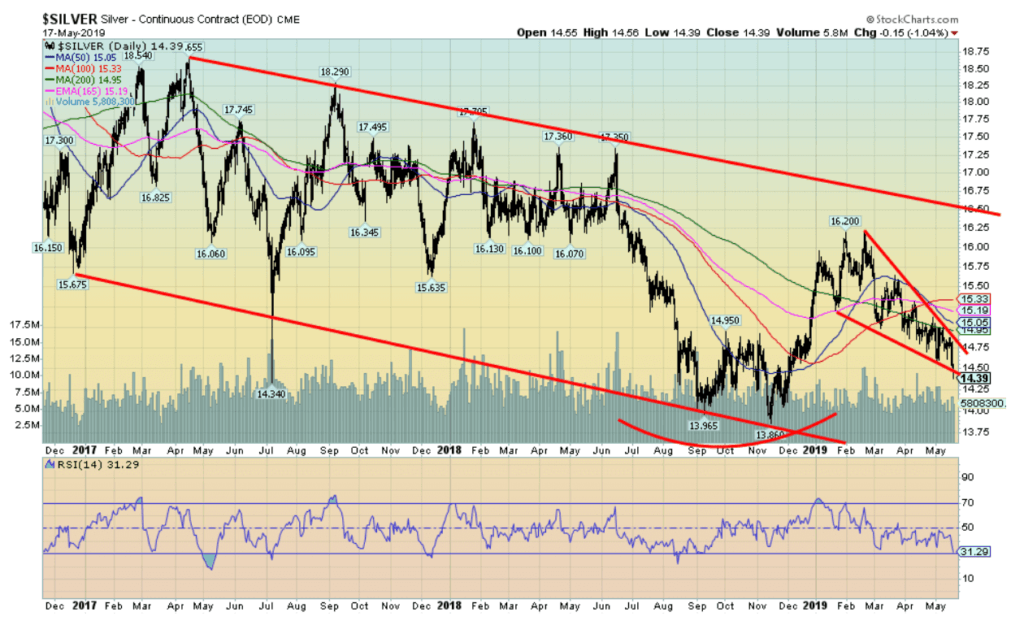
Silver prices fell sharply on Friday, dropping to new lows for the current move down. Friday saw silver fall 15 cents or 1.0%. On the week silver was down 2.7%. Silver appears to be busting through the bottom of what we thought was a forming descending wedge triangle. Given that, silver could have further to fall. The sentiment is currently around 28% and that is also not in what we would term bullish territory. Typically, at significant lows, silver sentiment is under 10% and often as low as 5% or 6%. The pattern now suggests that silver could be moving into a free fall. If that were the case, we might see new lows below the November 2018 low of $13.86. We are only 53 cents from that low or 3.7%. Any rebounds now might be contained at $14.75. There is considerable resistance up to $15-$15.25. The next breakdown point is at $14.25.
©David Chapman
The silver commercial COT rose to 46% from 45% the previous week. Long open interest rose roughly 1,500 contracts while short open interest fell about 2,500 contracts. The large speculators’ COT fell to 49% from 50%. The silver commercial COT continues to improve and remains bullish. However, it is not yet at levels we would consider super-bullish. Last August 2018 the commercial COT for silver was over 50%. The absolute low so far was seen in November 2018 although there was an earlier low seen in September 2018.
©David Chapman
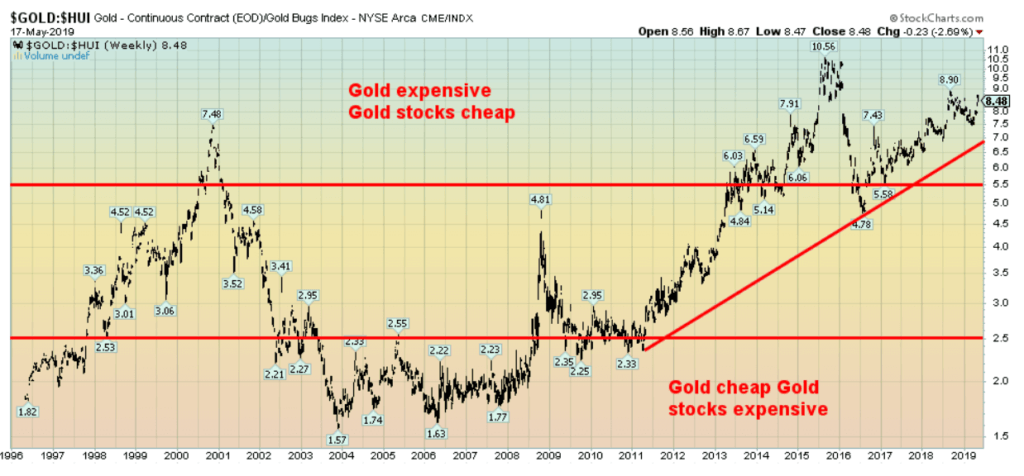
Despite a sharp drop for both gold and silver this past week the gold stocks fared remarkably well. Rather than fall on May 17, the TSX Gold Index (TGD) jumped 0.6% while the Gold Bugs Index (HUI) was up 0.5%. Both indices fared well on the week as well with the TGD up 2.3% and the HUI up 1.8%. Silver made new lows this past week but the TGD and the HUI did not. The gold stocks remain very cheap when compared to gold. Our chart below of the Gold HUI ratio reflects that.
©David Chapman
This has been one of the longest periods of gold stocks remaining cheap compared to gold that we have ever seen. We have no historical precedent. The last time gold was cheap relative to the stocks was 2002–2008. This was a period when the gold stocks were rising sharply even as gold also rose to $1,000. Following the 2008 financial crash, the gold stocks once again outperformed gold as gold rose to $1,900 in 2011. However, gold never got as cheap relative to the gold stocks as it was during the 2002–2008 period.
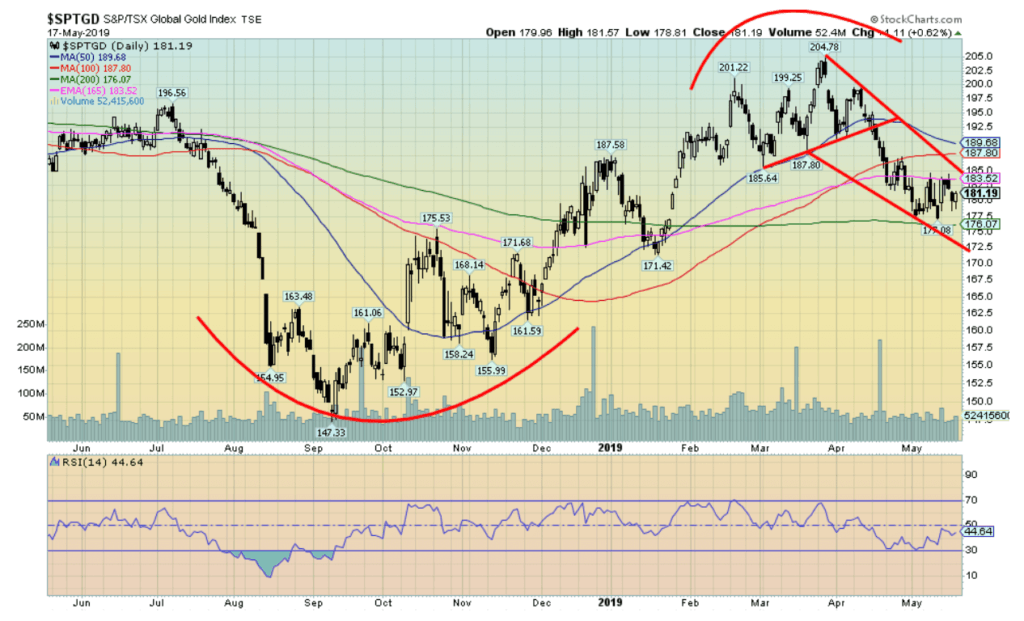
The TGD appears to be trying to form a falling wedge triangle. Ultimately this pattern is bullish but it doesn’t tell us how long it might take to form the triangle. Currently, the TGD breaks out over 185. One could argue as well that, like gold, the TGD appears to be forming a potential cup and saucer bottom pattern. That has stronger bullish implications and once new highs are seen above 205 the TGD could project up to 260 area. We would not want to see new lows below 171.42, the January 21, 2019 low. The topping pattern that formed on the TGD February to April suggested a decline to around 173. The low so far has been 177. Sentiment remains low on the gold stocks although it is not at what we would call extreme.
©David Chapman
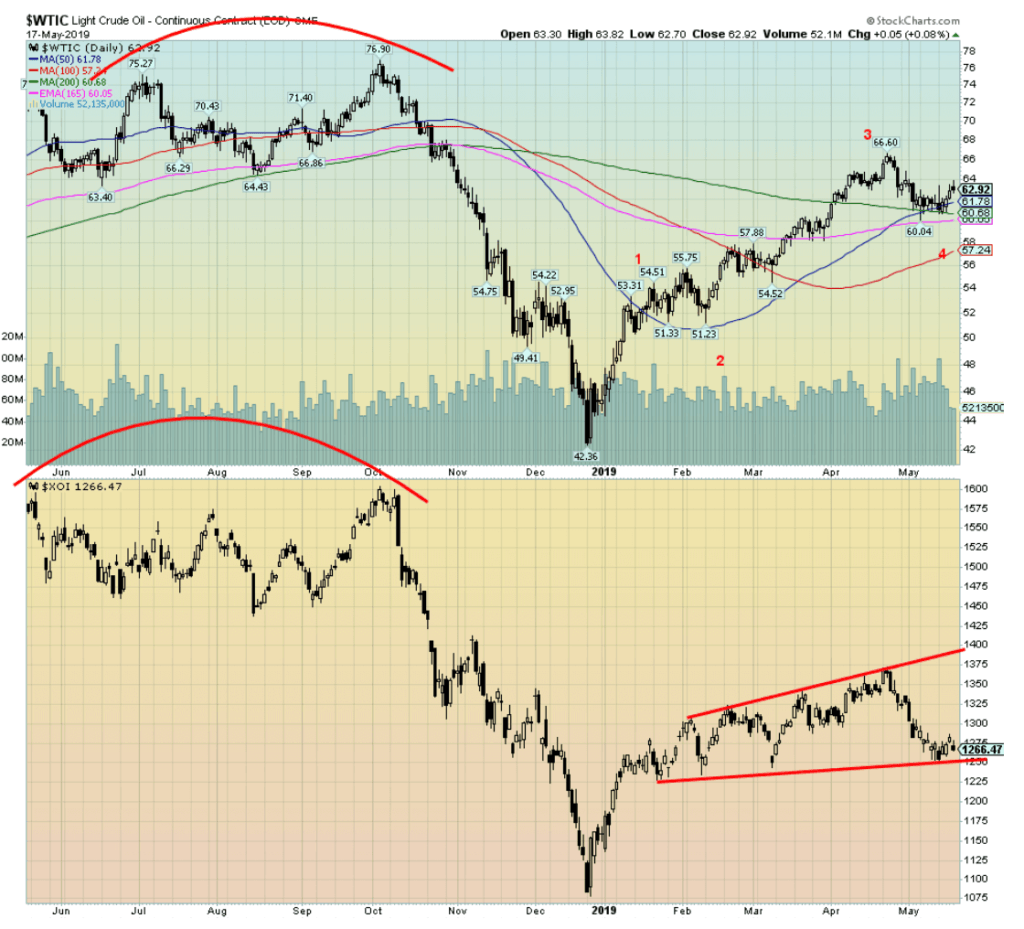
Despite a rise in U.S. oil inventories, WTI oil prices rose this past week because of ongoing tensions in the Middle East. The threat of war with Iran plus the mysterious bombings of Saudi and UAE oil tankers increased tensions. WTI oil rose 2.0% this past week. Technically oil bounced off the converging 50- and 200-day MAs and the 165-day exponential MA. The 50-day MA has also crossed over the 200-day MA, giving another buy signal. Taking out $64 would suggest that WTI oil should next challenge the recent high of $66.60. Only a breakdown under $60 would negate the bullish scenario.
As to the oil and gas stocks, they are being quite sticky. The U.S. Oil & Gas Index (XOI) fell 0.6% this past week while the TSX Energy Index (TEN) was off 1.1%. That’s the bad news. The good news is that the XOI in particular and the TEN appear to be forming rising or ascending triangles. If that is correct then the XOI could break out to the upside. A move over 1,400 would confirm the breakout. The XOI would then project up to around 1,540, a 20%+ move from current levels. The TEN would break out over 180 and project up to around 210, a 38% move from current levels. Given that both indices are close to recent lows it is now important that no new lows are seen for either the XOI or the TEN. The XOI breaks down under 1,200 and the TEN under 150. A rising broader market would help both the energy sector but a falling broader market might drag the energy stocks down with it. Any significant change in the Middle East tensions would also undermine oil prices, especially since supplies appear plentiful.
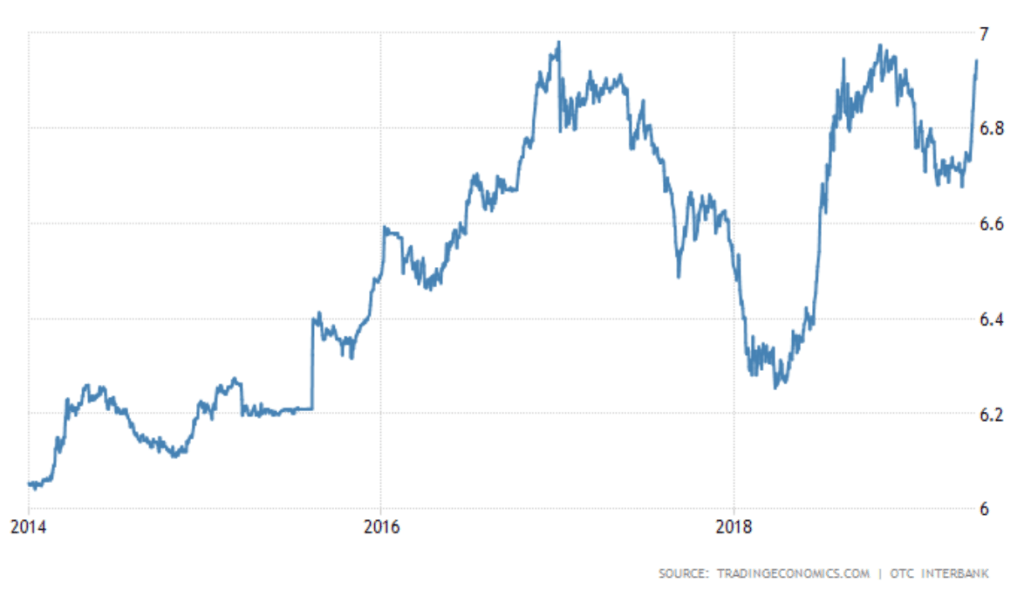
Chart of the week
©David Chapman
The Chinese yuan has fallen to its lowest level since late 2018. The yuan appears to be headed lower (US$ buy more yuan—the chart is the inverse showing how many yuan US$1 will buy). PBOC, China’s central bank has encouraged the yuan lowering by once again providing stimulus to the markets. As the yuan moves lower, cries emanate from the U.S. that the Chinese are currency manipulators. A lower yuan is good for exports as it makes them cheaper, but imports become more expensive. That is not necessarily bad as it could spur domestic development to replace the expensive imports.
However, there is one area where a lower yuan could spell big trouble. A huge amount of Chinese corporate debt is denominated in U.S. dollars. U.S. dollar-denominated Chinese corporate debt was estimated at $751 billion in the third quarter of 2018 according to Bloomberg. An average of $33.3 billion of these bonds mature each quarter from the 4th quarter of 2018 until 2020. Defaults in what is known as offshore corporate dollar bonds (OCDB) totaled some $3.4 billion in 2018 compared to none in the previous year. The risk in the Chinese corporate bond market has gone up substantially with the weakened Yuan.
China’s economy is decelerating. It is showing up in numbers such as the manufacturing PMI. GDP growth has generally been on a downward trajectory for years. However, that is coming from the high, probably unsustainable, levels seen back in 2010 when growth was 10% or higher. Today’s growth is 6.3% still high but low for Chinese standards. To make up the difference China would need the domestic economy to replace its largely export-driven economy. Nonetheless, the sharply falling yuan poses a risk to the corporate foreign bond market. Therein lies the real risk of an unexpected accident that could trigger further defaults elsewhere.
Many have talked about China moving to the nuclear option and selling its vast holdings of U.S. Treasuries. That is unlikely because it would be detrimental to not only China but the U.S. and the global economy as well. Nonetheless, it is not a surprise to notice that China’s purchase of U.S. Treasuries has slowed and over the past year, its holdings have fallen some $67 billion. Other central banks such as the BOJ and the BOE have made up the difference. China can, besides allowing maturities to run off, purchase short-term U.S. treasury bills instead of long-term U.S. Treasury bonds.
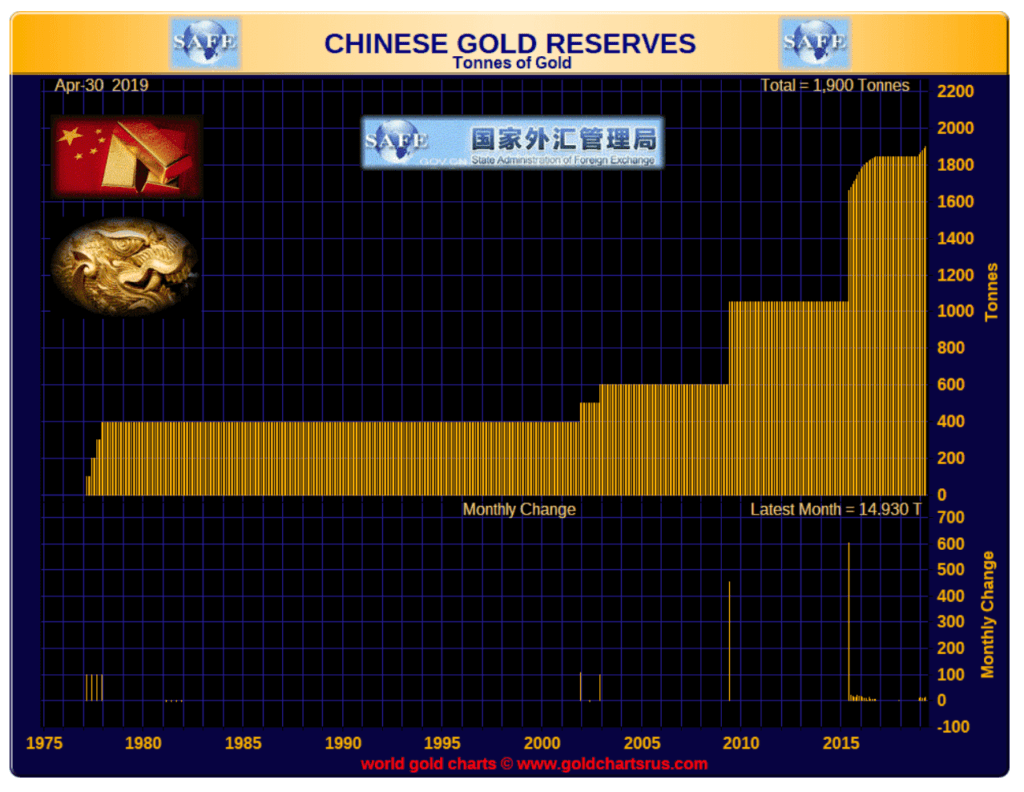
China has also been adding to its gold reserves even as its forex reserves (primarily U.S. Treasuries) are being run down. In the latest month, China added 14.93 metric tonnes and their reserves now stand at 1,885.5 tonnes according to the World Gold Council. Despite the increase in gold reserves, China has only the 7th highest gold reserves which represent only 2.5% of its total reserves, the lowest of any major trading economy. Many believe China’s gold holdings are actually larger. China tends to under report.
©David Chapman
(Featured image by Carlos Delgado via Wikimedia Commons. CC BY-SA 3.0.)
—
DISCLAIMER: David Chapman is not a registered advisory service and is not an exempt market dealer (EMD) nor a licensed financial advisor. We do not and cannot give individualized market advice. David Chapman has worked in the financial industry for over 40 years including large financial corporations, banks, and investment dealers. The information in this newsletter is intended only for informational and educational purposes. It should not be considered a solicitation of an offer or sale of any security. The reader assumes all risk when trading in securities and David Chapman advises consulting a licensed professional financial advisor before proceeding with any trade or idea presented in this newsletter. We share our ideas and opinions for informational and educational purposes only and expect the reader to perform due diligence before considering a position in any security. That includes consulting with your own licensed professional financial advisor.


Bitcoin Stalls Near $60K as Strategy Moves, ETFs Outflow, and EU MiCA Rules Take Effect
Bitcoin hovers near $60,000 with ETF outflows, while Strategy boosts reserves, sells BTC, and raises dividends to reassure investors. Ethereum...


Cannabis Dominates Global Drug Use: Trends, Risks, and Shifting Markets
Cannabis remains the world’s most widely used illicit drug, with 256 million users in 2024, surpassing all others combined. Growth...


Italy Approves First Hydrogen-Powered Train for National Rail Network
ANSFISA has approved Italy’s first hydrogen-powered train, the Alstom HMU214, for use on the Brescia–Iseo–Edolo line. Capable of 140 km/h,...


Cotton Market Weakness Persists Despite Brief Rebound
Cotton prices fell to new lows last week before a modest rebound. USDA data shows crop conditions remain worse than...


Eli Lilly Hits $1 Trillion Valuation Amid Strong Bullish Momentum
Eli Lilly stock hit a record high, surpassing $1 trillion market value after strong product demand. Shares surged over 7%,...
 |
|
 |  |
 |
|
-

 Biotech2 weeks ago
AseBio 2025 Report Highlights Growth and Future Potential of Spanish Biotechnology
-
 Cannabis5 days ago
Tilray (TLRY) Falls as Bearish Momentum Persists Despite Marketing Push
-

 Biotech1 week ago
New Gene Therapies Transform Rare Disease Care, but Gaps Remain
-

 Crowdfunding7 days ago
Ithaca: Climate Road Trip RPG on Climate Resistance