Featured
Gold stocks experience excellent week, Bitcoin headed for collapse?
It’s unclear if the bull market is ending, but negative gains were seen over the past week. Gold outperformed other stocks while crypto is outlining losses.

“There are three ways to make a living in this business: be first, be smarter, or cheat.”—John Tuld, played by Jeremy Irons in Margin Call (2011)
“If we’re right, people lose homes. People lose jobs. People lose retirement savings, people lose pensions. You know what I hate about fucking banking? It reduces people to numbers. Here’s a number – every 1 percent unemployment goes up, 40,000 people die, did you know that?”—Ben Rickert, played by Brad Pitt in The Big Short (2015)
“Listen me out! Money, capital, has a life of its own. It’s a force of the nature like gravity, like the oceans, it flows where it wants to flow. This whole thing with the Arabs and gold is inevitable, we’re just going with the tide. The only question is whether you wanna let it go like an unguided missile and raise hell or whether you wanna keep it in the hands of responsible people, keep it channable, keep it quiet.”—Maxwell Emery, played by Hume Cronyn in Rollover (1981)
Films about the financial world hold a certain fascination. They are often an inside look at how Goldman Sachs really operates. What is even more amazing is that surveys with people who work in the industry have consistently noted that many of the films are not only good films, they get it right. I can recall watching episodes of the series Traders 1996-2000 and was surprised at just how well it jibed with my own experiences in the investment industry right down to the office intrigues and yes even the affairs. Traders for those who may not know was a Canadian production that ran on Global TV and CBC TV. It centered on the employees of Gardiner Ross a fictitious Bay Street (Canada’s Wall Street) investment bank.
Even financial films that were to an extent played it for laughs got it right. Trading Places (1983) did an excellent job of portraying the freneticism of the trading floor quite accurately. While I never traded in the Chicago Mercantile Exchange (CME) pits I vividly remember visits and watching with amazement the coiled waiting for the bell to ring to start trading. And when the bell rang it was just chaos. There was even one guy wearing a hockey helmet. The same could be said visiting the brokerage firms that dealt in the interdealer trading of financials, energy, foreign exchange and more. In a small crowded room at a huge crowded desk, there were a few dozen brokers all manning phones. I was told to stand back, not that there was any room between the traders and the wall. I quickly found out why as again when the bell went to open the market it was chaos and I was almost trampled to death, and strangled by the phone cords. It was as if I wasn’t even there.
Those were the trading floors – crowded, noisy, chaotic. I once watched an FX dealer so upset with his trade he picked up a chair and threw it into a bank of monitors. The trading room carried on as if nothing had happened. But it went beyond the trading floors and into the rarified world of corporate finance where it was different but still a seething world. Those worlds were portrayed brilliantly in films like Wall Street (1987) and Margin Call (2011). Even the films about boiler room firms got it right such as The Wolf of Wall Street (2013) right down to the lying, cheating, the affairs, sex and more. Certainly, one of the most fascinating films was The Big Short (2015) that depicted how a bunch of guys took advantage of what they saw as an anomaly in the markets that was going to blow up. It did and that was the 2007-2009 financial crisis.
The world of the investment bank is traders, corporate finance, legal, management, human resources, IT, and quants. Quants were virtually unknown until the 1970’s but today they are the backbone behind risk management, hedge funds, investment banking, asset management and private equity firms. They make the system work calculating algorithms, probabilities, statistics, and advanced modeling. The probability distribution is one of the most commonly seen in the world of probability theory and statistics. It is the basis of university finance degrees. As one former derivatives dealer told me they all sat around and calculated their normal distribution curves. As long as the defaults didn’t exceed 4 percent they all got filthy rich. Over 4 percent, they were bankrupt. The odds were exceedingly low of that happening until it did in the 2007-2009 financial crisis. The smartest guys in the room weren’t so smart after all.
Documentaries have also dominated. Each crisis often brings us an array of documentaries trying to piece together what happened. Inside Job (2010), Too Big to Fail (2011) came out following the 2007-209 financial crisis. Enron, the Smartest Guys in the Room (2005) came out following the high tech/dot.com crash of 2000-2002 while Other People’s Money (1990) documented the savings and loans scandal of the 1980’s. PBS in the U.S. brought us some fascinating documentaries about the crash of 1929 and the Great Depression.
What all of these films do not say is that despite the best intentions of presenting what went wrong on film history shows that the same mistakes are made over and over again. This Time is Different: Eight Centuries of Financial Folly (Reinhart & Rogoff, 2009) documented how throughout history, rich and poor countries have been lending, borrowing, crashing and recovering their way through an extraordinary range of financial crises. Each time, the experts said “this time is different” – claiming the old rules of valuation no longer applied and the new situation bears little similarity to past disasters. We lifted that straight from the back cover of Reinhart and Rogoff’s book. No need to make it up. It just bears repeating.
This past week the stock markets went through a mini-crash. They may recover, or they may not. The President tells everyone that his is the greatest administration in history that they have created more jobs, that growth has soared, and things are getting better. Except anyone who spends barely a minute fact-checking that boast knows that is utter nonsense. What we do know is that the world has accumulated more debt than it has at any point in history ($245 trillion at last count and rising up over 40 percent since the crash of 2008). Financial crises are all about debt collapse. It doesn’t matter who accumulates the debt – government, corporations, banks and the consumer the end result is usually the same. Bankruptcy and debt collapse. The massive accumulation of debt gives a false sense of security. It makes things look better than they really are. It’s an illusion of wealth. Debt has been with us since ancient times (yes, even the Romans and the Greeks and the Egyptians before that) and all governments, all corporations, all banks and all consumers are guilty in accumulating it.
It is a game of musical chairs. Until the music stops and someone pulls out a chair and someone is out. Except in a debt collapse we all feel it not just the ones tossed into bankruptcy.
The epitaph of the current financial mania has not yet been written. But we are sure there will be some interesting films and documentaries on the subject. We continue to believe that the next financial crisis will be worse than all of the previous ones since the 1970s. The next financial crisis will bring into question the role of the U.S. dollar as the world’s reserve currency. The trouble with the U.S. dollar is that is still used extensively despite the desire of the Chinese, in particular, challenging the dominance of the U.S. dollar hegemony. The U.S. dollar constitutes more than 60 percent of all foreign exchange reserves and more than 50 percent of all international debt. The U.S. dollar is used in roughly 40 percent of all international payments. The Euro is second and well behind but growing is the Chinese Yuan. Despite its growth, the yuan still lags behind the Japanese yen. The yuan is not a major factor in international loans.
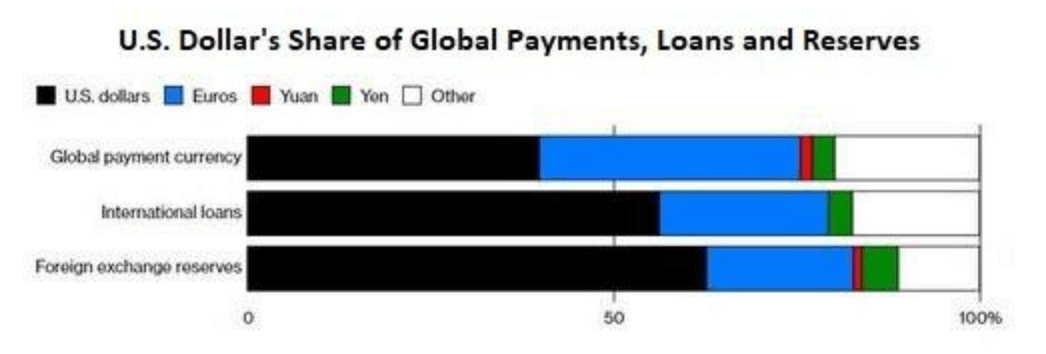
Source, The Distortions of Doom Part 2: The Fatal Flaws of Reserve Currencies by Charles Hugh Smith © David Chapman
What the chart shows is that the U.S. dollar remains the world’s dominant currency. That will change over time but it will take a while. One problem with both the yen and the yuan is neither run a trade deficit and therefore it is difficult to export their currency via loans or other means. The huge amount of U.S. dollar-denominated debt is a problem against the backdrop of rising U.S. interest rates and a high U.S. dollar. The President may rail about both and the policies of the Fed but as long as he keeps it to railing and doesn’t actually do something, then we could bungle through. Meanwhile, we would hold a little gold as insurance against the growing negative backdrop.
Trump and the Fed
Trump has described the Federal Reserve as “crazy,” “loco,” “going wild,” and, “out of control”. Trump’s complaint is that the Fed keeps hiking interest rates and that in turn has contributed to a rising U.S. dollar. Rising interest rates have been cited as one of the reasons for the fall thus far for the stock market in October 2018.
But the stock market is not falling just because of high interest rates. It’s October and the month has been known to have scary drops. The S&P 500 is down roughly 6 percent so far in October. Concern over the valuations of the high-tech stocks particularly the FAANGs, China trade concerns, the potential for an Italian banking crisis are also reasons why the stock market has fallen. At its peak, Amazon (AMZN-NASDAQ) had a P/E of well over 155. Imagine if that was cut in half like what happened to even the best high-tech stocks during the 2000-2002 collapse. Amazon trades at over $1,800 and hit a peak at over $2,000 and a $1 trillion market cap. Apply that to the rest of the FAANGs.
But Trump’s comments add an extra edge to the stock market drop. All this is coming even as Fed Chairman Jerome Powell has said the economy is “particularly bright at the moment”. Why wouldn’t it be coming off 4.2 percent annual growth in Q3? Trump has continual bragged about how great the economy is doing, how great the stock market is doing and that everything his administration has done has contributed to the economy and the stock market. When the tide turns, however, Trump seeks scapegoats. He doesn’t want to be associated with the fall. Trump and Republicans continue to emphasize that the economy is great and will continue into 2019.
Powel and the Fed are sure to ignore Trump and his musings. Simply put the Fed cannot be seen to be influenced by political factors. The Fed is fully expected to hike rates again in December and have signaled the potential for three in 2019.
But Trump hammering away at the Fed does not do any good. Other government areas have seen an erosion in confidence, morale and increased scrutiny because of Trump’s musings. Each time the Fed has hiked rates this year Trump has attacked.
Attacks on the Fed from the political arena have happened before. The Fed is supposed to be independent as are all central banks. Allowing political interference would make markets extremely uneasy as it would be seen as manipulation of the political arena running monetary policy.
Yes, Presidents have in the past criticized the Fed. Notable criticisms came from President’s Kennedy, Johnson, Nixon and Bush (both of them). Monetary policy after all does have an impact on the overall performance of the economy. President Kennedy wanted to seize control of the currency from the Fed by issuing currency through the U.S. Treasury (Executive Order 1110 June 4, 1963). Kennedy was of course assassinated five months later. The executive order was withdrawn and never seen again.
Yet many have pointed in the past to the Fed engineering a recession in order to cool down financial bubbles. This was particularly seen in the bursting of the high tech/dot.com mania of the late 1990s and the housing bubble of the mid-2000s.
The Fed is not any ordinary corporation. It is an independent entity created by the Federal Reserve Act of 1913. The President and Congress must approve of the Fed’s Board of Governors. The President appoints the Chair (currently Jerome Powel). The Fed has twelve regional Federal Reserve Banks set up similar to private banks. Some 80 percent of the Federal Reserve is owned by eight families – Goldman Sachs, Rockefellers, Lehman’s and Kuhn Loeb in the U.S. and the Rothschilds of London and Paris, the Warburg’s of Hamburg, the Lazard’s of Paris and the Israel Moses Seifs of Rome. In the book “The Secrets of the Federal Reserve,” there are charts showing the interconnections to the Rothschilds, the Warburgs, the Rockefellers plus others.
The likelihood of Trump firing Powel is extremely remote. Markets would not take well to that. It is not even clear that Trump has the power to fire Powel. But sniping from the sidelines can take its toll and play on the institution and it is not positive for either the Fed or for economic policy. Most view Trump’s comments as personal musings much like his tweets. If the market thought it was any more than that then the fall thus far in October could become much worse.
Bitcoin watch
© David Chapman
According to a report from the cybersecurity firm CipherTrace, there has been upwards of $1 billion theft of cryptocurrencies through exchanges in the first nine months of 2018. That is unprecedented and is up some 250 percent from 2017. As the number of cryptocurrencies has expanded so have the hacks and thefts. The regulators have had a difficult time keeping up with what is going on and it is the prime reason why regulators believe that the cryptocurrency world is rife with money-laundering. The largest thefts have occurred in countries where anti-money laundering regulations are the weakest. It is believed that upwards of $2.5 billion has been laundered since 2009.
It should then be no surprise that the economist Nouriel Roubini, the economist who foretold the 2008 financial crisis, told a Senate Banking committee that the cryptocurrency world is the “mother of all scams”. He also called it a “busted bubble”. He has a good point there as we have noted that many cryptos are down 90 percent or more and or are just dead and gone. Probably the best comment from Roubini was that crypto traders themselves have referred to tokens other than Bitcoin as “shitcoins.” Roubini said that is “grave insult to manure”.
Despite that, the universe is populated with those who herald the next coming of new Bitcoin and the next cryptocurrency bull market. Bitcoin will soon break out to the upside and head back to the highs of $20,000. We suggest that they might be smoking something, now of course that it will be legal in Canada.
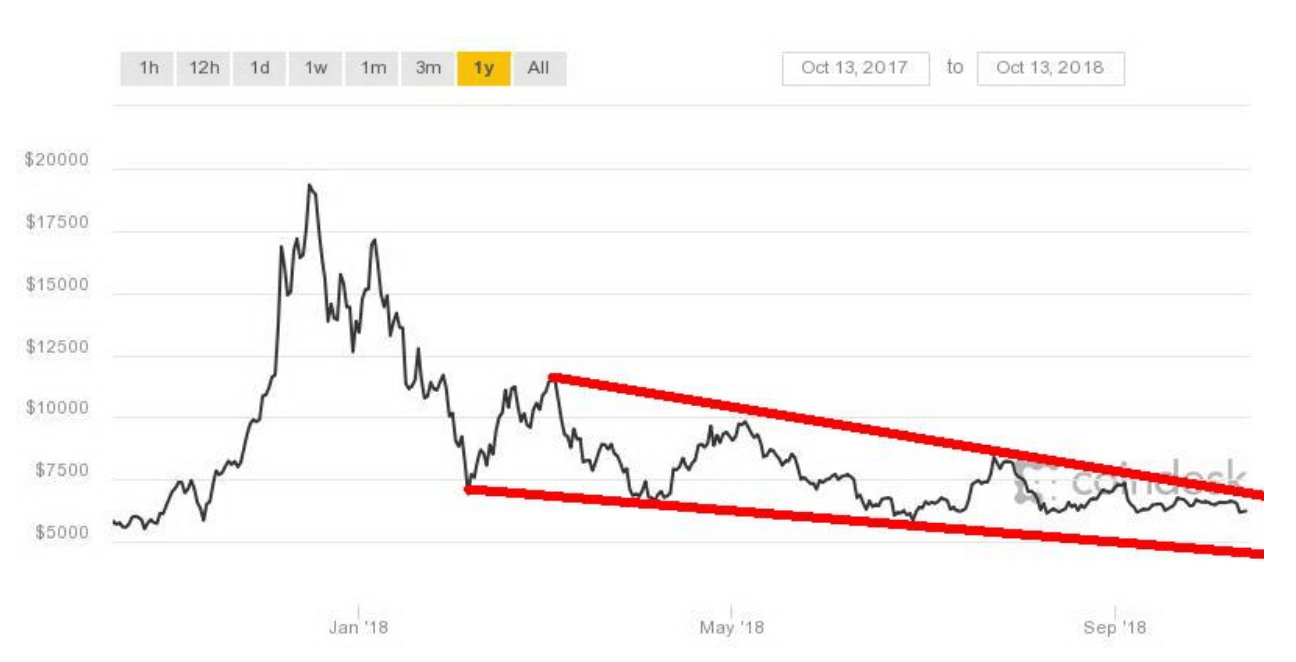
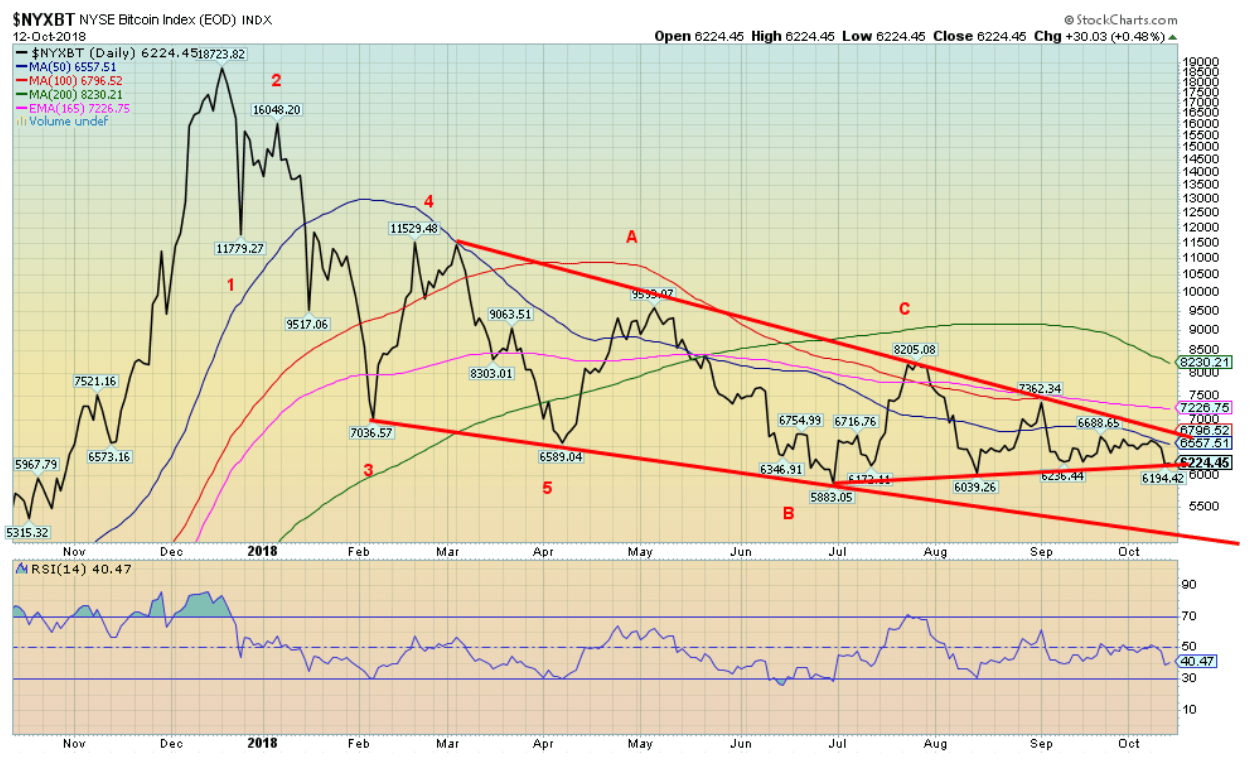
Bitcoin tumbled this week along with the markets. It hit a high of $6,650 on Monday but was down to $6,200 by Friday a drop of 6.7 percent. Over the past few months, $6,700 has proven to be resistance while support has come in around $6,100. The low was set in June 2018 just above $5,800. We continue to believe that Bitcoin will break to the downside but we could see a false upside breakout before we turn to the downside again. Bitcoin is down roughly 70 percent from its all-time high seen in December 2017. Other cryptos are down 90 percent or more.
The market cap of all cryptos has fallen to $201.6 billion this week down from $219 billion a week earlier. There are 2,071 crypto’s listed at Coin Market Cap up incredibly from 2,034 a week ago. Where do all these crypto’s come from? Who falls for this stuff? Amazingly the number of dead coins listed at Dead Coins remains unchanged at 929. And the number of cryptos with a market cap of $1 billion or higher remains steady at 15. That’s not even 1 percent of all the cryptos listed. Bitcoin remains the largest crypto with a market cap of $109 billion representing 54 percent of the entire market cap of the crypto universe. That’s down from its peak of at least $324 billion. We are sure that P.T. Barnum has had a hand in the crypto world.
© David Chapman
Markets and trends
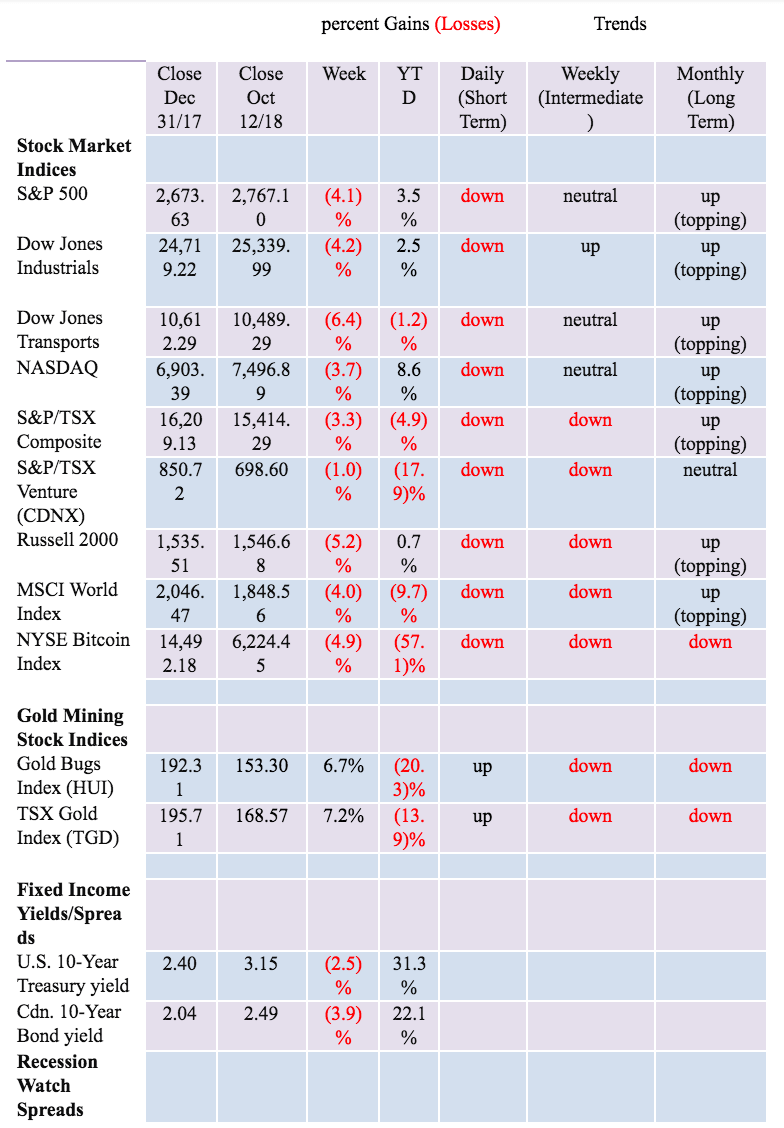
New highs/lows refer to new 52-week highs/lows. © David Chapman
© David Chapman
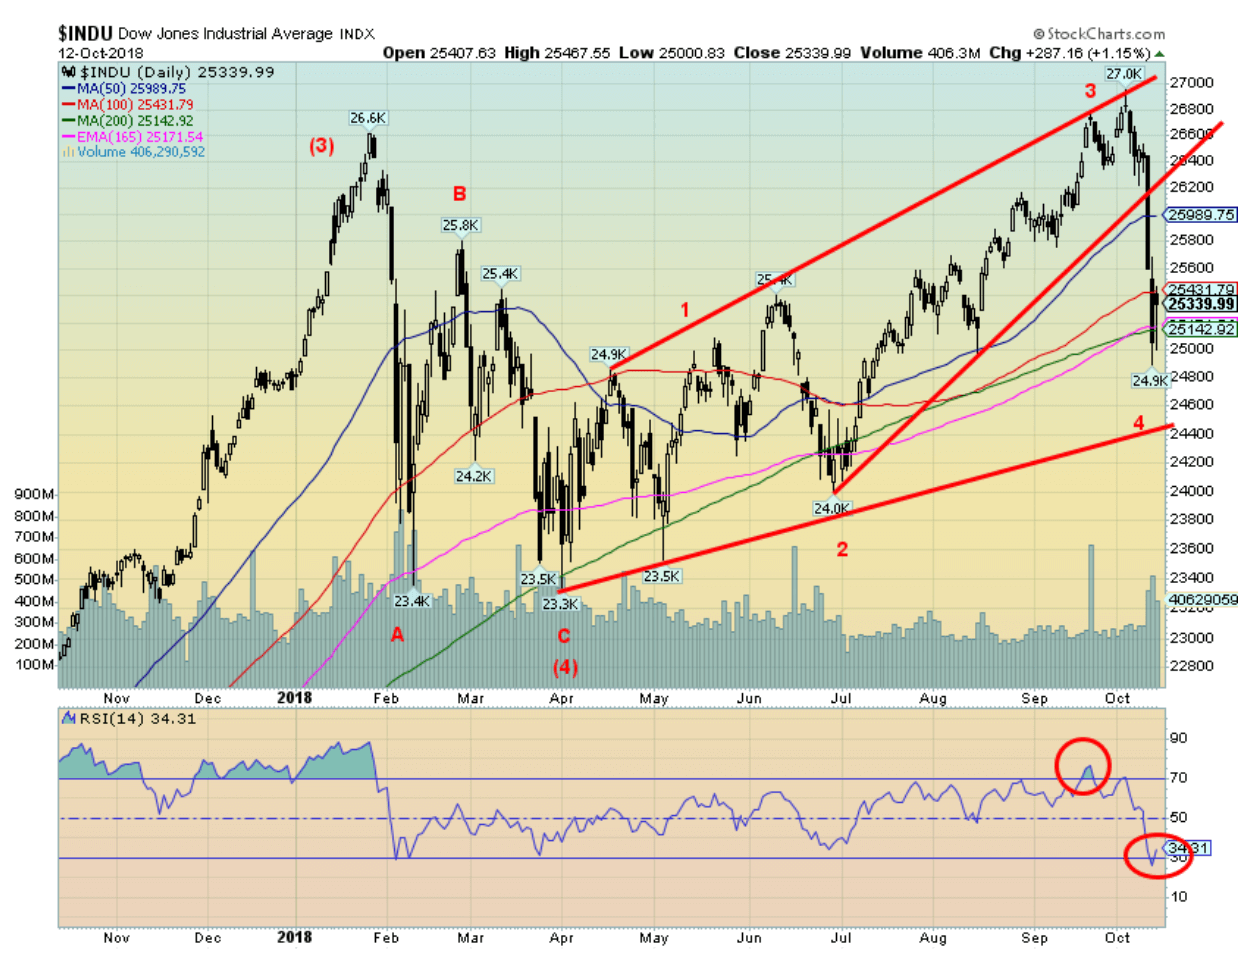
It was the culmination of a bad week with a focus on rising interest rates, the trade wars with China and even the shakiness of Italian banks. The Dow Jones Industrials (DJI) fell to the 200-day MA but rebounded and managed to close near it. That is not dissimilar to what the market did in February and March. The 200-day MA held then, but will it now? The DJI fell 4.2 percent this past week. The DJI’s cousin the Dow Jones Transportations (DJT) fell, even more, losing 6.4 percent. It closed consistently below the 200-day MA and could be entering the bear territory.
The NASDAQ was down 3.7 percent despite the weakness in the tech stocks. The FAANGs led the way up and they could lead the way down. Overseas the markets also fared poorly. The London FTSE 100 dropped 4.2 percent, the Paris CAC 40 was off 4.9 percent while the German DAX dropped 4.9 percent. Fears of Italian banks still abound.
In Asia, the Chinese Shanghai index fell to new lows down 7.6 percent while the Tokyo Nikkei Dow (TKN) dropped 4.6 percent. In Canada, the TSX Composite fell 3.3 percent while the junior TSX Venture Exchange held its own off only 1 percent. Major support for the DJI is seen down at 24,400. Regaining 26,000 would be quite positive and suggest the potential for run back to the highs near 27,000. The weakness of the DJT suggests to us that the DJI and DJT could diverge here.
Markets are at a crossroad. It could be key what happens now over the next few weeks. However, the word should be now to sell rallies. It is getting quite late in the bull cycle and it is running out of time. We have labeled this a 4th wave correction. If correct one more run to new highs should occur but it would be the last one. If we are wrong and the market is poised for lower prices the key as we note is the February lows. That level breaks than all bets are off.
© David Chapman
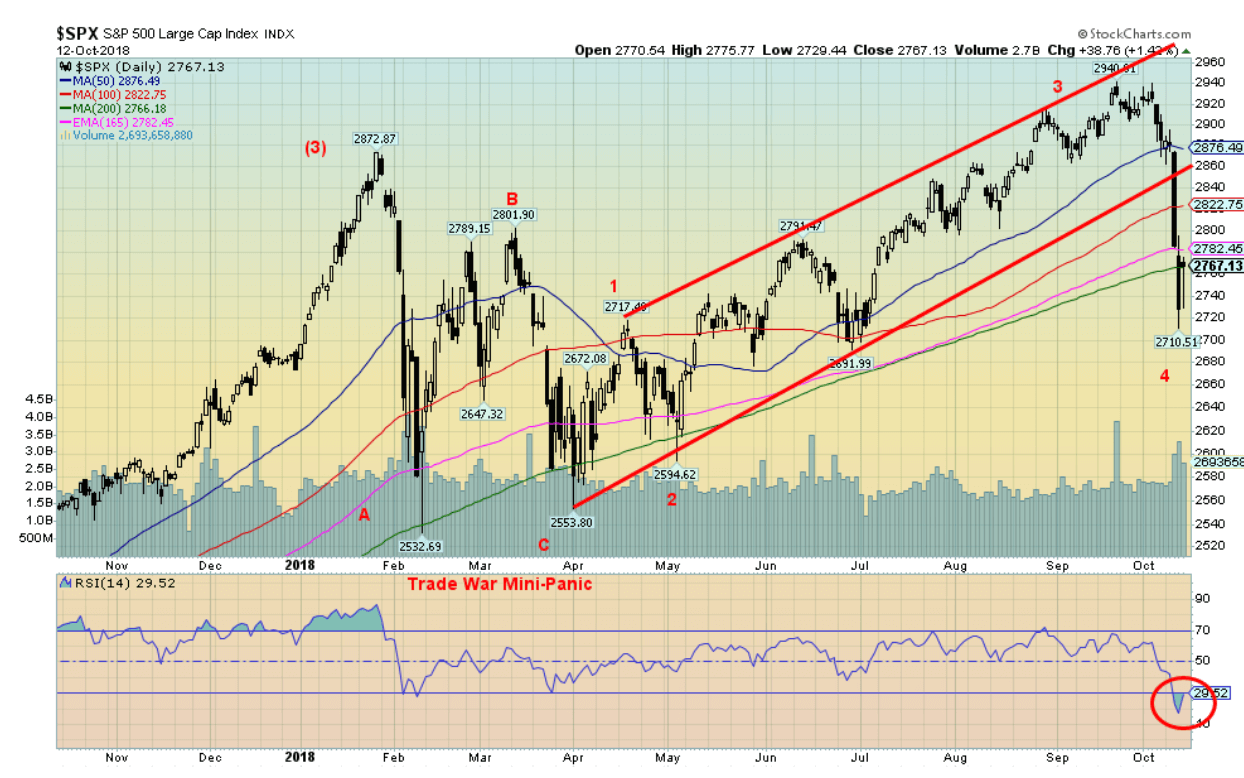
The S&P 500 fell 4.1 percent this past week the worst drop since February. Volatility has jumped sharply. The S&P 500 hit down just under the 200-day MA at 2,765 and managed to just close at that level on Friday. An oversold bounce is definitely a probability. The S&P 500 is now 6 percent off its all-time highs and was as much as 7 percent off those highs. If this is a wave 4 as we suspect, then we should be making a bottom and could crawl back up to 2,900. This is where markets can make double tops or even a small new high. We are after all about to enter the best six months of the year, but as we saw in 2007-2008 that is no guarantee.
Octobers may be well known for crashes but it is also known for lows. We do note the February low at 2,532 and that is the major line in the sand. We are testing the 200-day MA and if the S&P 500 starts trading consistently under that level than lower prices are probably ahead. We can’t take the February 2018 low and still call this a bull market. The daily (short) trend has turned down and the weekly (intermediate) trend has weakened but remains up. Volume picked up this past week but hasn’t hit the levels seen in February. A move over 2,800 would be positive. But if one is looking for new highs then they would have to wait for a move over 2,900. A break of 2,700 would be negative and suggest a decline towards 2,600.
© David Chapman
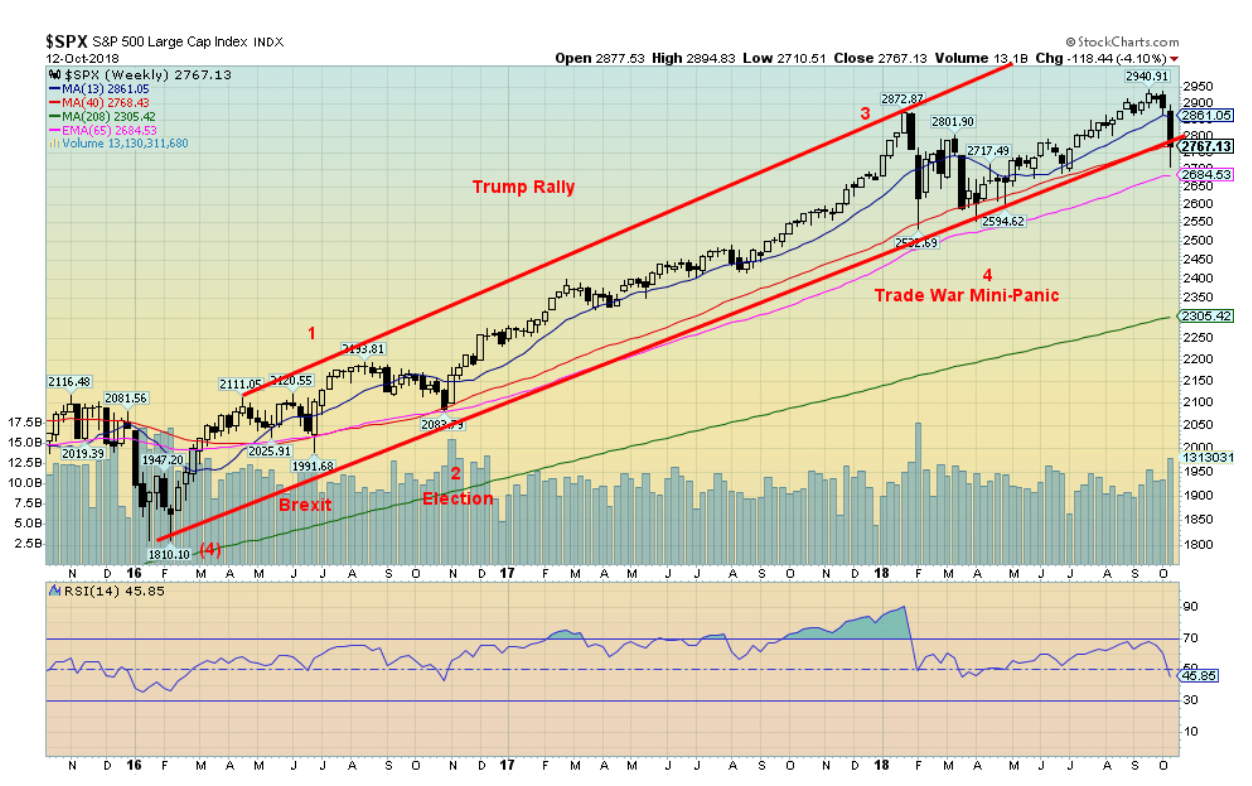
Here is the bigger picture with the S&P 500 from the bottom of what we believe was intermediate wave 4 seen in February 2016. Wave 2 of this up wave was the Brexit and Election mini-panics and wave 4 we believe was the recent trade war mini-panic that bottomed in March 2018. The question is, has wave 5 topped. The answer is yes it has if the S&P 500 takes out the February 2018 low of 2,595. Despite the recent new highs, the RSI did not make new highs on the weekly chart a divergence.
The S&P 500 has penetrated the uptrend from the February 2016 low but has not yet closed under it. Below lies the 65-week exponential MA at 2,685. The four-year MA is way down at 2,305. We haven’t a had a test of that level since the February 2016 low. After crossing above the 4-year MA in 2010 the S&P 500 has consistently held the level ever since. Bottom line is if the S&P 500 breaks the February 2018 low then we could be officially starting a bear market. Only consistent closes under the 4-year MA would confirm the bear.
Any new bear market we suspect will last into 2020 and even as far out as 2022. It will have a lot of hooks to it as bear markets tend to do. A reminder that while the markets topped in 2000 the big break didn’t happen until 2001. The same when the market topped in 2007 but the big break didn’t happen until late in 2008. As of now, we can’t confirm that the markets have topped but a break of the February low would be an excellent confirmation.
© David Chapman
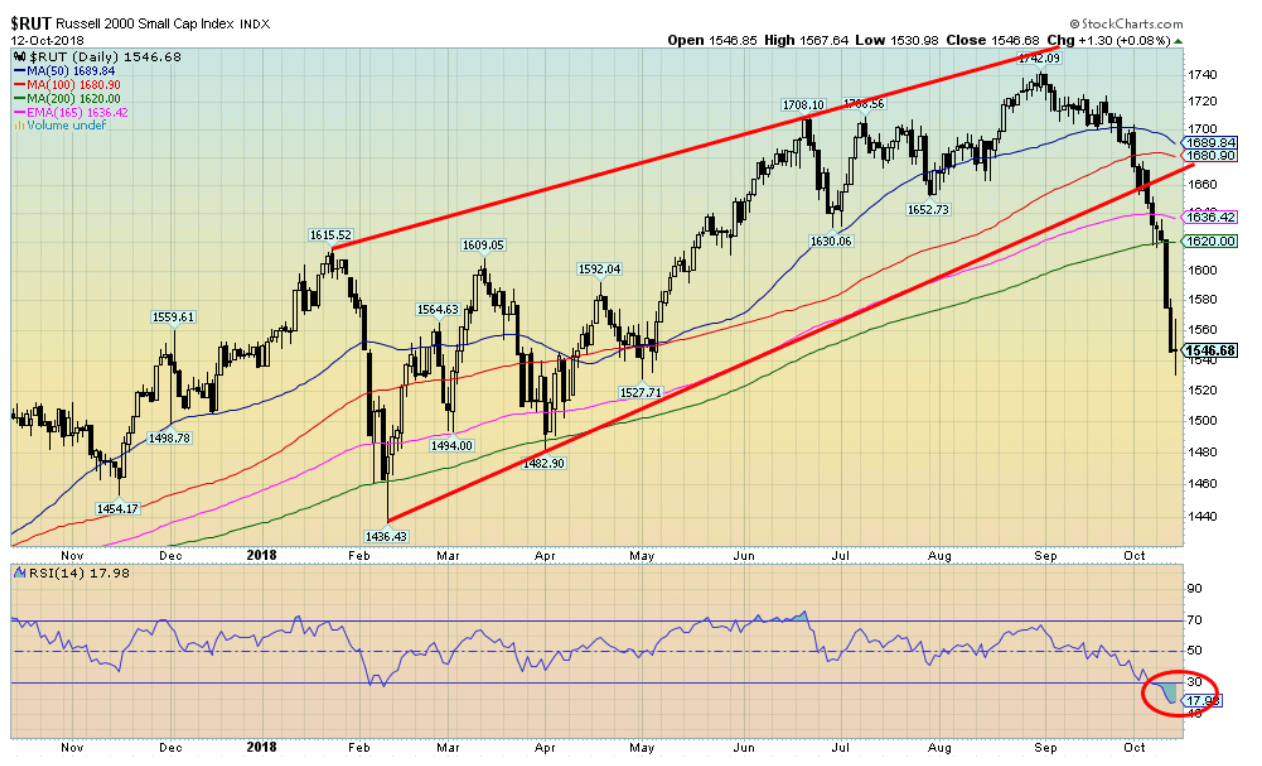
If the small cap stocks lead the way up, they also lead the way down. The Russell 2000 fell 5.2 percent this past week and is now down 11 percent from the all-time high seen in September. Not quite an official bear territory. The Russell 2000 also fell 11 percent in February. But in February the Russell held the 200-day MA. This time it has firmly broken under it. The 200-day MA currently at 1,620 could now act as resistance. Watch the bounce back. Our expectations are that even if the large-cap indices such as the S&P 500 rebound and rise to new highs the Russell will not diverging with the large cap indices. Our assessment here is that an oversold bounce is clearly possible but we are not optimistic that a stronger rebound will get underway. Best case is a rebound back to around 1,700.
© David Chapman
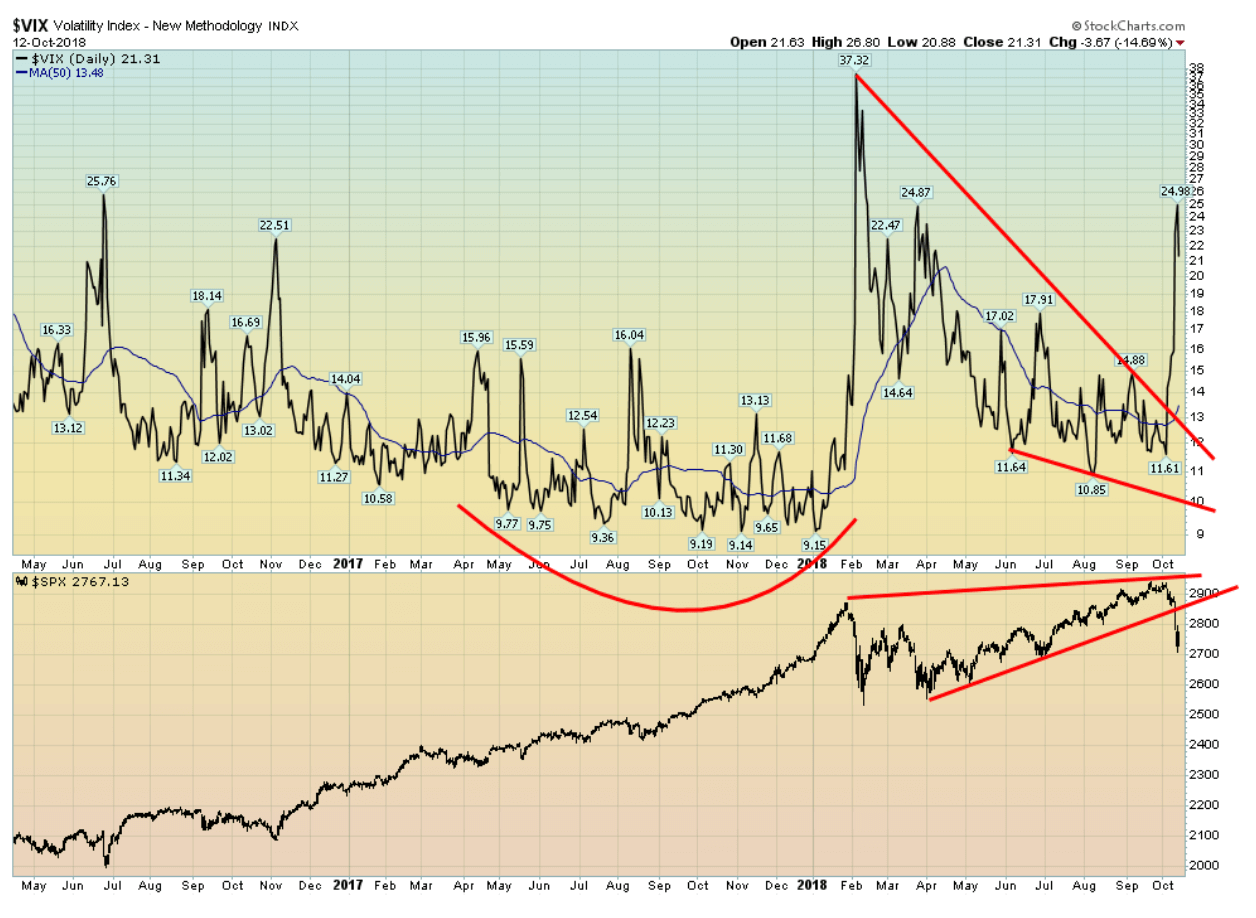
It is no surprise that volatility has jumped as the market tumbled. The S&P 500 appears to have broken the uptrend from April while volatility has hit its highest level since February. The drop into February and March signals a return of volatility following what was a fairly calm 2017. With the return of volatility, we are reminded that volatility in the 1990s started rising 1996 a full four years before the top in 2000 while volatility started rising in 2007 as the markets were on the cusp of the 2008 financial collapse. The VIX peaked in 2008 at almost 60. The all-time low was the 9.14 seen in 2017.
© David Chapman
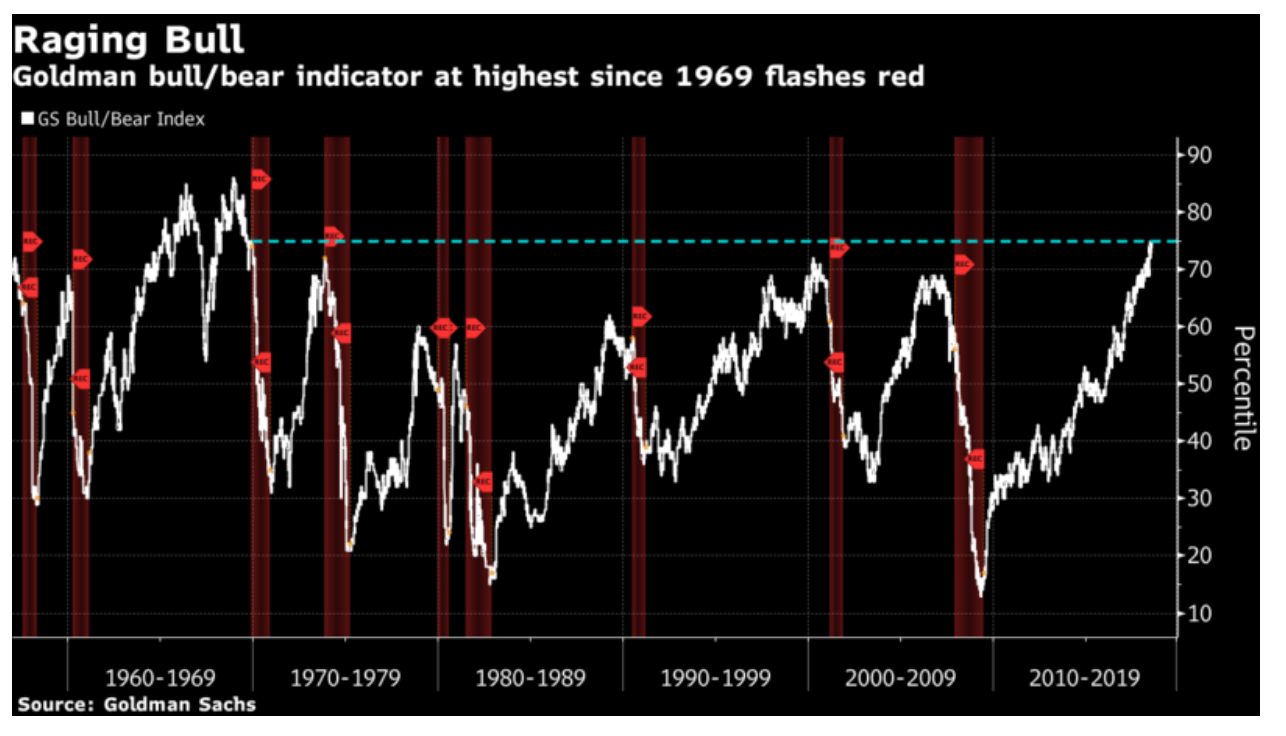
Well, the warning is there. This is a Goldman Sachs bull/bear indicator. It is based on a measure of equity valuation, growth momentum, unemployment, inflation and the yield curve. Right now, it is at the highest level seen since, wait for it, 1969. No, it is not yet through the roof like it was in 1969. The year is interesting in that it marked a top in the stock market (1968 actually) that was followed by a recession in 1970/1971 and a 35 percent + drop in the stock market. Following that a recovery took place that saw the DJI rise to new all-time highs (barely – the famous nifty fifty rally, topping in January 1973) then it was followed by 1973-1974 collapse where the DJI fell 45 percent and other indices fell even more.
The indicator today is higher than it was prior to the 2000-2002 collapse and the 2007-2009 financial crisis collapse both of which saw in drops of over 50 percent. Today the market has been driven upward by the FAANGs a move not unlike the nifty fifty rally of 1972. Does that mean a collapse is coming? Well no, not necessarily. But it is a warning and if we and others are right the collapse will take place and it should once again be one of 50 percent +. Our expectations are that the collapse will occur over 2019-2020 but yes could stretch from there. We have been warned.
© David Chapman
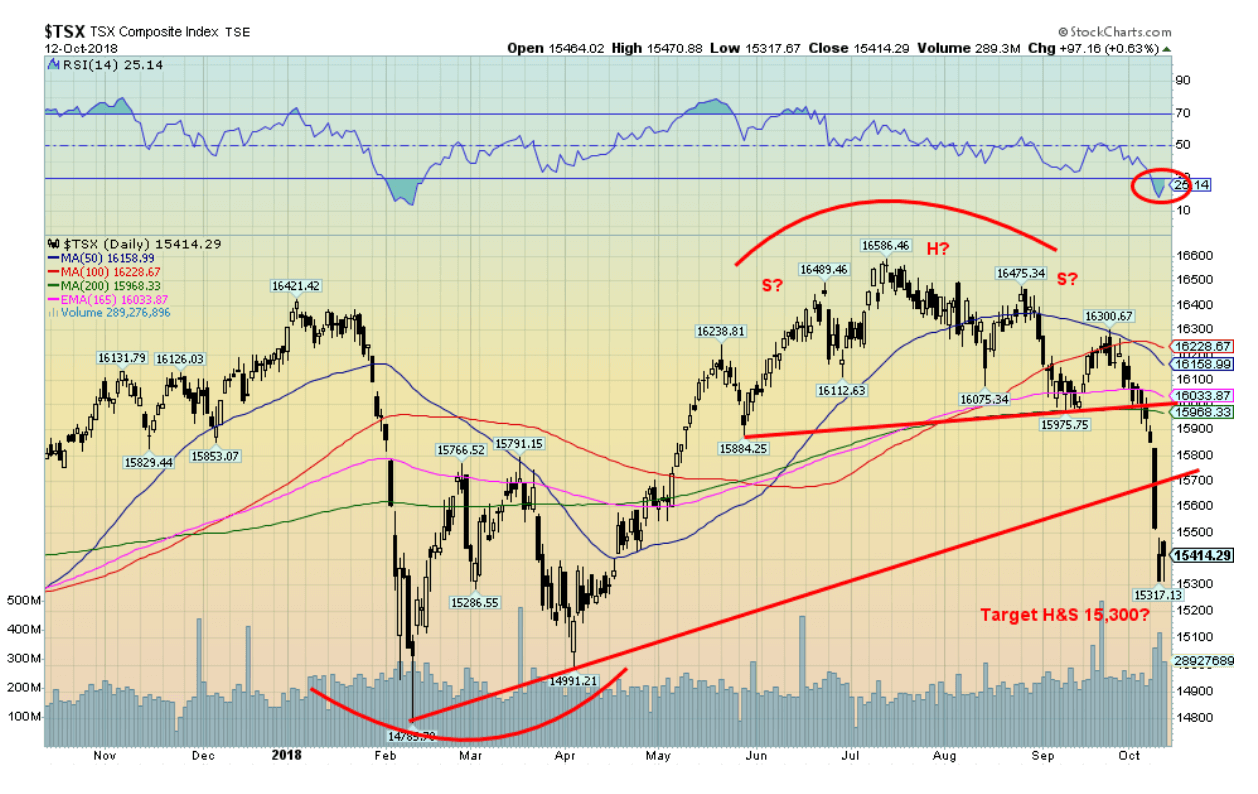
Down she goes and the Canadian TSX Composite landed with a thud this past week falling 3.3 percent. With a low of 15,317, the TSX may have satisfied potential targets from what appears as a head and shoulders top pattern. Naturally, it could plunge right through but there should be at least a bounce here. Few areas look safe given that golds were the best performer this past week. Interest sensitive stocks in telecommunications and utilities are weak as is real estate and the financials appear poised for a major breakdown but definitely could bounce here.
Energy was weak because Canadian producers get lousy prices and the consumer stocks both discretionary and staples both took hits this past week. Industrials were also weak. The TSX has broken support and has now fallen 7.7 percent from its July high and is down on the year. All that is left now is the February and April lows between 14,785 and 15,000. Still, an oversold bounce is possible but overall the TSX doesn’t look healthy. Health Care also hung in this past week along with the jump in golds. Materials overall were steady but it is a mixture of metals, golds and energy.
© David Chapman
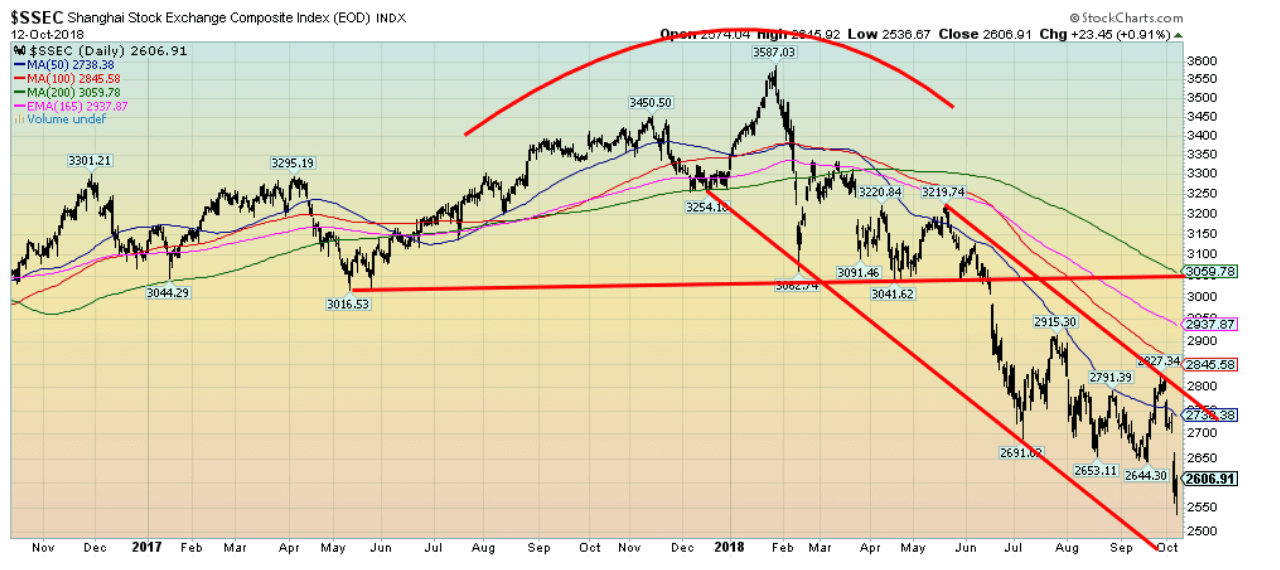
The Chinese Shanghai Index (SSEC) fell to new 52-week lows this past week. It is now down 27 percent from its highs seen in January. The U.S. markets may not be showing signs of concerns but the Chinese SSEC certainly is. The SSEC is officially in a bear market. Oh, it may bounce but signs indicate that this index is headed even lower. And what happens overseas will eventually happen in the U.S. as well. Trade and the maneuvering of the U.S. and China in the South China Sea is causing concern.
© David Chapman
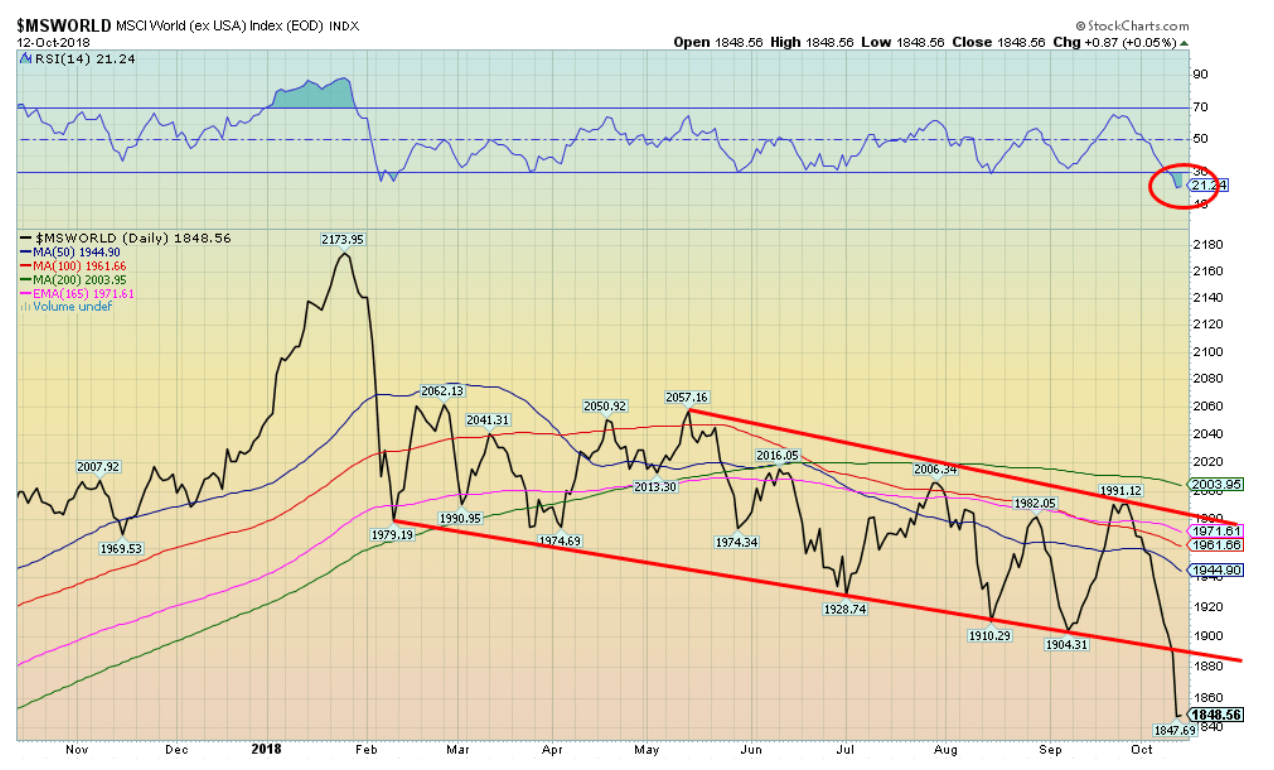
Emerging markets are getting hit and the MSCI Index also known as the MS World Index (ex U.S.A.) fell sharply this past week losing 4 percent. The MSCI also fell out of its down sloping bear channel. It’s probably oversold here and a bounce back towards the breakdown level would not be a surprise. But this chart spells trouble in emerging markets and if there is trouble in emerging markets it will eventually spread to the U.S. markets and the rest of the world.
© David Chapman
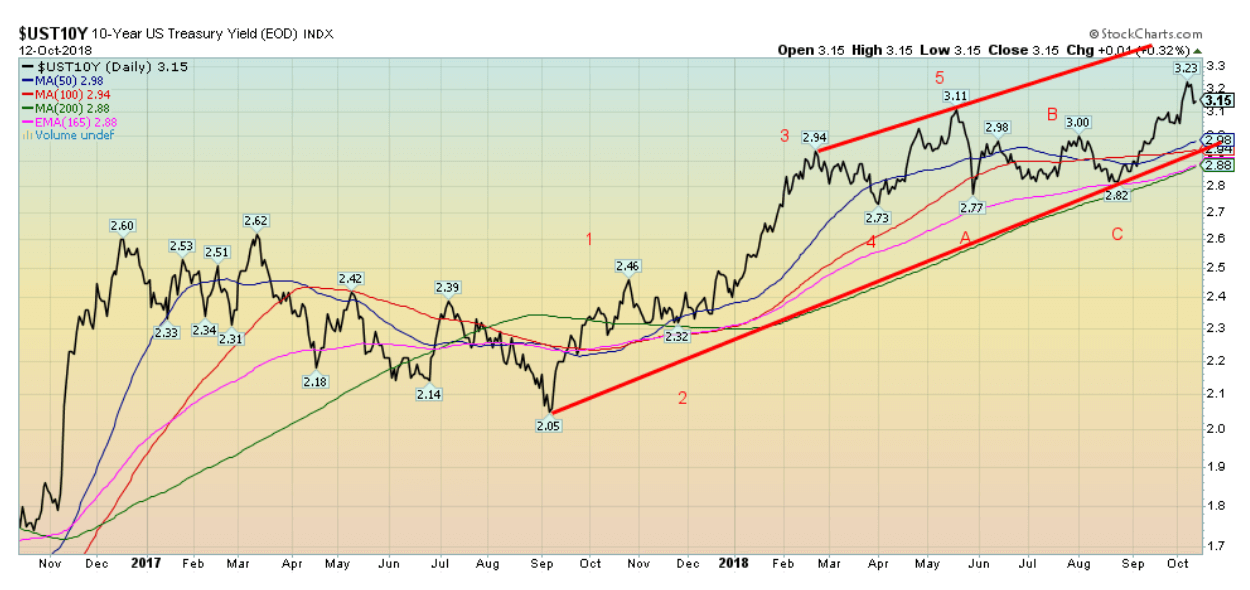
With the pullback this past week in the stock market it should be no surprise that there was at least a small rush into the safety of bonds. The yield on the 10-year U.S. Treasury note fell to 3.15 percent from 3.23 percent. There is also some attractiveness to yields over 3 percent. There is, however, no sign of any top and our expectations are that the upward move should get underway again with potential targets to 3.45 percent to 3.50 percent.
There is some creeping fear that the Chinese will unload treasuries as part of their trade war with the U.S. What the Chinese appear to be doing is shortening their duration of treasuries held and they seemed prepared to allow them to roll off rather than just dump them in the market. Treasury Secretary Steve Mnuchin has said that he’s not worried if China sells bonds saying there are plenty of buyers. But the ECB and the BOJ can’t buy them all. The Fed can though. China’s holdings of U.S. Treasuries fell $7 billion in July the latest figures available. Although on a year over year basis their holdings are up $5 billion. It indicates to us that Chinese are not exactly participating heavily in the U.S. bond auctions. We note Japan’s holdings rose $5 billion July while Singapore also saw its holdings jump $5 billion as well. Over the past year, foreign holdings of U.S. Treasuries have gone up by $31 billion with most of it going into T-Bills.
Recession watch spread
© David Chapman
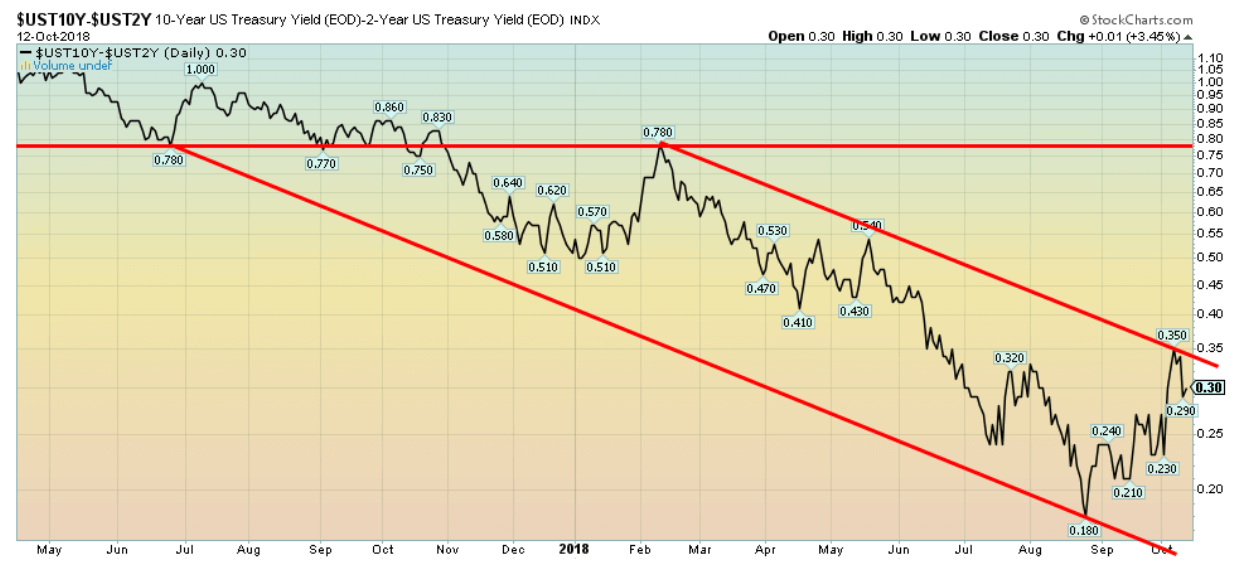
Our recession watch spread also known as the 2-10 spread (2-year treasury note – 10-year treasury note) fell this past week to 30 bp from 35 bp as the yield rose slightly on the 2-year as the yield fell on the 10-year. Still nowhere near negative spreads that might indicate an oncoming recession. The major direction remains down despite the recent bounce. The Fed is prepared to hike rates again in December despite the ramblings of the President. The 2-10 spread should continue to narrow going forward but a negative spread probably won’t happen until at least mid-year 2019.
© David Chapman
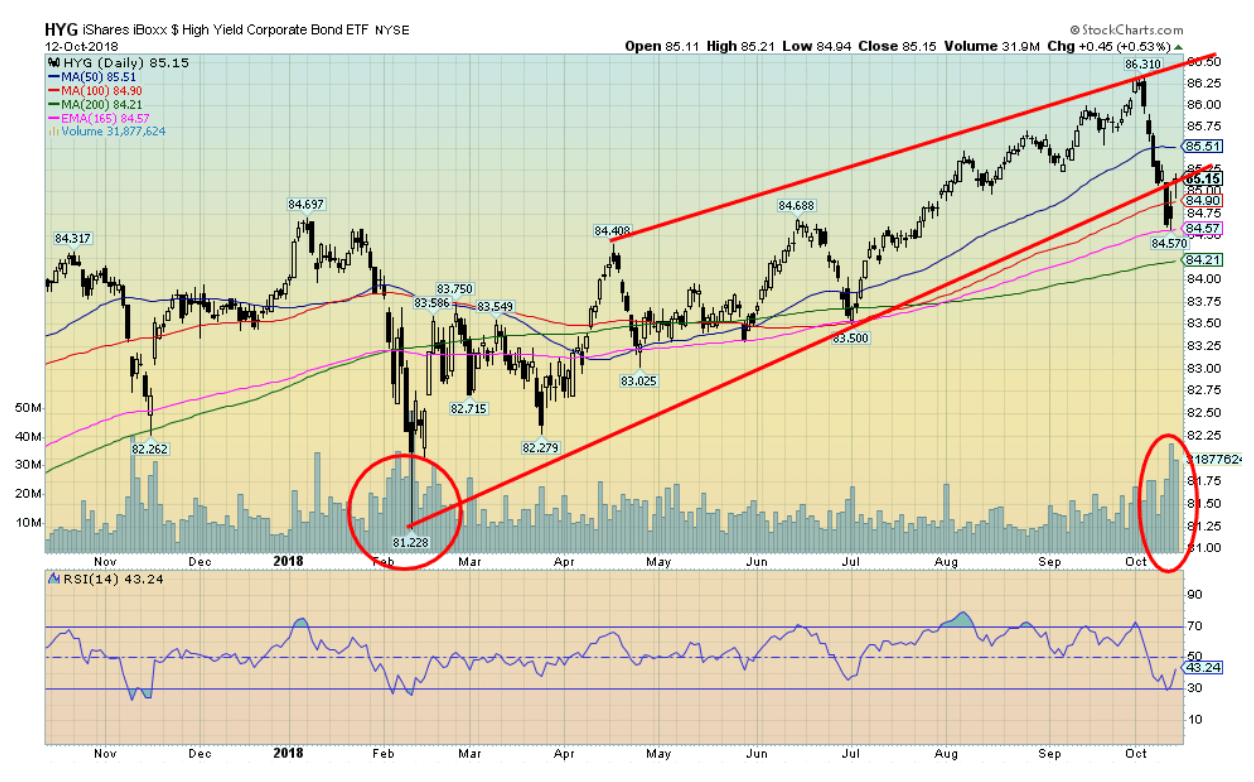
It is probably no surprise that high yield bonds took a hit this past week along with the stock markets. Here is the iShares iBoxx $High Yield Corporate Bond ETF (HYG) that fell this past week but is only down roughly 2 percent from its recent high. That’s actually better than the performance of the S&P 500. Volume jumped. It is no surprise they fell but our expectations would have been that it would fall more than the S&P 500. Resilience is present.
© David Chapman
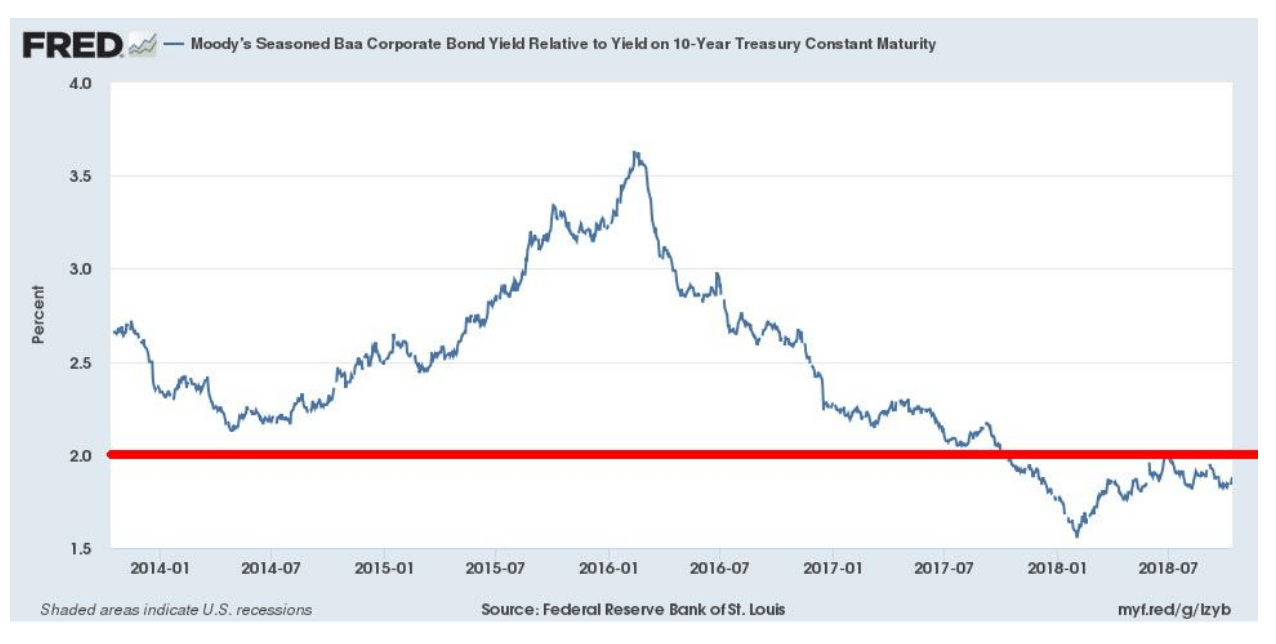
Here is another way of looking at the high yield bonds. This is the spread between Moody’s Baa bonds (still investment grade) and the U.S. 10-year treasury bond. After rising from its lows in January the spread has been relatively steady currently around 1.8 percent up from the lows near 1.5 percent. Another sign that the market is not yet panicking about yields on high yield bonds (sometimes known as junk bonds).
© David Chapman
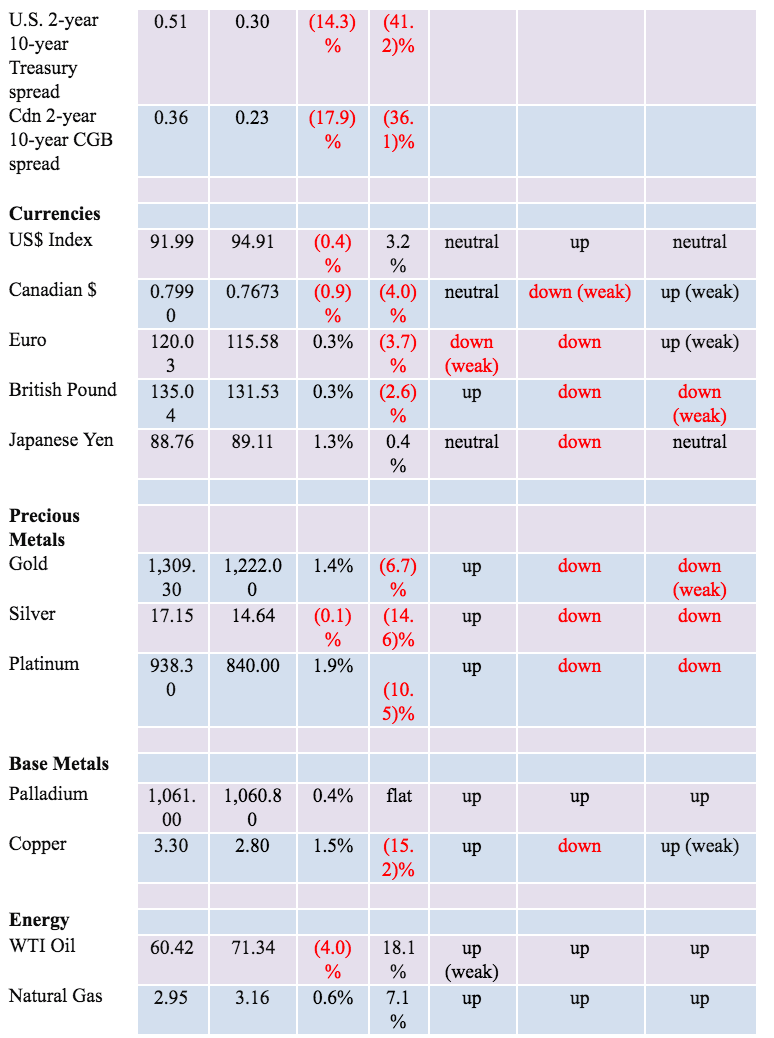
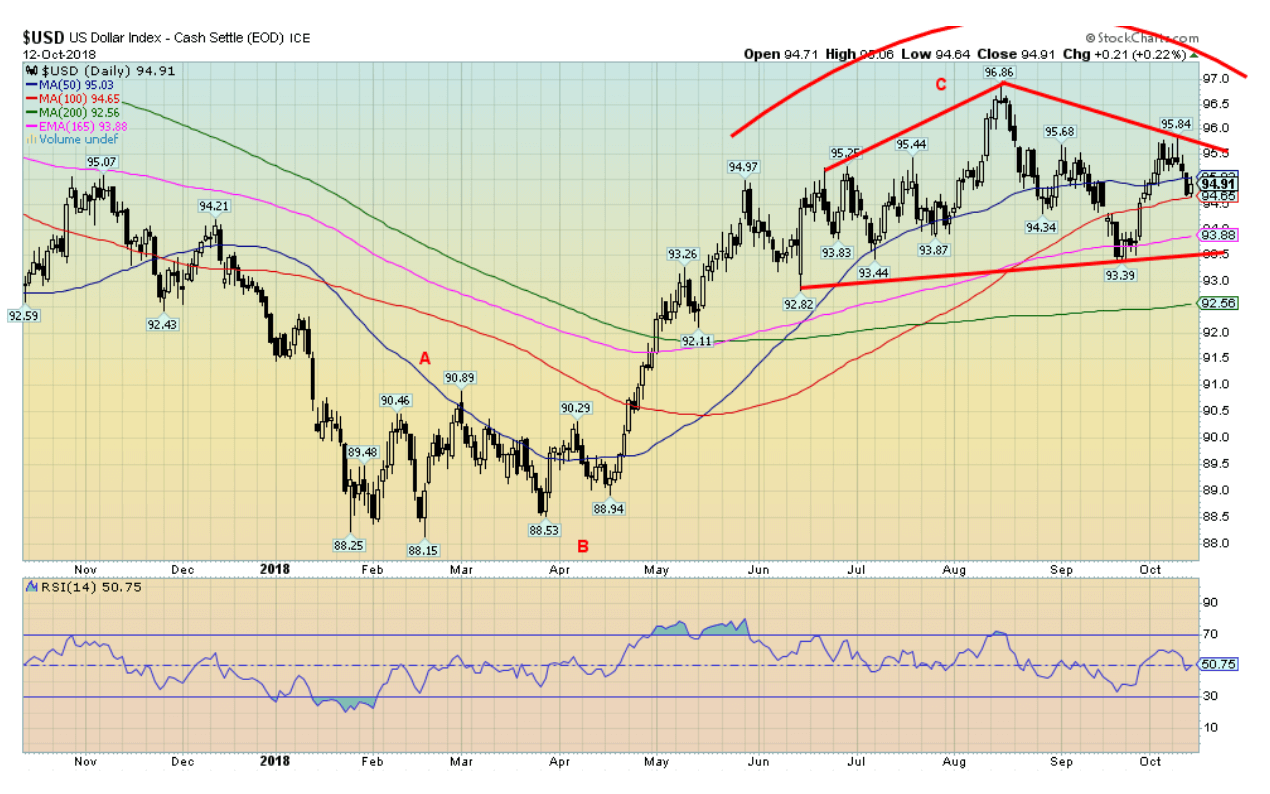
The US$ Index continues to trace out what appears to be a broadening top. We could make an argument it is even forming a rare diamond pattern. The pattern breaks down under 93.50 and projects down to at least 89.50. We continue to believe that the US$ Index formed an ABC type corrective move from the lows seen in February 2018 at 88.15 and topped at 96.86 in August 2018. The US$ Index fell 0.4 percent this past week. The Euro gained 0.3 percent which is surprising given the problems with the Italian banking system.
The British Pound seems to be shaking off Brexit fears and also rose 0.3 percent. But the big gainer was the Japanese Yen up 1.3 percent. Given the U.S. and EU focus it is not surprising that Japan seems lost in the shuffle. But the Yen remains the third most traded currency behind the US$ and the Euro. China may be rising but it hasn’t even supplanted the Yen just yet. The Cdn$ fell 0.9 percent as some believe Canada came out short on the recent re-working of NAFTA now called USMCA trade agreement (wish they could stick to acronyms one can pronounce). Admittedly, it is difficult dealing with a partner that doesn’t want to negotiate but instead dictate and threatens if they don’t get their way. Naturally, for our scenario to play out for the US$ Index, no new highs should be seen above 95.84. A falling U.S. dollar would be positive for gold that jumped this past week as the U.S. dollar fell.
© David Chapman
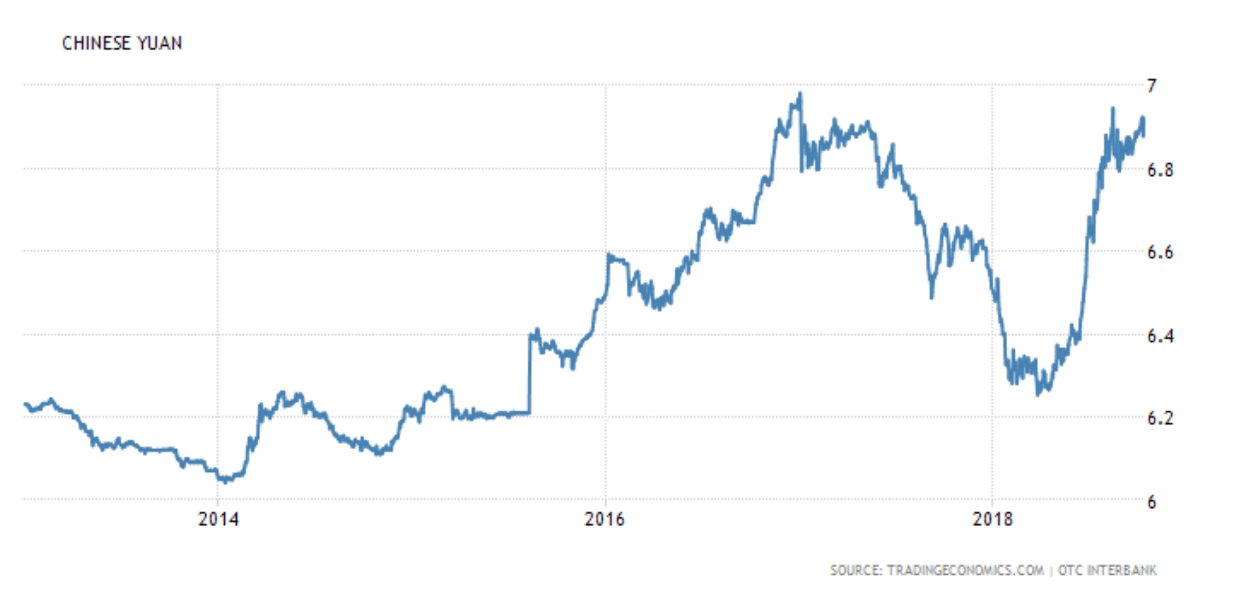
The Chinese Yuan reached its highest level in almost two years US$ = 6.9 yuan on October 12, 2018. It is still well short of the long period of stability where the yuan was fixed at just over 8/US$. That period existed from roughly 1994 to 2006. After that, the yuan went through a period of rising against the US$ falling to around 6.2/US$ in 2014. After that, the yuan fell once again against the US$ rising to around 6.9/US$ in 2016.
The U.S. and China are locked in a trade war that also includes accusations of currency manipulation. The IMF has expressed concern about the growing rift between the U.S. and China that not only encompasses trade, currencies, China’s belt and road initiative, China’s creation of yuan trading zones and trading in yuan with other countries, rifts over Taiwan where the U.S. is selling more arms to Taiwan and threatens to sail through the straits that separate China and Taiwan, and the rift in the South China and East China seas where Chinese and American warplanes have locked on each other and warships have come close to colliding.
China is the world’s second largest economy and is expected to surpass the U.S. economy in the next 10-15 years. This presents a major problem for the U.S. China, unlike the U.S., still has massive borrowing power as its government debt/GDP is around 47 percent vs. 105 percent for the U.S. China’s debt problem is centered on corporations where there have been growing defaults. While China’s government debt/GDP is still low it’s overall debt (government, corporations, consumer) is approaching levels seen in the west at 300 percent +. China also holds $1.2 trillion of U.S. Treasuries and they have slowed their purchases and letting maturities roll off rather than any great sell-off a move that could be devastating for the U.S. bond market. Given that China’s purchasing power parity is about a quarter of what it is in western countries such as Canada and the U.S. the massive amount of debt could prove to be a burden. Couple that with currency wars, trade wars and threatening real wars no wonder the IMF is concerned that the U.S./China rift could cause a global slowdown. The IMF has urged the parties to get together to work out the problems. A collapse centered on China/U.S. would have even worse repercussions into emerging markets where there has been massive borrowing in U.S. dollars.
© David Chapman
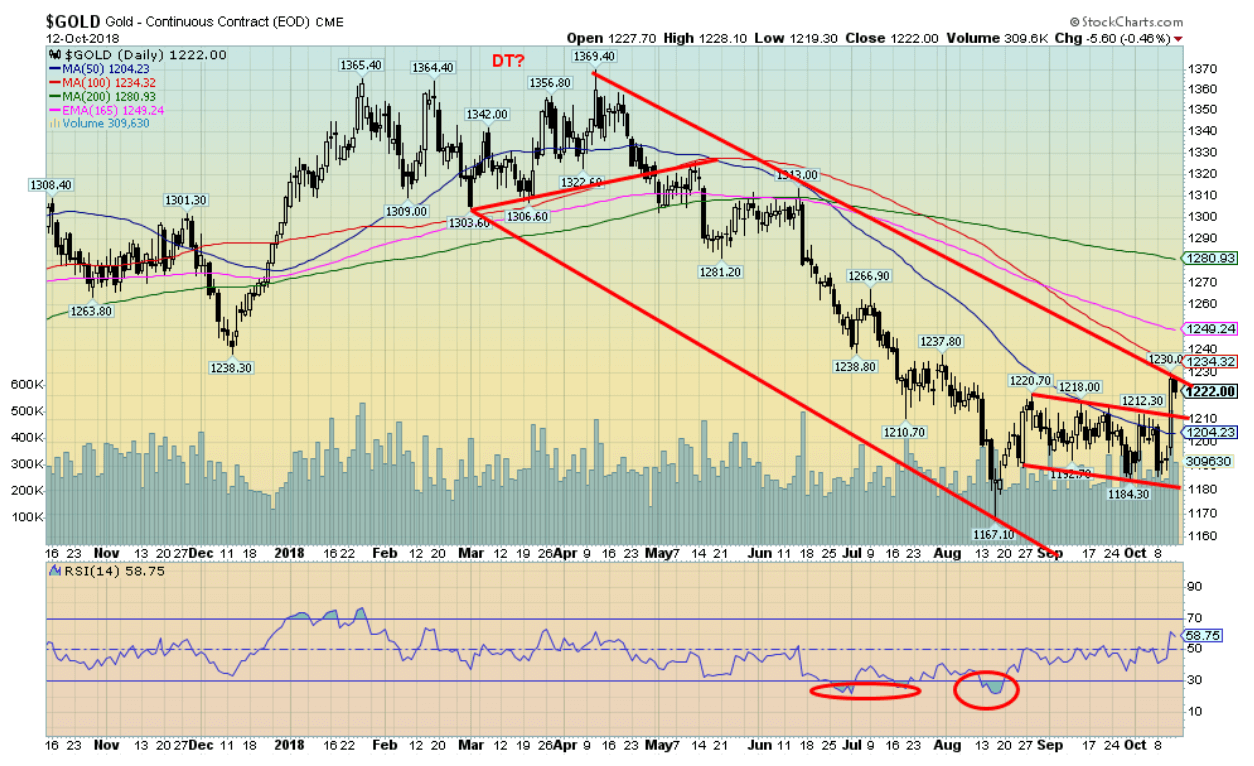
After appearing to consolidate for a number of weeks coming off the August bottom of $1,167 gold burst through resistance this past week at $1,210 $1,220 and settled the week at $1,222. $1,210 should now act as support on any pullback. Grant you, gold still has considerable work to do as the charts indicate considerable resistance from roughly $1,230 to $1,250. The 200-day MA resistance is seen up at $1,280. The breakout of the consolidation pattern this past week would appear to indicate a move to at least $1,226, which was accomplished this week. So, gold might consolidate further here before making the move over $1,230/$1,250.
Naturally, a lot depends on the action of the U.S. dollar but as we indicated the U.S. dollar appears to be tracing out a large topping pattern. We have seen discussions on the potential for a new gold standard and are reminded that President Trump is actually a fan of a gold standard. Gold also has a history of performing well under Republican Presidents and poorly under Democrat Presidents. It is not exact by any means. But gold started it’s 1970s rise under Nixon and Ford even as it topped in 1980 under Carter. Gold found a major bottom in the middle of the Reagan Presidency and it continued under Bush 1 but petered out under Clinton. Similarly, gold started another long climb under Bush 2 and while it took a few years it peaked under Obama before collapsing and making its final low (so far) a year before the election of Trump. Since gold is negatively correlated to stocks (see Chart of the Week) it is not surprising that the stock markets tend to do better under Democrat Presidents. It is not exact by any means.
© David Chapman
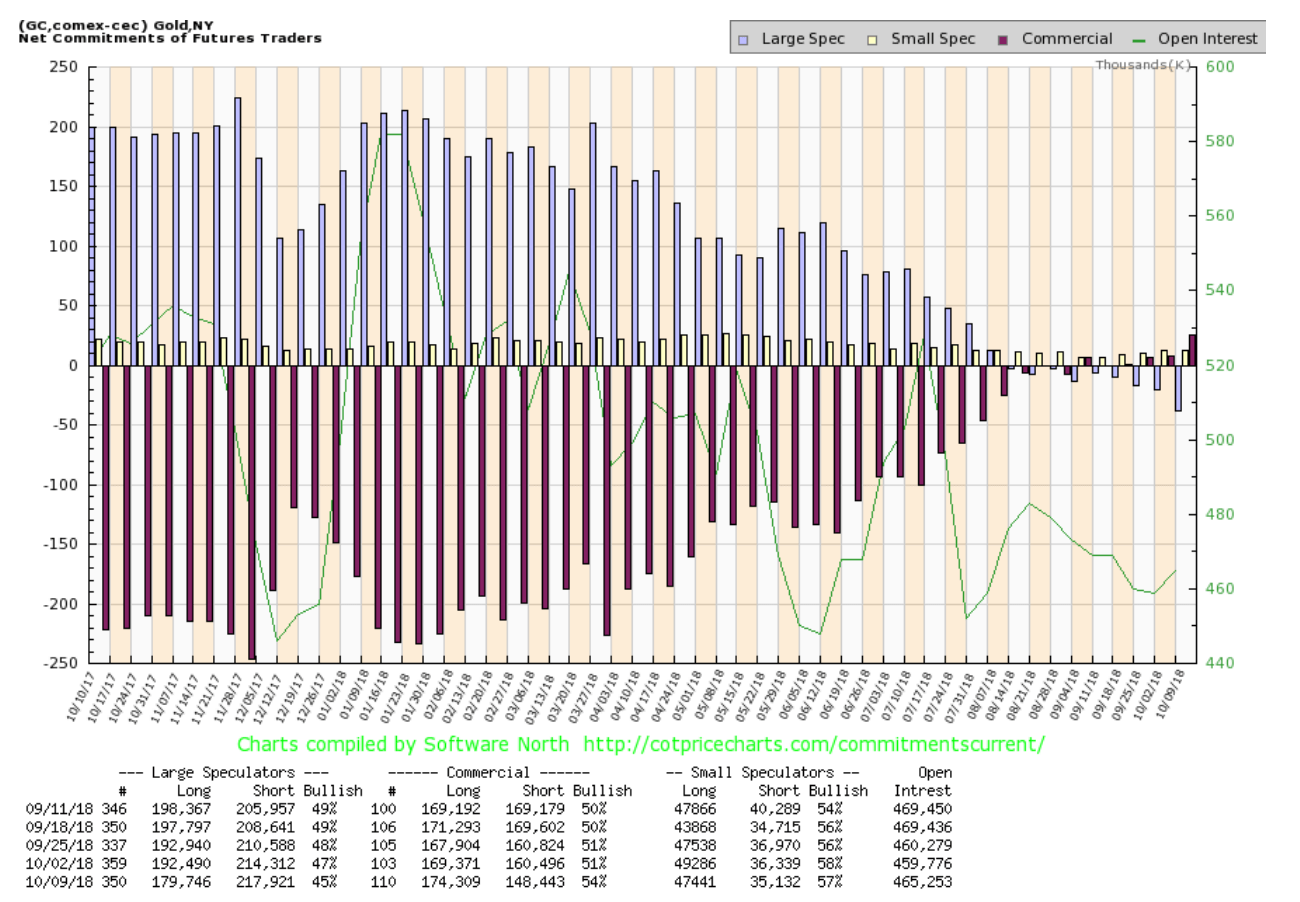
The commercial COT for gold this past week gave us one of the most if not the most bullish report we have ever seen. It jumped to 54 percent from 51 percent the previous week. We have never seen it at these lofty levels. This is bullishly encouraging. Now we need to match the price action with what appears to be a very bullish report. Long open interest jumped roughly 5,000 contracts this past week while short open interest fell a whopping 12,000 contracts. The large speculators (hedge funds, managed futures etc.) fell to 45 percent from 47 percent. Just as we have never seen the commercial COT so consistently over 50 percent we have never seen the large speculators COT so consistently under 50 percent. It all seems to be telling us that gold is primed for a significant upward move even a potentially explosive upward move.
© David Chapman
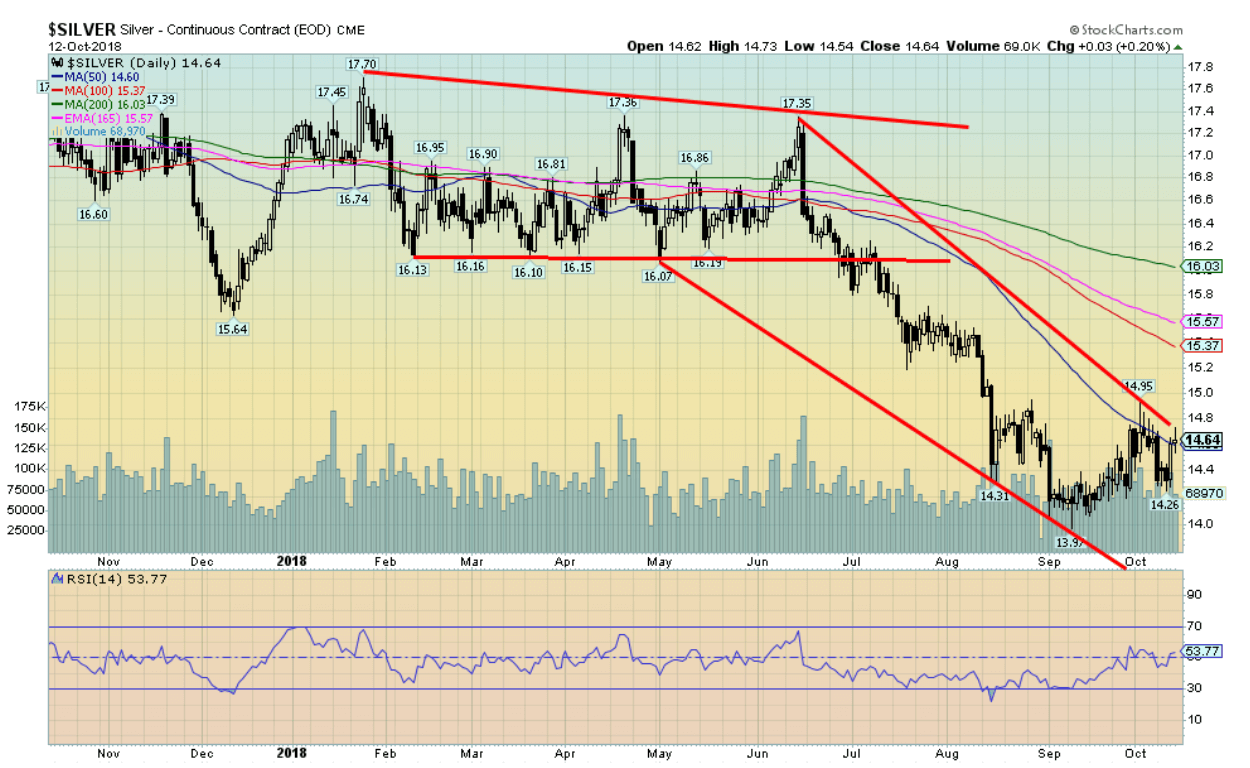
Despite the good up week for gold and the gold stocks all silver could manage to do was essentially stay flat. Trouble was silver prices fell more dropping from $14.95 to a low of $14.26 before recovering. Note silver failed at the falling 50-day MA so we have to overhaul that level currently at $14.60. We at least closed over that level for the 2nd week in a row. But we see further resistance at $15 and then at $15.40 to $15.60. We could be forming an odd-looking head and shoulders bottom. We didn’t label it but note the lows at $14.31 in August (left shoulder?) the September low of $13.97 (head?) and the recent low at $14.26 (right shoulder?). The awkward neckline would come in at roughly $15. A breakthrough could project up to at least $16. Note the 200-day MA is currently at $16.03. Silver had recently consistently failed up around 200-day MA being repelled every time it tried to bust through. The 2018 high of $17.70 seems a long way off. We note considerable congestion resistance from $16 to $16.40. Silver has a lot of work to do.
© David Chapman
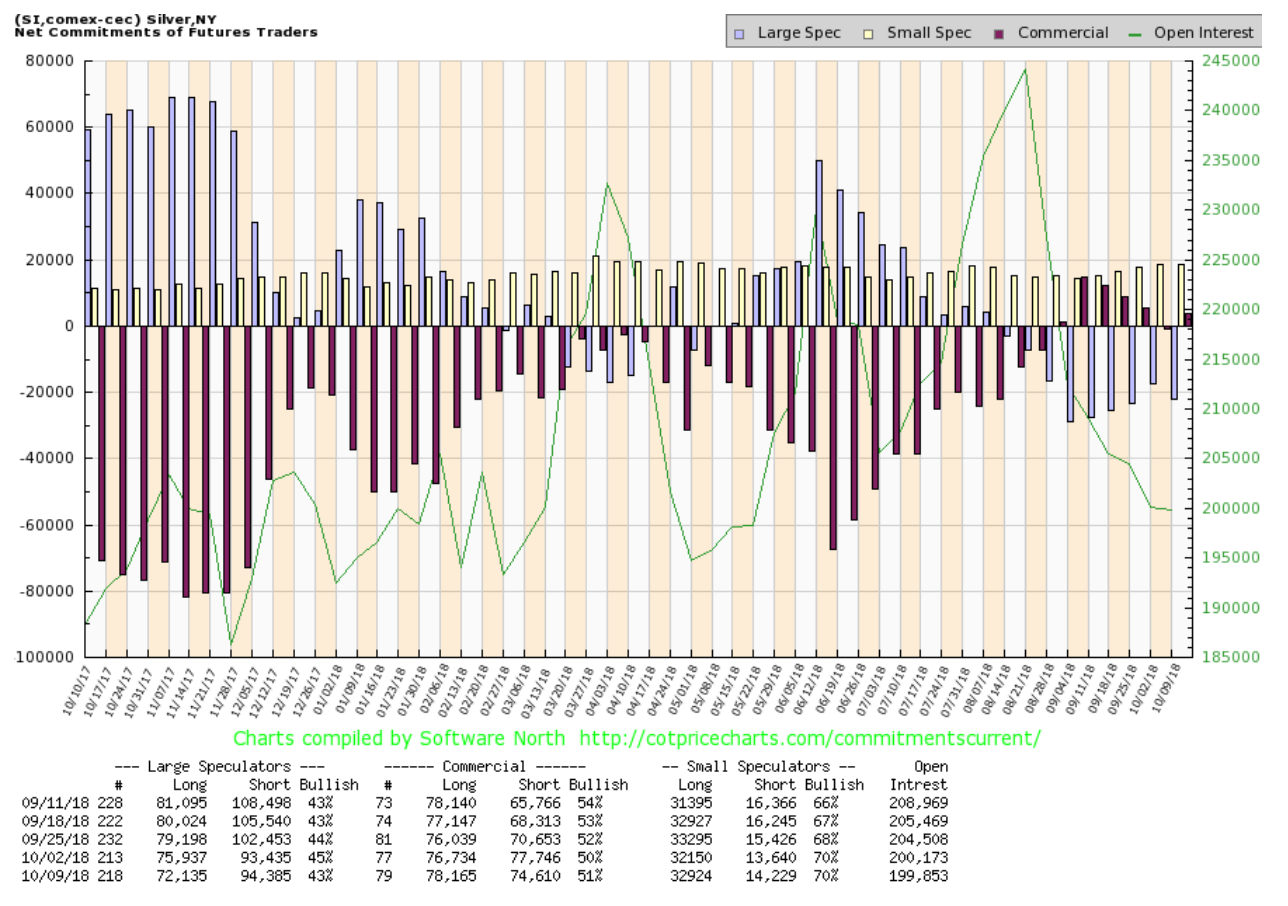
The silver commercial COT remained quite bullish this past week improving to 51 percent from 50 percent. Long open interest jumped about 1,500 contracts while short open interest fell roughly 3,000 contracts. The large speculators COT slipped to 43 percent from 45 percent as they continue to hold record shorts. This report is as of October 9 and the big up move came on October 11. We will anticipate next week’s report that would be as of October 16. Nonetheless like the gold commercial COT this is encouraging and bullish.
© David Chapman
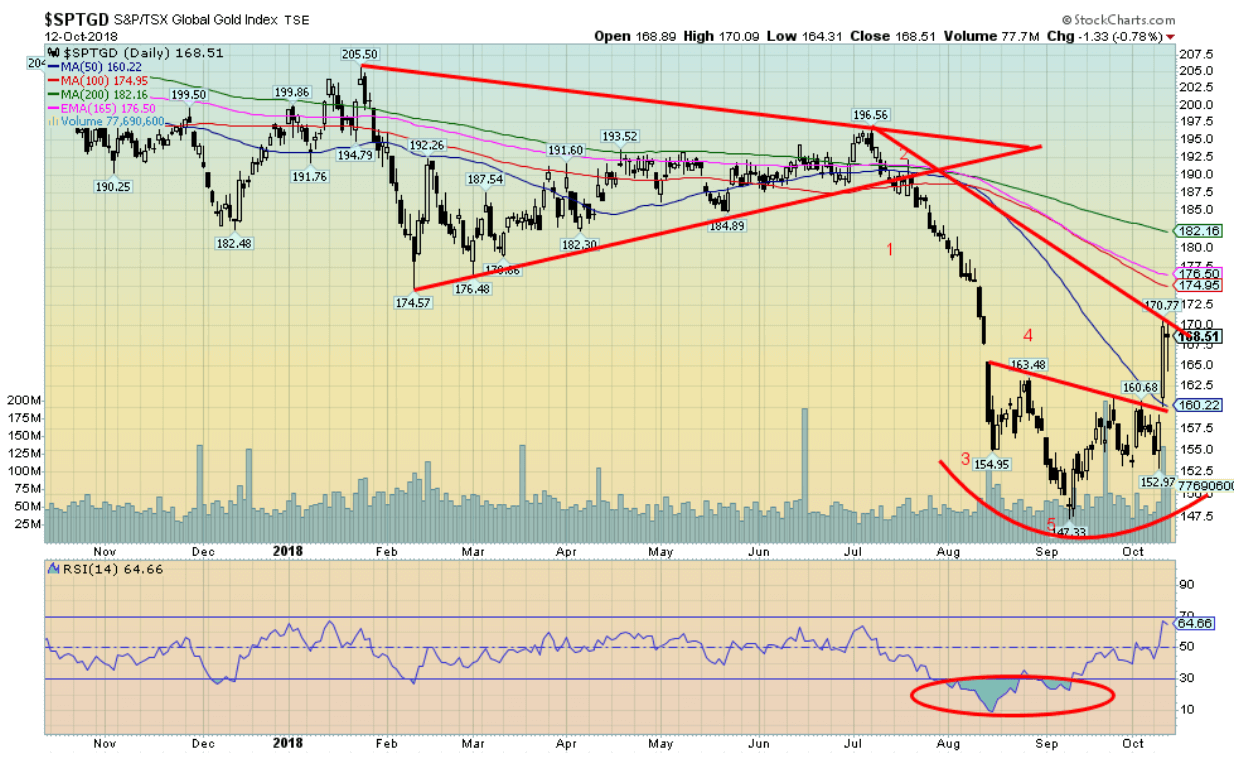
Gold stocks finally showed some life this week as the TSX Gold Index (TGD) broke out of what appears as a small head and shoulders bottom pattern. The TGD gained a strong 7.2 percent this past week while the Gold Bugs Index (HUI) jumped 6.9 percent. It was the strongest showing for the gold stocks in months. The small H&S pattern suggests a move to at least 177. That would put the TGD in the heart of the resistance zone that stretches from 174 to 182. There is some resistance here at 170 but once through that level we should make the next move up into the 174/182 resistance zone. 160 should now act as support. The RSI indicates there is considerable room to move higher and the Gold Miners Bullish Percent Index (BPGDM) currently at 23 has considerable room to move higher before it is overbought.
© David Chapman
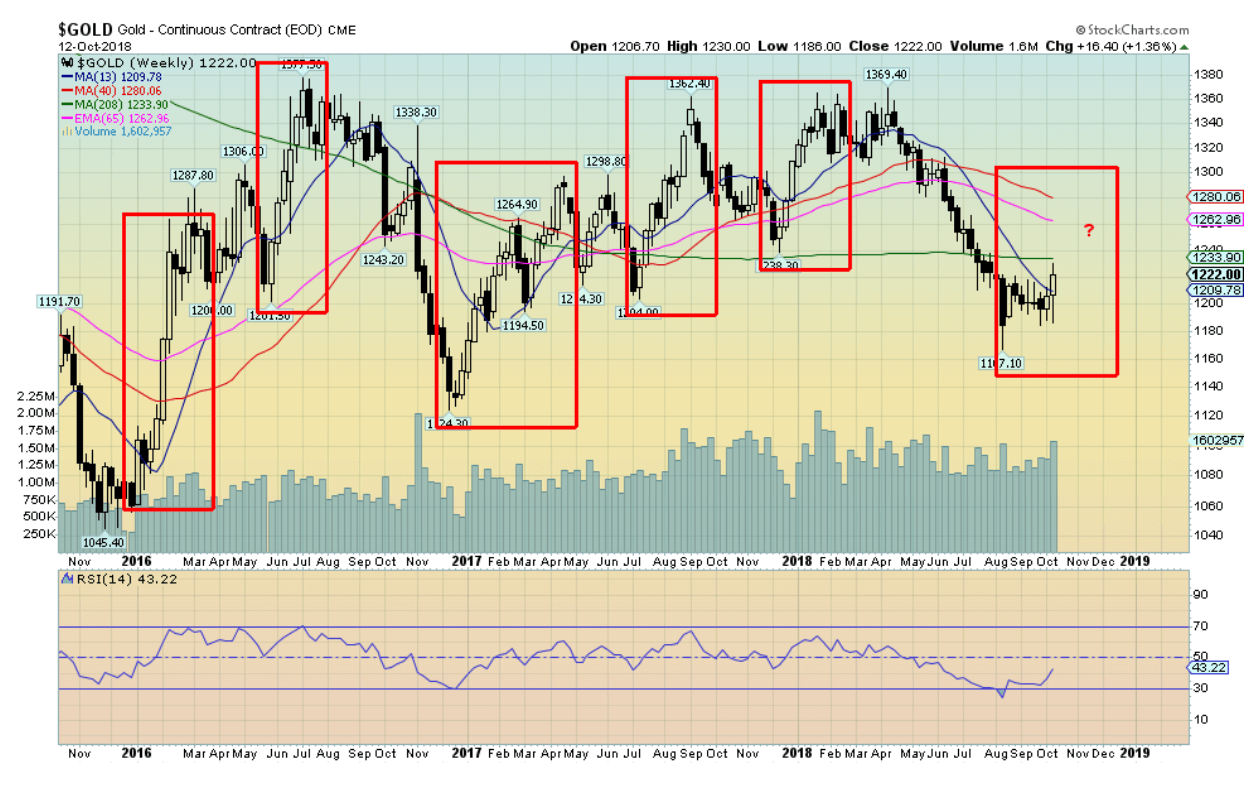
Thanks to our colleague Michael Ballenger for noting gold’s bull windows. The move this past week bears considerable resemblance to the moves seen over the past three years that have resulted in at least a bull move of some significance. If correct than a multi-week advance is likely in process of getting underway. Above is a weekly chart and we can’t help but note that the 4-year MA is currently at $1,233 and should act at least initially as resistance. Above lies another important weekly MA, the 40-week along with the 65-week exponential MA. These resistance levels are up to $1,280. Over $1,280 and especially over $1,300 gold should really perk up. For the past three years, those zones have acted like a lid on gold’s advance even as gold teased over those levels. But gold could never hold them and consistently fell back. After failing in 2016 and again in 2017-2018 we may be primed for a much stronger and more prolonged advance. We have noted the presence of a 34-week cycle with a range of 28 to 40 weeks even 42 weeks. The last one was the low in December 2015 and it indicated that the next low was due October 2018 +/- 6 months. We are smack in the middle of that cycle low window. Our expectation is for a move up at least on the scale of December 2015/July 2016 that saw gold climb from $1,045 to $1,377 a move of over $300. A similar move this time could carry gold as high as $1,475 with at least a range of $1,425 to $1,525. The upper level of that range was the lows seen in 2011/2012 before the gold market collapsed in 2013.
© David Chapman
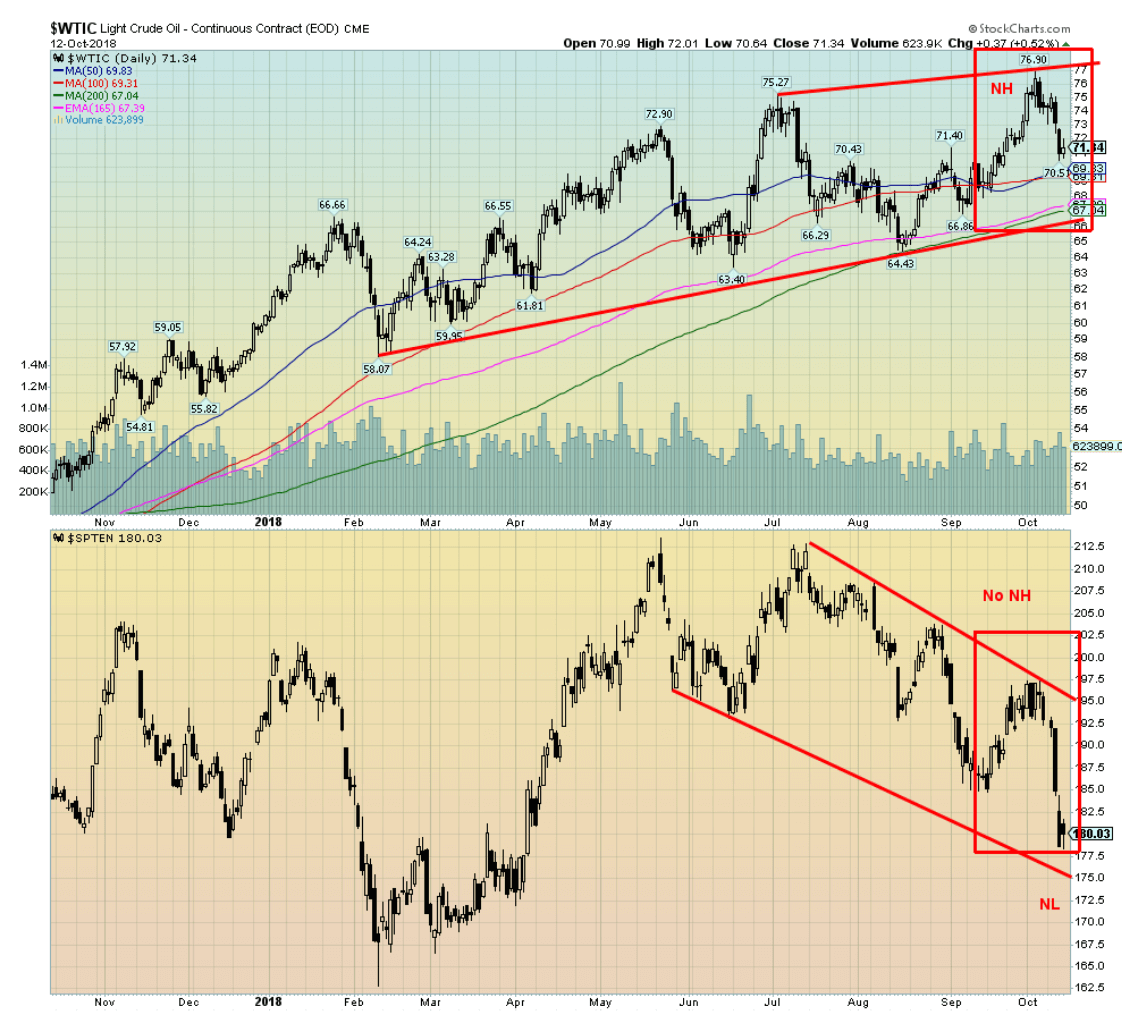
WTI oil prices fell back this week with the drop in the stock markets. WTI oil fell 4 percent on the week. The energy stocks as represented here by the TSX Energy Index (TEN) fared just as badly losing even more off 6.7 percent. There was some fear that Hurricane Michael might disrupt oil rigs in the Gulf of Mexico but when that didn’t materialize WTI oil fell. There is also concern that demand remains somewhat muted and the world is adequately supplied. But looming is the sanctions against Iran. Saudi Arabia, the U.S. and Russia, the world’s largest producers, are already pumping near capacity and have limited ability to replace any loss of Iranian oil. The U.S. canceled the nuclear deal and put sanctions on Iran but the other signatories to the deal are not happy about that. Many countries have indicated they intend on continuing to buy from Iran including China, India and even the EU. They are all looking for ways to work around U.S. sanctions with alternative payment methods.
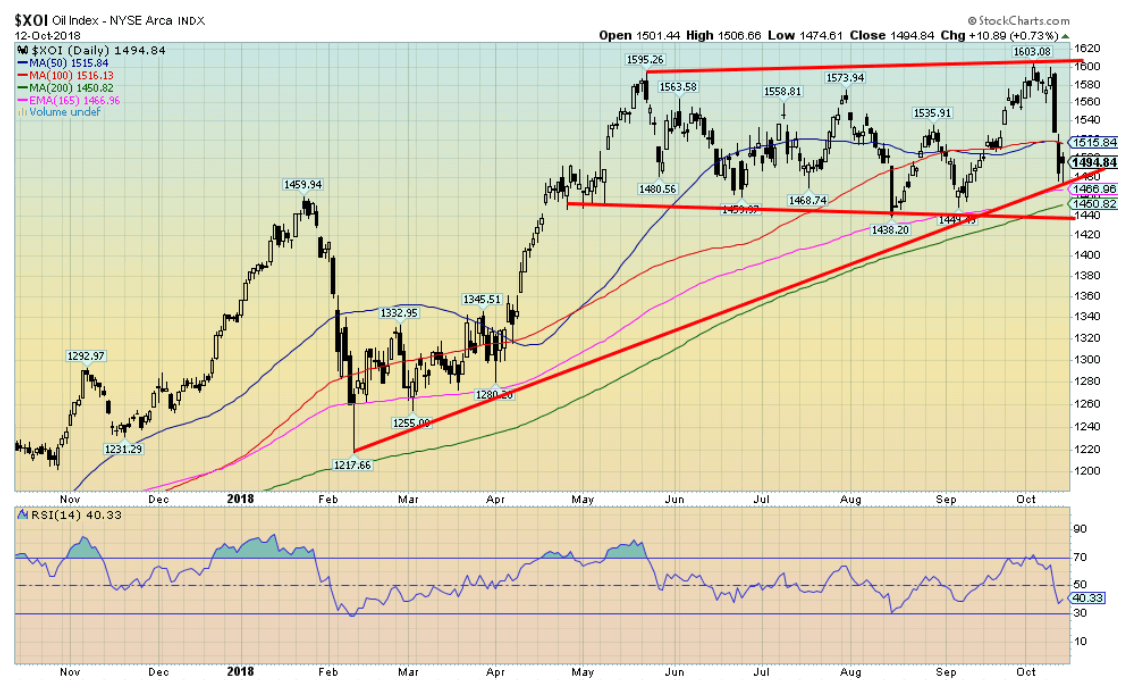
What struck us about the chart of WTI oil and the TEN is that WTI oil made new 52-week highs a week earlier but the TEN did not. Not even close. This past week as prices fell the TEN was weaker and even fell to new lows for the current move down. These divergences are not unusual but it does need resolving. But the Canadian energy stocks are influenced by the terrible price Canadian producers receive. WTI oil may be trading at $71 but Canadian oil is trading at $52. So that in all likelihood is weighing on the Canadian energy stocks. Below is a chart of the NYSE Arca Oil Index (XOI). Note it made new highs largely in line with WTI oil and the decline this past week was 5.5 percent still not exactly robust but better than the TEN. As well the XOI did not make new lows. The XOI appears to be trading largely in line with WTI oil. If there is a negative about the XOI chart is that it could be making a broader top. The XOI breaks out over 1,600 but breaks down under 1,400. WTI oil also breaks down but under $67. Those levels should be monitored. Otherwise, we believe we should see higher prices going forward. The XOI’s seasonals don’t really get underway until December. The sector can typically exhibit weakness in the September/November period. We are now in the heart of that period. As long as the XOI holds its breakdown line and WTI oil does the same our expectations are that once this weakness is out of the way they should start to rise again.
© David Chapman
Chart of the week
© David Chapman
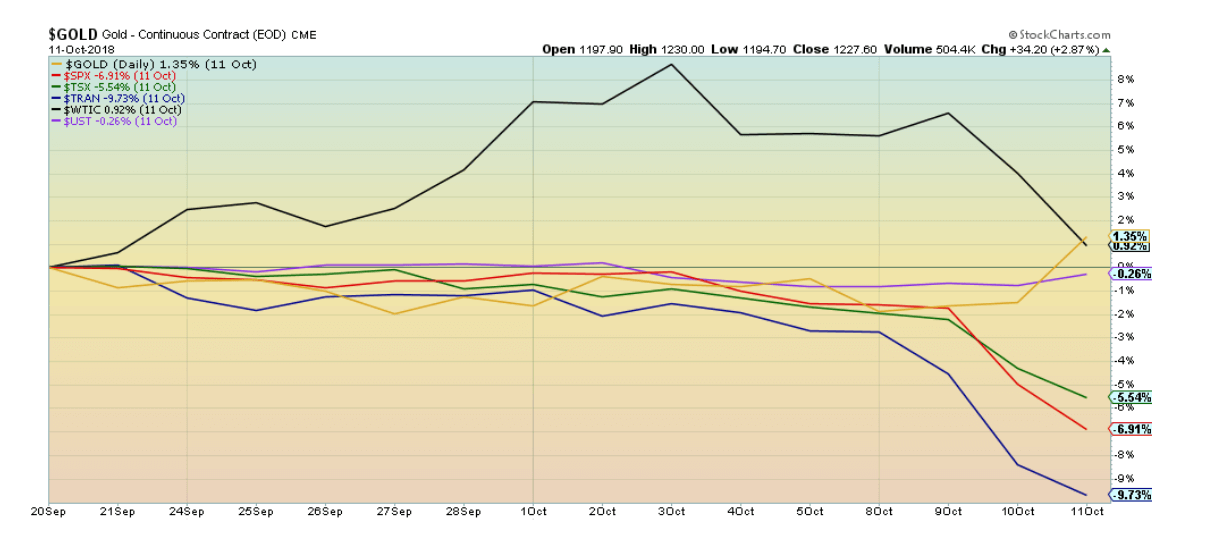
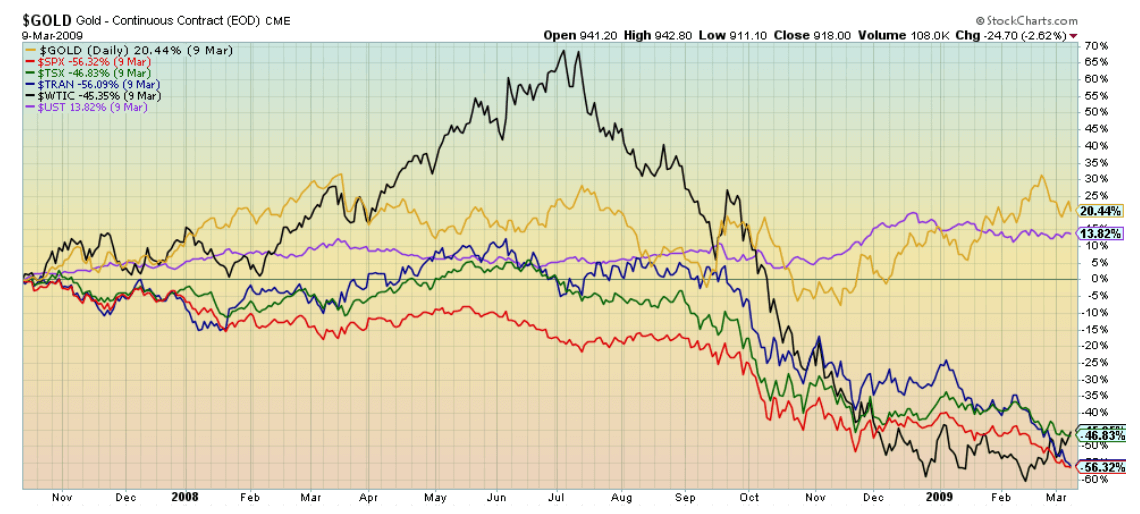
Negative correlation in action. Since the markets started to fall following a peak on September 21, 2018 gold, who is negatively correlated to stocks, has gone up 1.4 percent vs. a 6.9 percent decline in the S&P 500. The chart above compares the relative performance of gold, S&P 500, TSX Composite, Dow Jones Transportations (DJT), WTI oil and the CME CBOT 10-year U.S. Treasury note price (UST). All have a negative performance with the exception of gold and oil. And oil prices have been falling. As this chart shows along with the charts below gold outperforms during periods of financial stress. The UST only started trading in 1999 so all data is not available.
© David Chapman
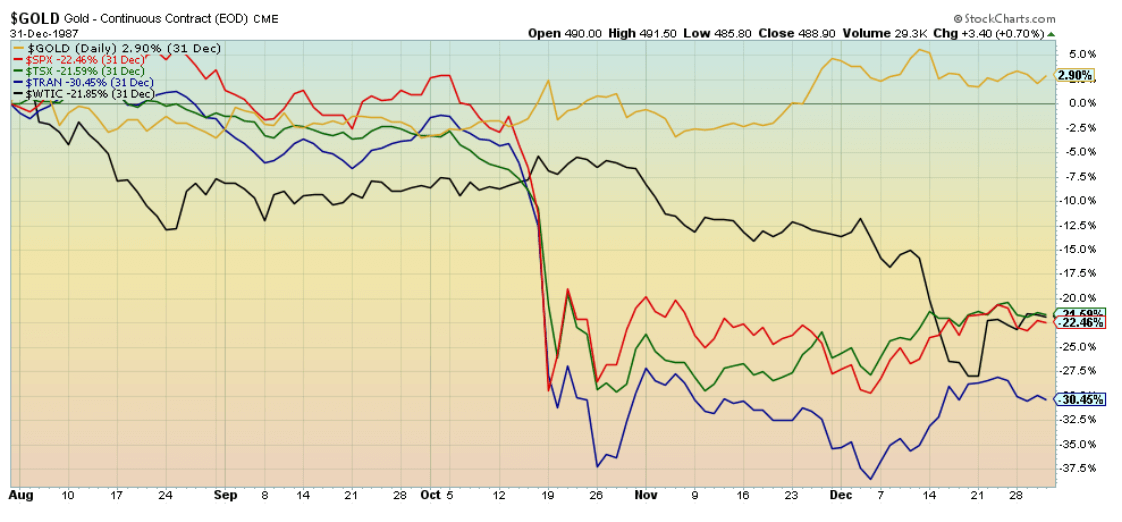
Gold was the only positive performer from the market peak in August 1987 to the end of the year.
© David Chapman
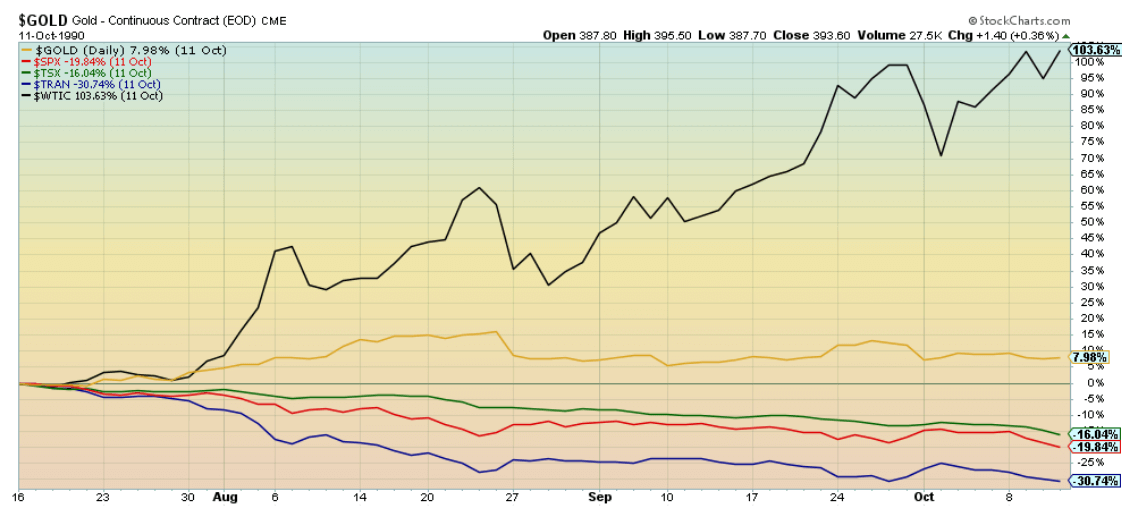
Oil prices were rising sharply following the U.S. invasion of Kuwait/Iraq during Gulf War I. Otherwise gold’s 8 percent return during the period July 1990 to October 1990 easily surpassed the decline in the S&P 500, the DJT and the TSX.
© David Chapman
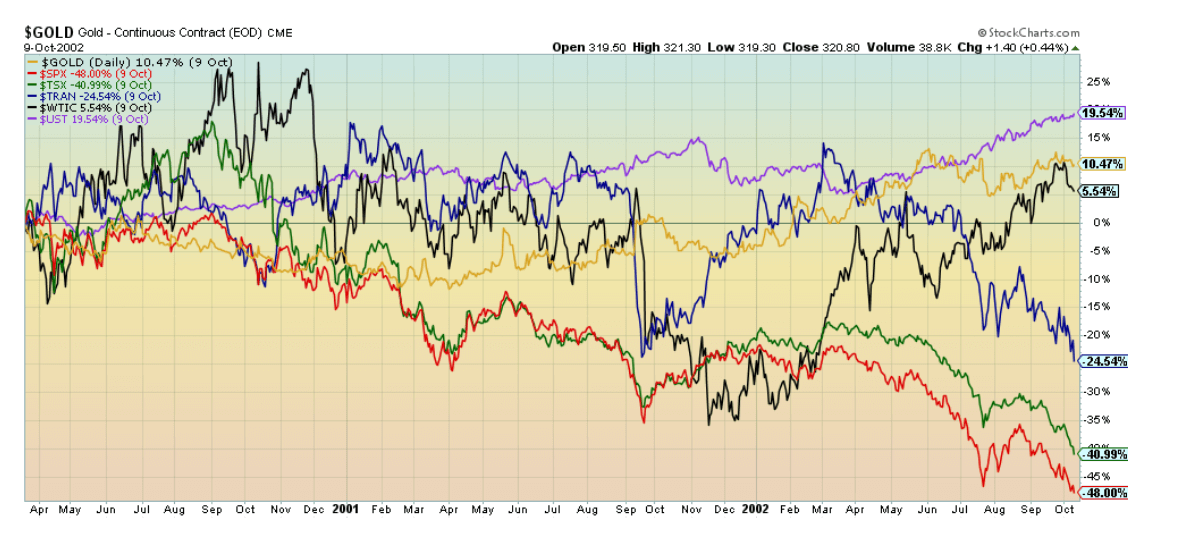
The high tech/dot.com bust of 2000-2002 saw markets drop sharply with the S&P 500 losing 48 percent during that period. But gold was up 10.5 percent and there was a flight to safety as the 10-year U.S. Treasury note rose 19.5 percent. Oil was also up but the all of the stock indices fell during that period.
© David Chapman
The 2007-2009 financial crash took stock markets down sharply with the S&P 500 down an astounding 56.3 percent from October 2007 to the bottom in March 2009. But gold shone rising 20.4 percent and once again there was a flight to safety in bonds as the 10-year U.S. Treasury note rose 13.8 percent.
Gold is negatively correlated with stocks and also with bonds but the negative correlation with stocks is stronger. Gold and stocks can go up together as gold rose sharply from the bottom of the bear in March 2009 to a peak in September 2011 but after that gold has been on the outs while the stock indices kept on rising. Gold is up over 30 percent since March 2009 but it can’t compare to the rise in the S&P 500 of 300 percent. Since the beginning of the century, however, gold is up 321% while the S&P 500 is only up 88%. Quite a difference.
Symbols on the charts are as follows:
$Gold – gold
$SPX – S&P 500
$TSX – TSX Composite
$TRAN – Dow Jones Transportations (DJT)
$WTIC – WTI Oil
$UST – CME CBOT 10-year U.S. Treasury note (price)
—
DISCLAIMER: David Chapman is not a registered advisory service and is not an exempt market dealer (EMD) nor a licensed financial advisor. We do not and cannot give individualized market advice. David Chapman has worked in the financial industry for over 40 years including large financial corporations, banks, and investment dealers. The information in this newsletter is intended only for informational and educational purposes. It should not be considered a solicitation of an offer or sale of any security. The reader assumes all risk when trading in securities and David Chapman advises consulting a licensed professional financial advisor before proceeding with any trade or idea presented in this newsletter. We share our ideas and opinions for informational and educational purposes only and expect the reader to perform due diligence before considering a position in any security. That includes consulting with your own licensed professional financial advisor.


XRP Under Pressure Amid Macro Forces, Fed Policy, and Regulatory Shifts
XRP remains under pressure despite easing geopolitical tensions, as macroeconomic factors and Fed policy dominate market sentiment. Liquidations and high...


Edison Accelerates Renewable Growth and ESG Impact in 2025
Edison reports strong 2025 sustainability progress, boosting renewable investments by 90% to reach 2.3 GW toward a 4 GW 2030...


New Gene Therapies Transform Rare Disease Care, but Gaps Remain
Gene therapies are transforming rare disease treatment, enabling normal lives for some patients. However, only about 6% of 7,000 rare...


Temotiva Launches Crowdfunding Campaign to Advance Preventive Mental Health
Temotiva Innovación Lab has launched a crowdfunding campaign through Santander X Explorer, marking a new phase for the University of...


Fed Policy Shift Raises Concerns Over Debt and Inflation Risks
The Federal Reserve is criticized for resuming balance sheet expansion through Treasury purchases despite expectations of tighter policy under new...
 |
|
 |  |
 |
|
-

 Markets6 days ago
Corn Prices Slip Amid Strong Crop Conditions and Favorable Weather
-

 Biotech2 weeks ago
TG Therapeutics Advances Subcutaneous Briumvi With Strong Trial Results and Rising Sales Momentum
-

 Cannabis4 days ago
WNBA Removes Cannabis From Banned Substances List in New CBA
-

 Fintech2 weeks ago
Temenos to Acquire Additiv to Boost AI Wealth Management
You must be logged in to post a comment Login