Featured
On the stock market’s latest corrections and policymakers
The stock market was corrected at over 10 percent then closed back at 5 percent. This change was last seen during the Great Depression.

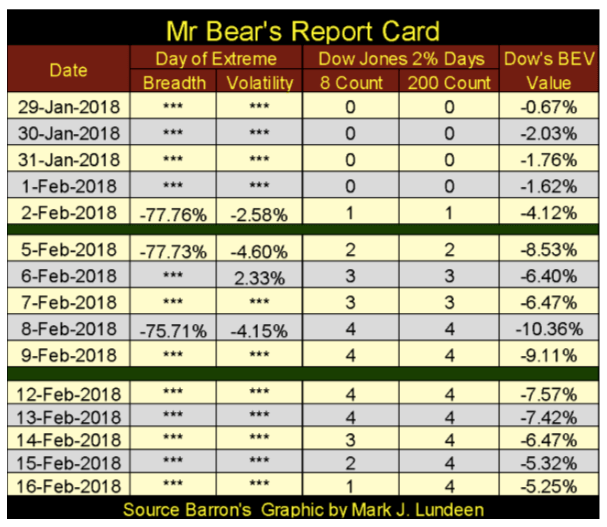
Here’s something we don’t see every day — the Dow Jones correcting over 10 percent in just nine trading days (Jan. 26 to Feb. 8), then snapping back 5 percent in the next five. And the violence of the 10 percent decline, seen in Mr. Bear’s report card below is remarkable. From Feb. 2-8, the NYSE saw seven extreme market events out of a possible 10; three NYSE 70 percent A-D Days and four Dow Jones 2 percent days. A five-day bear-market feeding frenzy like this has happened only during the Depressing 1930s or in the Sub-Prime Mortgage bear market.
But it’s been a week now, so I guess it’s all over and we’re back to normal.
Actually, all this is very weird and demands comment on. Especially as the beginning of the correction happened when President Trump declassified the House Intelligence Committee’s memo on the FBI’s illegal wiretapping of Donald Trump’s electronic communications that everyone in the mainstream media claimed for over a year and a half never happened. But now that the FBI and their minions in the media can no longer deny it, they now claim the public acknowledgment of this now long-denied truth would damage national security.
This too is weird: seeing Friday, Feb. 2 down by 666 points (the Mark of the Beast) seemed to be someone sending someone else a personal message; Wall Street to Trump — we can hurt you so back off.
I doubt Trump will, as by now he must be aware of the videos on former Congressional Representative (current prison inmate) Wiener’s laptop the NYPD Vice Squad seized last year. I don’t know if Trump understands his struggles in office as one with The Devil himself. But if what’s been said around the internet ultimately proves true, including the Q downloads, after seeing who and what these people do to children in Wiener’s videos, our President knows he is waging war with devils.
It’s a hell of a world where someone like me writing weekly market comments feels obliged to include those above to explain a simple little 10 percent market correction. But it’s the world we live and invest in. Nuff said.
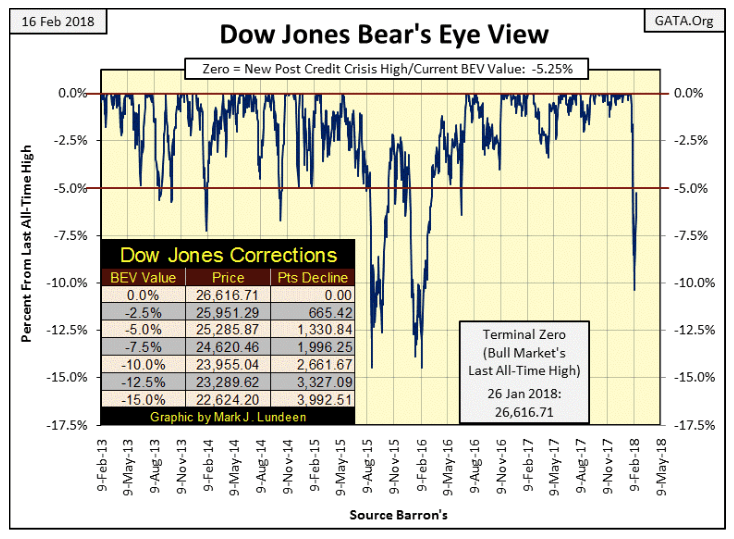
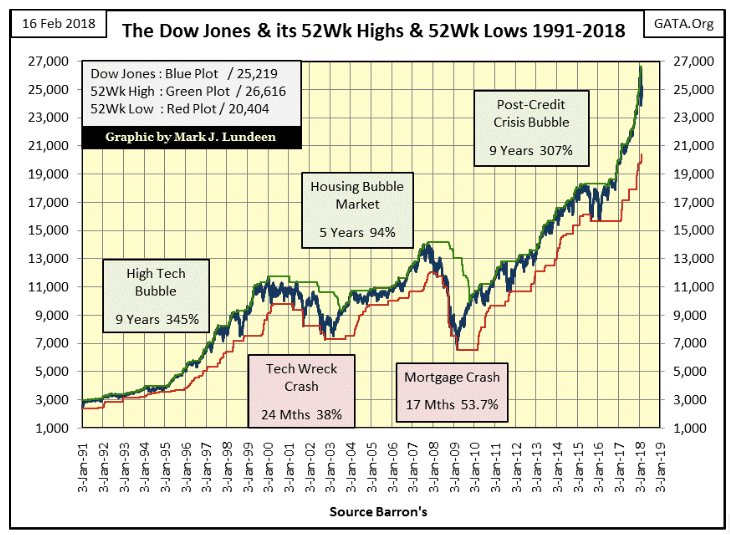
Here’s the Dow Jones plotted with its 52Wk High and Low lines. The 10 percent correction can hardly be seen in the chart below, and a week later the bulls took back half of their losses. Makes one wonder why the stock market went down in the first place. I wouldn’t be shocked seeing the Dow Jones making new all-time highs again by early March.
The top 20 in the Dow Jones Total Market Group (DJTMG) closed the week at 51. That’s what I like about this indicator; its superb ability to ignore transient moves in the market. When the top 20 moves up, down and especially changes its direction, something big is going on. As I read it at week’s close, nothing fundamental has changed in the stock market. So I’m expecting the market to resume its advance in the weeks to come, and will until the top 20 turns down in earnest.
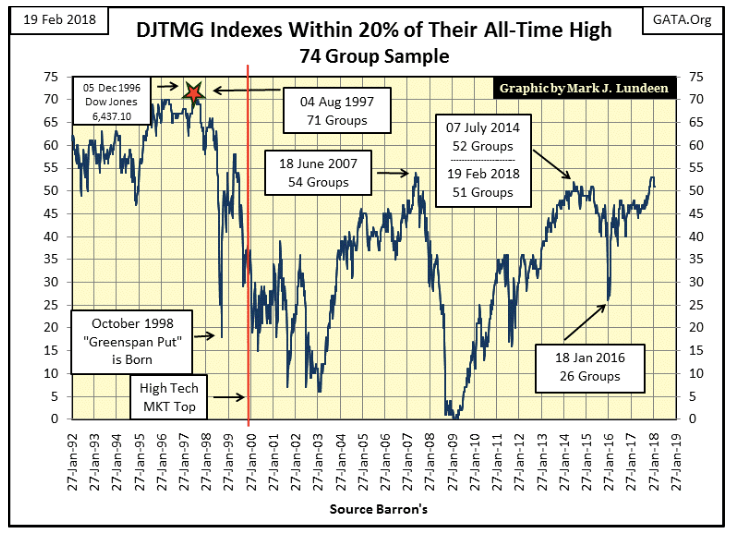 That’s not to say the stock market’s latest 10 percent correction didn’t affect the DJTMG’s top 20; it did as seen in the frequency table below. Barron’s Jan. 29 issue saw the Dow Jones’ last all-time high, as seen in the distribution of the groups in the top 20 (BEV-Zero to the -15 percent columns). In the following two weeks, the migration toward the right (deflating prices in the groups) is very evident but took the top 20 down by only one group. And this week’s recovery (Barron’s February 19th issue) is also notable in the table but left the top 20 at 51.
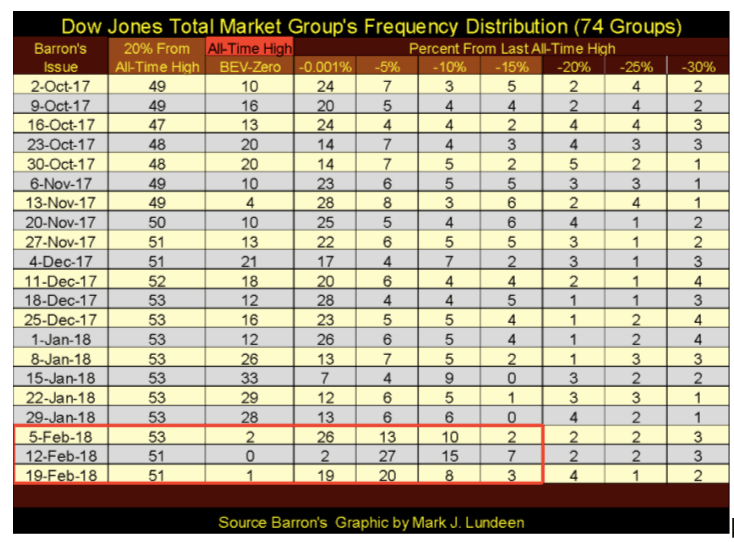
Well-established market trends, such as the post-November 2016 election advance, continue on until they no longer do. Seeing the many groups above once again migrate toward the left (inflating market prices) in the past week strongly suggest that this is still a stock market that wants to go up. So I’m still short-term bullish on the market but remain a long-term grizzly bear.
This is not the time to fall in love with the stock market. Wait until you see only zeros in the table above before you even consider doing so. When will that happen? At the bottom of the next bear market. In Barron’s Mar. 9, 2009 issue, the bottom of the credit-crisis bear market, this row in the table was all zeros down to the -25 percent column, with only 5 in the -30 percent column. I expect the next bottom will prove to be even deeper.
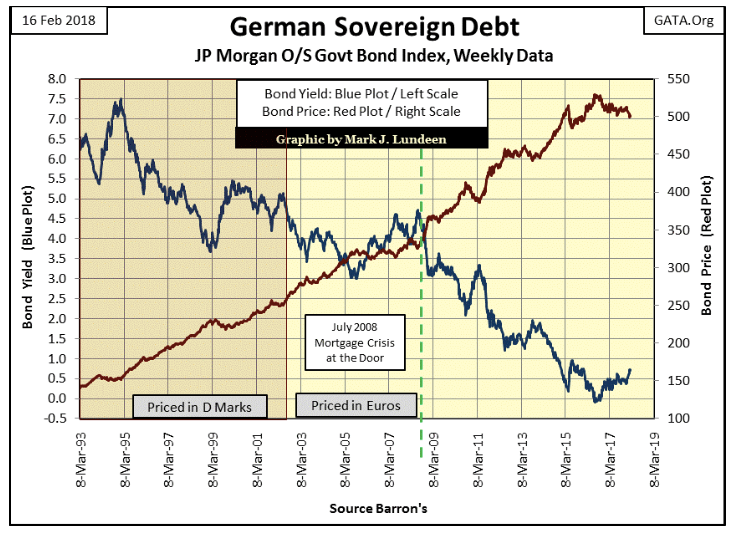
What do German Sovereign Bonds have in common with US Treasury Bonds? Yields for both bottomed in the summer of 2016 and have been rising since. There is another common link between these markets; both markets saw their bond yields collapse in the wake of the sub-prime mortgage crisis.
Well, why not? The Japanese Sovereign bond’s yield fell on the news of the Fukushima nuclear reactor meltdown. Never doubt “policymaking” is a global collaboration, and all central bankers are connected together at their balance sheets.
Now on to gold’s BEV chart. Market action in the gold market is like watching paint dry, but that’s much better than what we had to watch from August 2011 to December 2015 below. Currently, gold is in an uptrend that’s now into its third year, and that sounds and looks darn good to me.
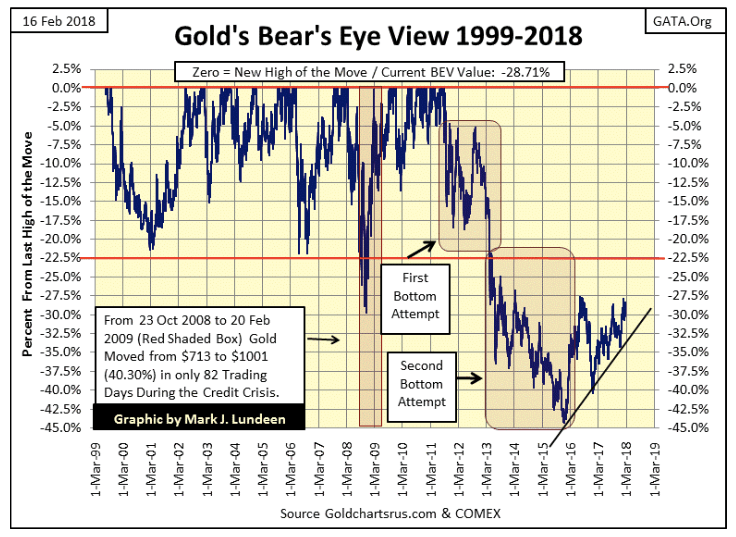
Missing are the exciting upward thrusts in the price of gold everyone has been waiting years for. Me too! But we can only take what the market gives us, and I’m happy the bad old days of deflating gold prices are now over. For myself, I follow gold, but what I’m really watching closely are bond yields and that DJTMG top 20 frequency table above. I don’t expect much excitement in the old monetary metals until the financial markets begin to deflate.
It’s not just me thinking this. Here’s a 26-minute video by SGT Report interviewing Lynette Zang.
Some of the details Lynette points out are shocking even to me! How have the “policymakers” kept this stinking pile of crap together for as long as they have? And now they have to worry about Trump doing a proper audit of the Federal Reserve? Trump could take this criminal empire down with just some tweets from his Twitter account if they fight this audit.
One day we are all going to wake up in a world that didn’t exist the day before. It won’t be a pleasant change of pace when the banking system finally implodes and Wall Street becomes overwhelmed by tsunamis of deflation slamming into the big banks’ putrid balance sheets. But it’s an ill wind that blows no good, and that day will be glorious for the price of gold and silver.
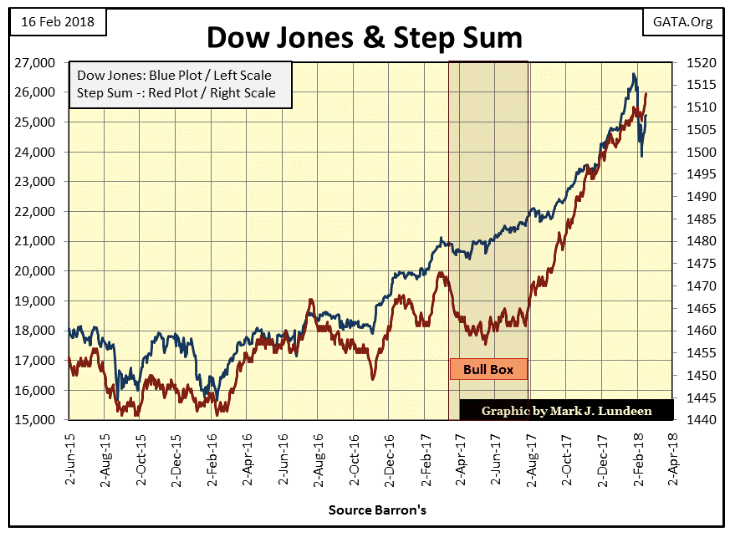
And for the past two years, gold has been trading differently. The big banks’ latest assault on the gold bulls (big collapse in COMEX open interest) wasn’t too successful. This week, the price of gold has snapped back nicely; that plus the bad guys failed to generate many declining days in the gold market during their assault, as seen in the rising step sum below.
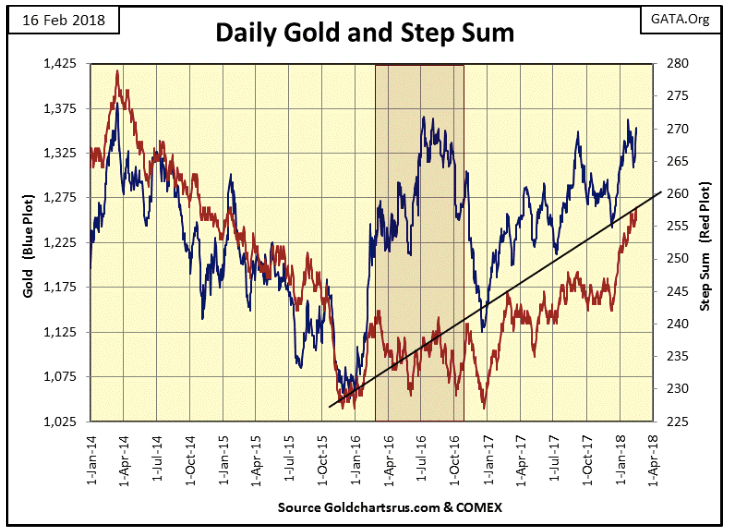
Much the same can be said for the Dow Jones below. After the nine-day, 10 percent tumble in valuation, once again the Dow Jones and its step sum are advancing briskly upward, and that precisely explains my view on the stock market in the coming weeks.
But no; I want no part of this. In my opinion, gold and silver will prove to be superior assets to hold for years to come.
Gold has been advancing in the step sum table below and is seeing more advancing days than declining. I admit this is nothing exciting but progress nonetheless.
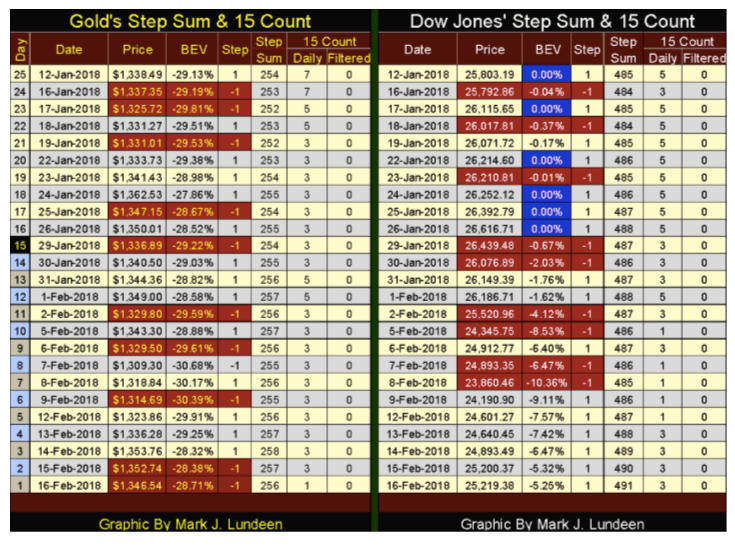
The latest 10 percent decline in the Dow Jones can be studied in detail in its step sum table above. A nine-day, 10 percent flash crash from Jan. 29 to Feb. 8, which afterward the Dow Jones saw six consecutive advancing days which clawed back 5 percent of Mr. Bears’ 10 percent decline. I know he doesn’t like that. If we see some more Blue BEV Zeros returning to the table in the next two weeks, he won’t like that either.
Keep in mind that since November 2016’s election, there have been 99 new all-time highs (BEV Zeros) in the Dow Jones, and that’s a lot in a 14-month period. But there were times in 2017 when the Dow Jones didn’t see a BEV Zero for weeks on end, so I’m not so quick to call it quits on the current advance in the stock market just yet.
The banking system isn’t your friend. I’m not talking about the people you do business with at a bank. They’re nice people who want only to help their clients as they’ve been trained to do, and hopefully, make a good living for themselves by doing so. It’s the people at the top, the dictators of “policy” who have taken great liberty with the banking system I’m talking about. Their predations on the global economy during the 20th century were huge and hugely unrecognized.
Here are three reasons I really don’t like the “policymakers” and their banking system.
1. The “policymakers” have inverted the risk profiles for the stock and bond markets.
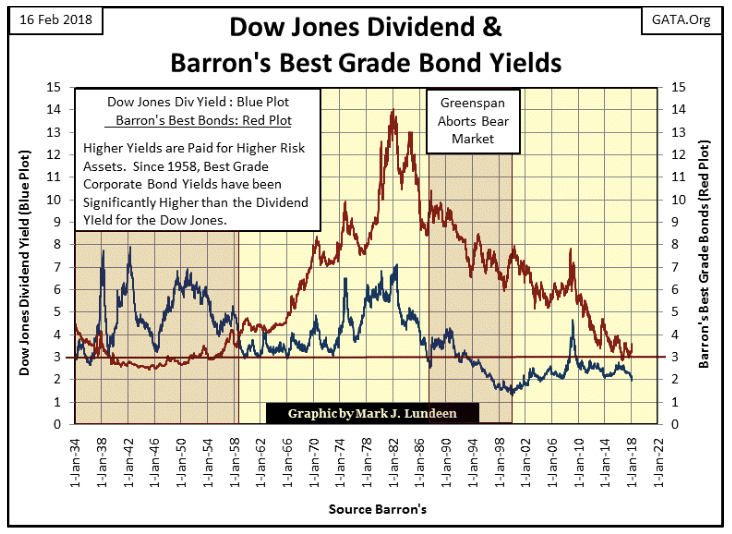
Bonds were once a safe harbor for widows and orphans, but that was long ago. Below is a chart plotting the Dow Jones Dividend and Barron’s Best Grade Bond Yields. It was once recognized the stock market was a riskier place for money than the bond market, and this fact provided a useful timing mechanism for calculating profitable entry and exit points in the stock market.
The key to understanding this is knowing a higher rate of return also presents higher risks to the income stream from an investment as well as to the principle involved. Bonds being a contract for debt were inherently safer than stocks; an ownership position that offered a slice of a corporation’s profits (dividend payouts). In bad years, companies would cut their dividend payouts, making income from stocks a higher risk than the fixed income from bonds. Even during the Great Depression, price volatility found in the stock market was largely absent in the bond market for solid credits (Best Bonds) such as Standard Oil, General Electric and AT&T.
Look at the Dow Jones’ dividend (Blue Plot below) and Barron’s Best Grade bond yields (Red Plot) from 1934 to 1958. As a rule, dividend yields were higher than Best Grade Bonds, as the markets priced these financial assets for the risks they presented invested funds.
However, markets aren’t perfect and sometimes misprice market risk, as when dividend yields approached bond yields below. Importantly, those times also proved to be bull-market tops in the Dow Jones. Seasoned investors from decades ago understood that near equality between yields for stocks and bonds signaled the stock market wasn’t compensating them for its risks, so they’d sell their dividend-paying stocks and purchase best-grade bonds yielding approximately the same.
As seen above, from 1934 to 1958, such a tactic preserved capital and income as the stock market entered a bear market, as seen by the rise in the Dow Jones dividend yields. When the Dow Jones once again yielded something over 6 percent, seasoned investors would shift their funds from Best Bonds, still yielding around 3 percent, into dividend-paying blue-chip stocks now yielding over 6 percent. Not only did this return investors’ invested funds back into the stock market near the bottom of a bear market, it also doubled their income as they did so. If I had this data going back to the 1860s, I suspect we’d see how the rich got richer from the Civil War to World War II.
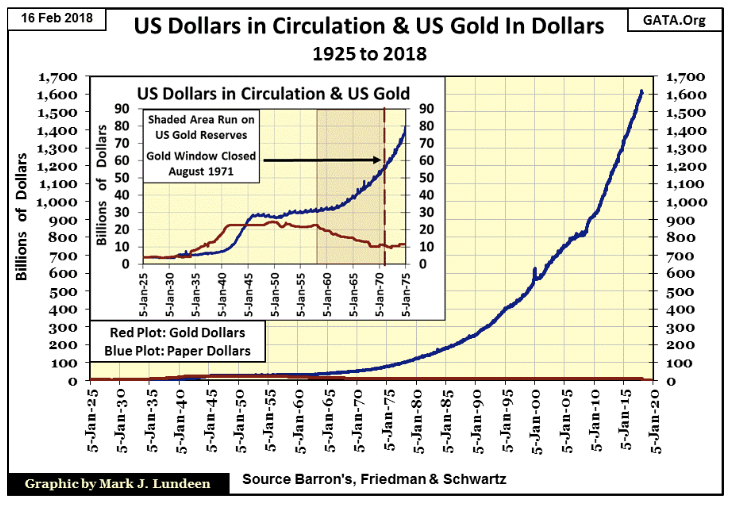
Unfortunately, timing the stock market by dividend and bond yields, like the $35 gold peg, couldn’t survive the inflationary assault on the financial markets as seen in the blue plot below. Beginning in 1958, the flood of paper dollars flowing from the Federal Reserve / US Treasury resulted in a run on the US gold reserves that continued until August 1971. The impact of this monetary inflation on the bond market was that since 1958, Best-Bond Yields have never been lower than the dividend yield for the Dow Jones. The reason for this is simple: Best Grade Bonds, with their fixed-income payouts, became a higher risk to invested funds than blue-chip stocks.
The fixed-income market (bonds) became a killing field for private wealth because of the monetary inflation seen above. The rise in bond yields from 1958 to 1981 devastated individuals, academic endowments, and private pension funds. As bond yields are currently so close to dividend yield for the Dow Jones, my personal opinion is that bonds are critically mispriced for the latent risks they currently have. And selling bonds to purchase blue-chip stocks, currently yielding a pathetic 2.09 percent, won’t solve the problem as the risks inherent in the stock market have only increased with the rising Dow Jones.
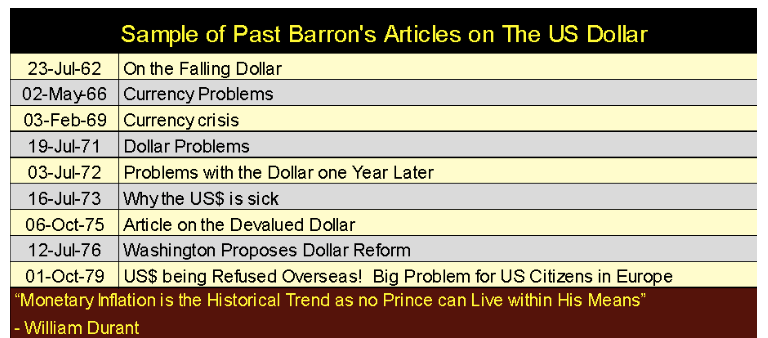
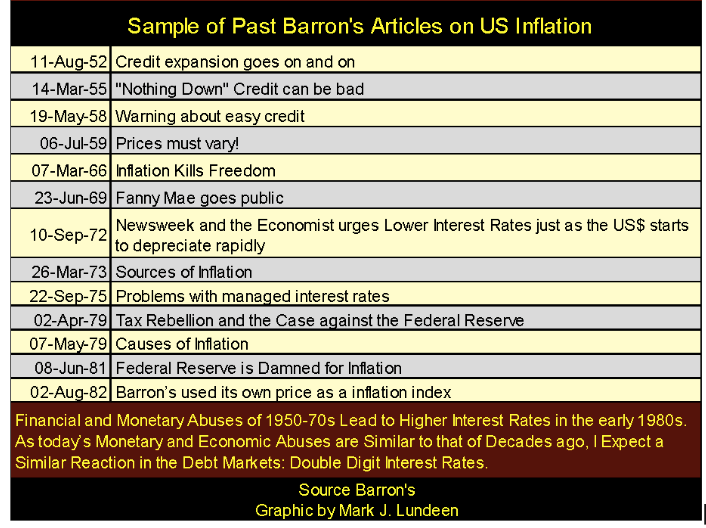
Below is a small sample of past articles published in Barron’s back when the financial media remembered a dollar that really was as good as gold, and understood monetary inflation as a noxious substance to prosperity. Dates on the table are Barron’s issue dates. So why does Wall Street and Washington continue inflating the money supply? Because it’s good for them. If it’s also bad for us, well whose complaining, so what of it?
2. The “policymakers”’ reckless-market machinations introduced risks into the market place which were unknown when the dollar was as good as gold.
And exactly what risks are those? They’re all to be found trading daily in the financial-futures markets and reported hourly on CNBC. Before August 1971, the only risks hedged in the futures market were agricultural. Risks of whether or not it rained on Iowa’s corn or Nebraska’s wheat have been hedged in Chicago’s Board of Trade since 1848. The prospects of a hoof and mouth plague in Wyoming’s cattle could be hedged at the Chicago Mercantile Exchange since 1919.
But when gold was money, as before August 1971, when its price was fixed by law at $35 an ounce, there was no gold contract trading at the COMEX; that came later in 1974. As did trading foreign exchange rates at the Chicago Mercantile Exchange, a year later in 1972 to be precise. This is also true for futures contracts trading stock indexes and T-Bonds.
I’m not complaining these risks can now be hedged, at great profit to the banking system that introduced them. No, my grievances are that after only a few decades of post-WWII “monetary policy” implemented by the FOMC (see CinC growth in chart above) it became necessary for these risks to be hedged.
“How can businessmen coordinate the private sector of the economy effectively when the most important measuring-rod of all; the monetary unit has been left with no reliable defined value? Units of length, volume, and weight have been universally defined with meticulous care; but dollars, lire, francs and pounds have been allowed to change in every significant attribute over time.” — Professor W.H. Hutt: New Individualist Review, 1966 Winter Issue
“Extravagances and absurdities like floating exchange rates [the Foreign Exchange Market] and Special Drawing Rights [IMF’s SDR] come and go. Gold endures.” — Robert M Bleiberg: Barron’s Managing Editor, 29 January 1979
3). The “policymakers” have done much damage in the residential mortgage market.
Before the creation of the Federal Reserve in 1913, banks didn’t do residential mortgages. Until FDR created Fannie Mae and the Savings & Loan industry that targeted the residential mortgage market in his New Deal; unless someone had a rich uncle no one else did either. Yet in the core of America’s large and small cities, there are many beautiful homes built before 1913. According to county records, my home was built in 1910 for $500, and now in 2018, it has appreciated to $125,000 with taxes owed this year three times my home’s original construction price.
Housing is such a popular issue with voters. Its small wonder Washington’s politicians have been digging their meat hooks into the mortgage market for many decades.
“The Housing Act of 1954 will turn out to be one of the worst pieces of inflationary legislation ever placed on the statute-books. For the first time, non- veterans will be able to buy a $10,000 house with a down payment of $500, the Federal Housing Administration insuring a 30-year mortgage of $9,500 on such a house. This is a triumph of the Nation’s Home Builder’s Association and a defeat of commonsense. Unfortunately, there is no reason to hope that mortgage money lenders will resist the practical consequences of this legislative monstrosity. Throughout the’ first half of’ 1954, most of them have been eager to make VA mortgage loans to home-buyers at no down payment at all.” — Barron’s The World at Work, 05 July 1954, Page 7
I was curious to see what a 30 Yr. $10,000 mortgage from 1954 would look like, so I made the table below. Where did I get the 3 percent rate from? My parents purchased their home for $13,000 around this time and I remember my father saying his mortgage rate was actually less than 3 percent. But using 3 percent seemed the thing to do.
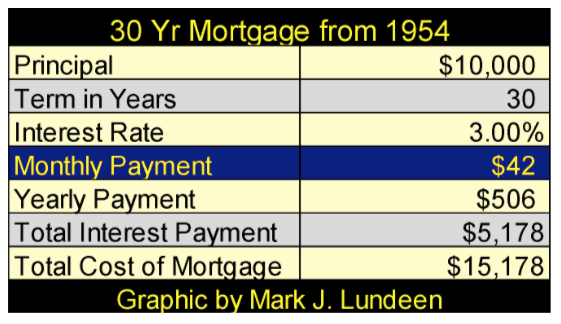
But the big question is: where did the 30-year term come from? I suspect it’s because the banking system sees it in their favor to have “homeowners” making monthly payments on the banks’ collateral for 30 years instead of only 15.
I made the table below listing the particulars for a $300,000 mortgage at 5% for 15, 20- and 30-year terms to point out some interesting details in a mortgage. But first, why a 30-year mortgage? Most likely due to the mortgage industry concerns that its debtors won’t live long enough to service a 40-year mortgage.
Next, why not a 15- or 20-year mortgage? Because people are basically sheep; it never occurs to them to do some basic research on a financial obligation that will weigh them down for the next few decades. And the benefits from a homeowner choosing a 20-year term over a 30 on a mortgage are huge.
For example look at the monthly-payment differential between the 20- and 30-year mortgage below: $370 a month. With the 30-year mortgage, after 30 years they’ve made $579,766 in payments to the bank with no cash reserves left for the rapidly aging homeowner.
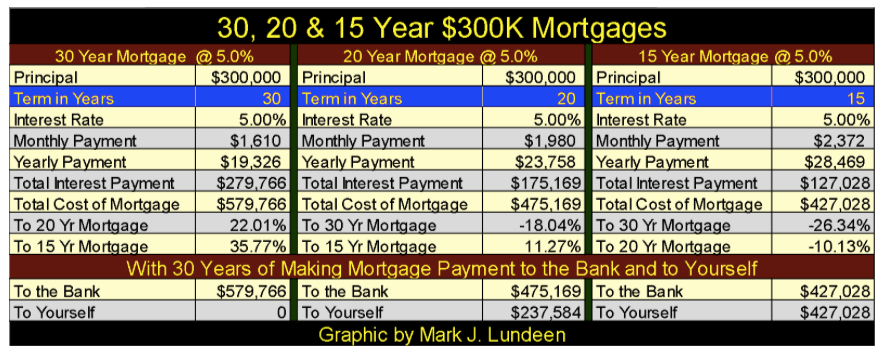
But what if the homeowner chose to make an additional $370 a month in their mortgage payments. In 20 years (and $475,169 in total payment), their obligations to the banks would be terminated. And if they wisely chose to continue to make this $1,980 monthly payment to themselves for the next 10 years, after 30 years they’d be sitting in a nice house that they could call their own * PLUS * having $237,584 in cash someone else would be paying interest on – to them. Choosing a 15-year term mortgage is even better, assuming the homeowner opted to continue making his monthly payments to themselves for the next 15 years.
Let’s face it; mortgages are typically a 30-year term as those 30 years are the best, and most productive of a homeowner’s life. Bankers at the level of dictating “policy”, you know the devils now wrestling with President Trump, want a nation of debtors spending those 30 years paying monthly payments to them!
I’ve been writing my market comments for almost a decade now, and for the most part I’ve kept to my charts and tables to make my comments on. But I really do believe the United States has fallen down to a point that past civilizations have also found themselves at.
The grasping Clinton-Political Machine rolled into Washington DC in 1993, and the political, judicial, academic and media classes had little problem with them as they had their way with anything they could get hold of. Donald Trump, in his efforts to abide by the rule-of-law has enraged these people, and I ask myself why?
Maybe Cicero, a 1st century BC Roman Senator offers us some insight into our current problems. Some things never change.
“A nation can survive its fools, and even the ambitious, but it cannot survive treason from within. An enemy at the gates is less formable, for he is known and carries his banner openly, but the traitor moves amongst those within the gate freely, his sly whispers rustling through all the alleys, heard in the very halls of government itself. For the traitor appears not as a traitor, he speaks in accents familiar to his victims, and he wears their face and garments, he appeals to the baseness that lies deep in the hearts of all men. He rots the soul of a nation, he works secretly and unknown in the night to undermine the pillars of the city, he infects the body politic so that it can no longer resist. A murderer is less to be feared.” — Marcus Tullius Cicero, 42BC
—
DISCLAIMER: This article expresses my own ideas and opinions. Any information I have shared are from sources that I believe to be reliable and accurate. I did not receive any financial compensation in writing this post. I encourage any reader to do their own diligent research first before making any investment decisions.


Bitcoin Stalls Near $60K as Strategy Moves, ETFs Outflow, and EU MiCA Rules Take Effect
Bitcoin hovers near $60,000 with ETF outflows, while Strategy boosts reserves, sells BTC, and raises dividends to reassure investors. Ethereum...


Cannabis Dominates Global Drug Use: Trends, Risks, and Shifting Markets
Cannabis remains the world’s most widely used illicit drug, with 256 million users in 2024, surpassing all others combined. Growth...


Italy Approves First Hydrogen-Powered Train for National Rail Network
ANSFISA has approved Italy’s first hydrogen-powered train, the Alstom HMU214, for use on the Brescia–Iseo–Edolo line. Capable of 140 km/h,...


Cotton Market Weakness Persists Despite Brief Rebound
Cotton prices fell to new lows last week before a modest rebound. USDA data shows crop conditions remain worse than...


Eli Lilly Hits $1 Trillion Valuation Amid Strong Bullish Momentum
Eli Lilly stock hit a record high, surpassing $1 trillion market value after strong product demand. Shares surged over 7%,...
 |
|
 |  |
 |
|
-

 Biotech7 days ago
Galicia Launches €805M Biotechnology Strategy to Drive Innovation and Competitiveness (2026–2030)
-

 Crypto2 weeks ago
Bitcoin and Ethereum Markets Steady as Strategy and Bitmine Expand Holdings Amid World Cup Crypto Activity
-

 Impact Investing5 days ago
ESG Gap Persists as Firms Struggle to Link Sustainability to Financial Value
-

 Crowdfunding2 weeks ago
Temotiva Launches Crowdfunding Campaign to Advance Preventive Mental Health
You must be logged in to post a comment Login