Featured
The stock market is certainly not too big for the Fed to handle
After the $1,264 billion dollars “injected” into the financial market since late March, the Dow Jones, as well as the other major-market indexes have yet to reflate back to new all-time highs. The 8-count for the Dow Jones closed the week at 3, its 200-count at 32. In a bull market, we’d see the 8-count at a zero for months and years, and the 200-count would rarely rise above a 5 or even a 2.

Here’s a blast from the past:
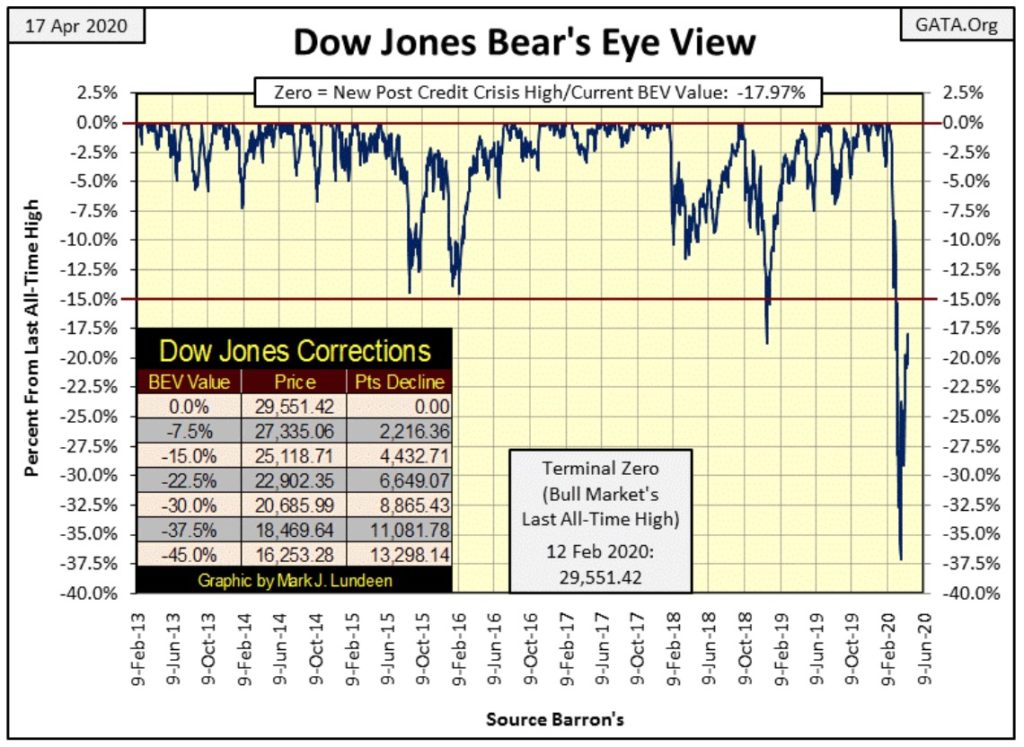
During a discussion of the October 1987’s Flash Crash; “stabilizing the market as a whole” sounded pretty good thirty-one years ago, as it does today. Considering the FOMC is now flooding the financial system with “liquidity” and how the Dow Jones in its BEV chart below has rebounded since its lows of late March, maybe Doctor Heller was on to something. But I’m still thinking dead-cat bounce; meaning after this advance is over the Dow Jones will resume its big-bear market decline.
“The Fed could support the stock market directly by buying market averages in the futures market, thus stabilizing the market as a whole. — The stock market is certainly not too big for the Fed to handle.”
Robert Heller, former Governor of the Federal Reserve, 1989 WSJ interview.
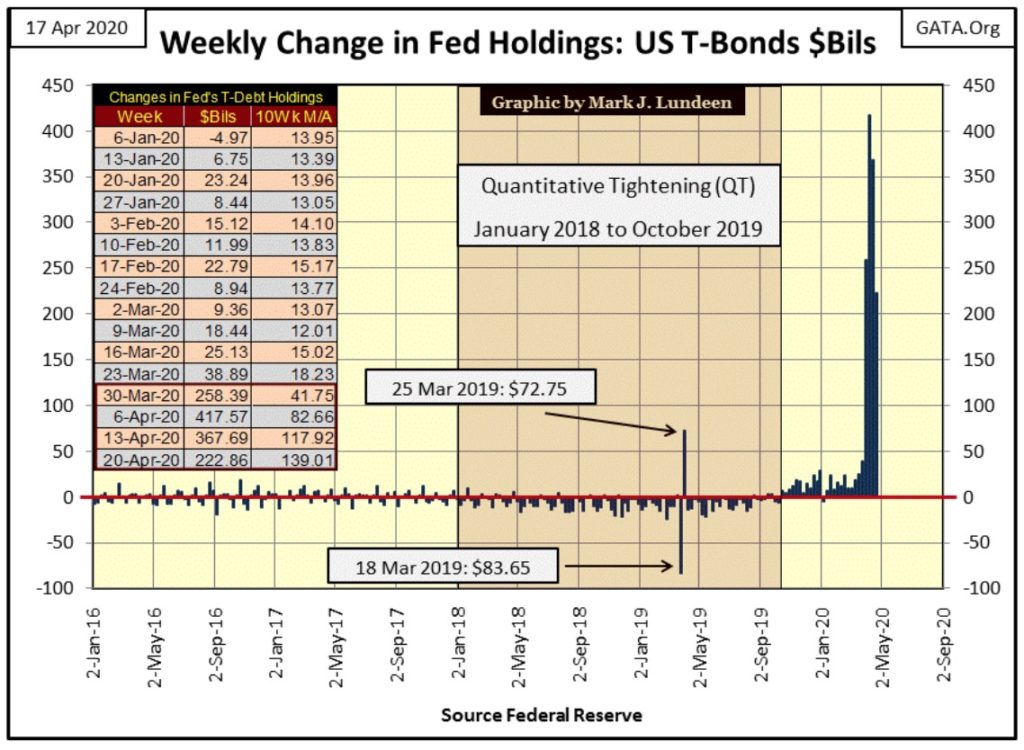
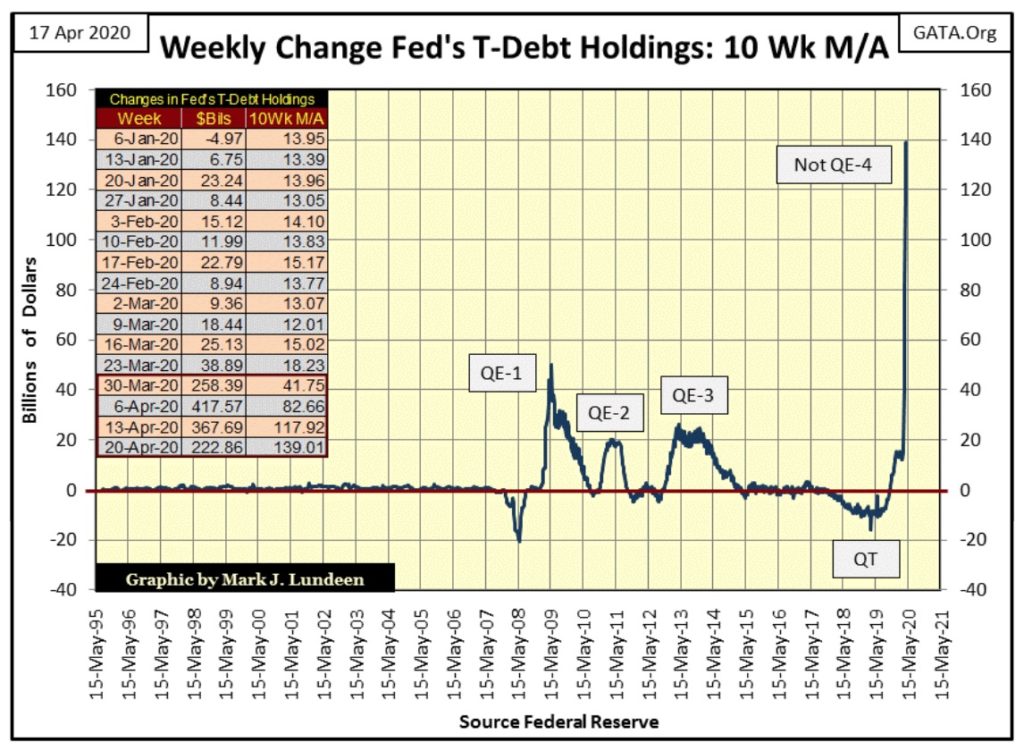
How much “liquidity” has the Federal Reserve’s Open Market Committee (FOMC) “injected” the financial system with? As seen in the chart below plotting the weekly changes in the Fed’s holdings of US Treasury Debt, they’ve expanded their holdings of T-debt by $1,264 billion dollars in just four weeks, or if you prefer $1.264 trillion dollars in only a month’s time.
I’m at a loss for words to describe what the “policy makers” have done below – apocalyptic maybe? One thing is for sure; whatever benefits the stock market is seeing now in April 2020, won’t outweigh the inevitable consequences we will all have to bear in the years to come.
To demonstrate how contrived the current dead-cat bounce is, the bottom of the BEV -37.09% decline seen above occurred on Monday March 23rd. It was exactly this week (March 23-27) when the FOMC began its historic bubble blowing operation seen below. So it’s no surprise the market has rebounded. If they continue “injecting liquidity” into the market on an industrial scale, we should expect seeing the Dow Jones at new all-time highs sometime soon.
But it won’t be a resumption of the old bull market; rather the commencement of a BS Market by the members of the FOMC. Ultimately this will end badly for everyone – but when is the question.
I want no part of this as we are looking at the murder the global-reserve currency and the global economy it supports; so I’m still recommending investing in gold and silver bullion and the miners of precious metals.
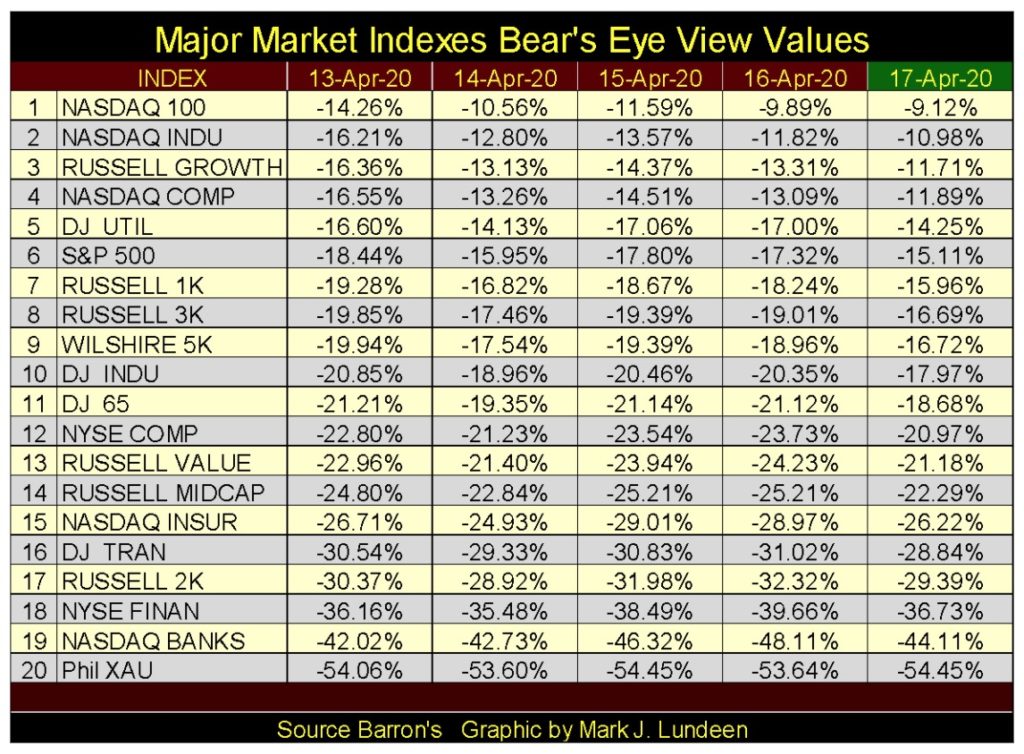
And after the $1,264 billion dollars “injected” into the financial market since late March, the Dow Jones, as well as the other major-market indexes I follow below have yet to reflate back to new all-time highs.
Think about that for a second; that’s actually an alarming thought, an indication of just how powerful the forces-of-deflation are beneath the surface of contemporary finance. How is shoveling trillions-of-dollars into the gravitational-black hole now developing beneath our financial markets going to solve the basic problem of grossly over inflated valuations?
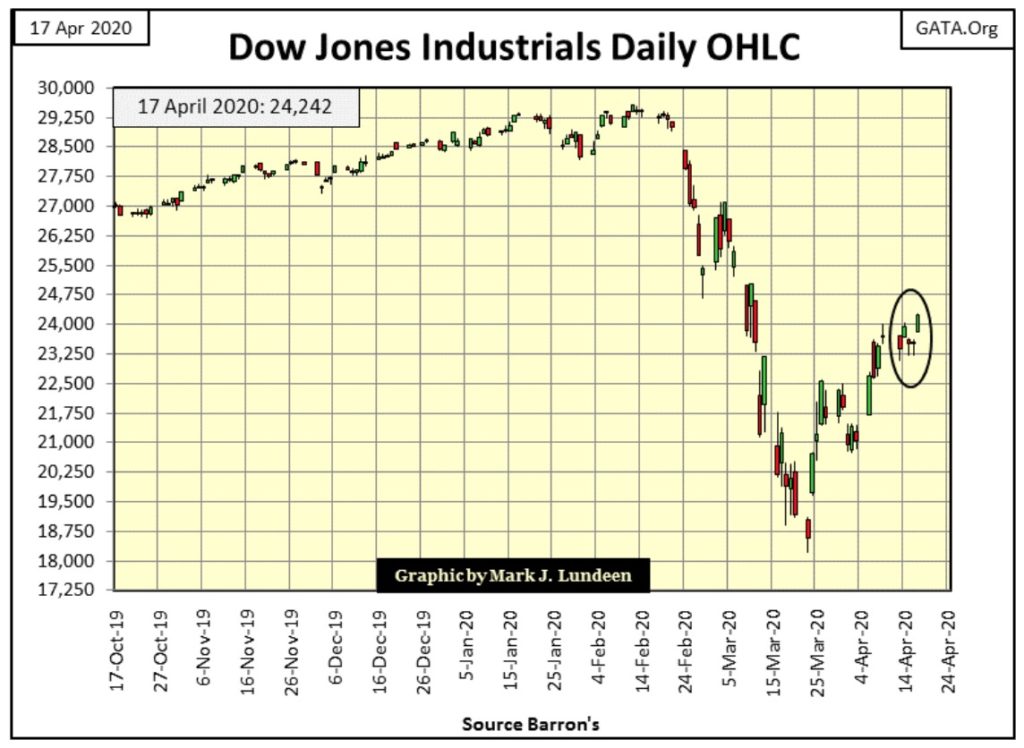
Next is the Dow Jones in daily bars, and if you can forget all I said above you’d notice daily volatility is decreasing. Even in a BS market, that’s a good thing promising further advances to come.
In week #8 of our bear market (Mr Bear’s Report Card below), we saw two days of extreme market volatility, two days the Dow Jones moved more than 2% from a previous day’s closing price. In bull markets we can go for months and sometimes for years without an extreme day of volatility (Dow Jones 2% Day), so in Wk #8 we’re still seeing Mr Bear doing his thing.
And in this table we see the FOMC doing its thing too. Note Monday March 23rd’s BEV of -37.09%, the bottom of this bear market so far. The next day the Dow Jones saw an 11.37% advance, as Thursday of the week (March 26th) ended a BIG +13.41 BEV points from its Monday’s lows. In Wk #5 of this bear market that’s what an “injection” of $258 billion from the Federal Reserve bought.
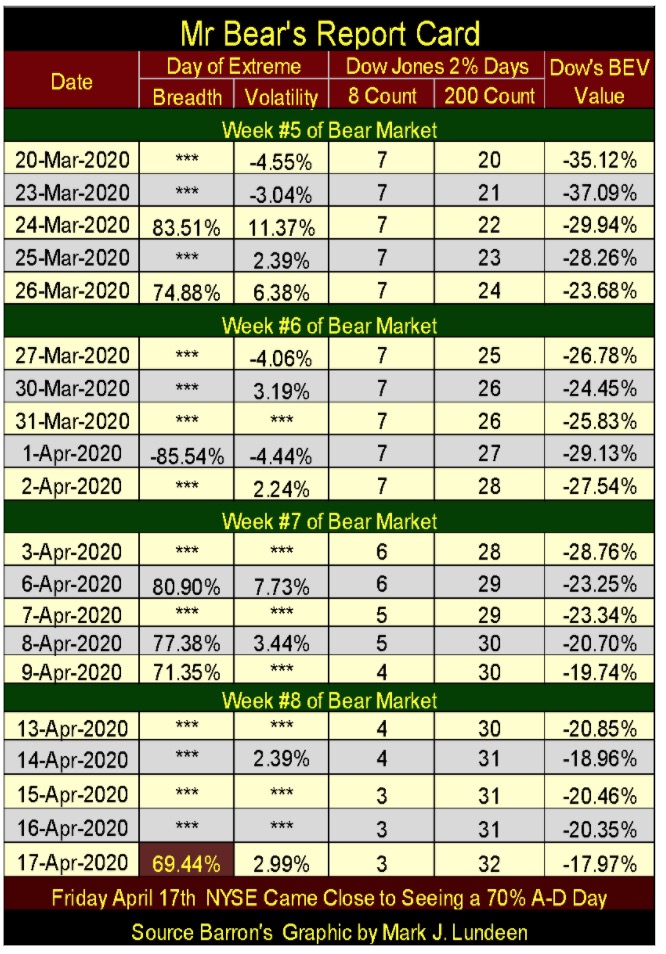
On Friday the NYSE’s market breadth was just short of a 70% A-D day, a day of extreme market breadth. That’s why I highlighted that 69.44% in red as it really wasn’t a 70% day, but it was so close I wanted to note it.
The 8-count for the Dow Jones closed the week at 3, its 200-count at 32. In a bull market we’d see the 8-count at a zero for months and years. For a 200-count during a bull market, it would rarely rise above a 5 or even a 2.
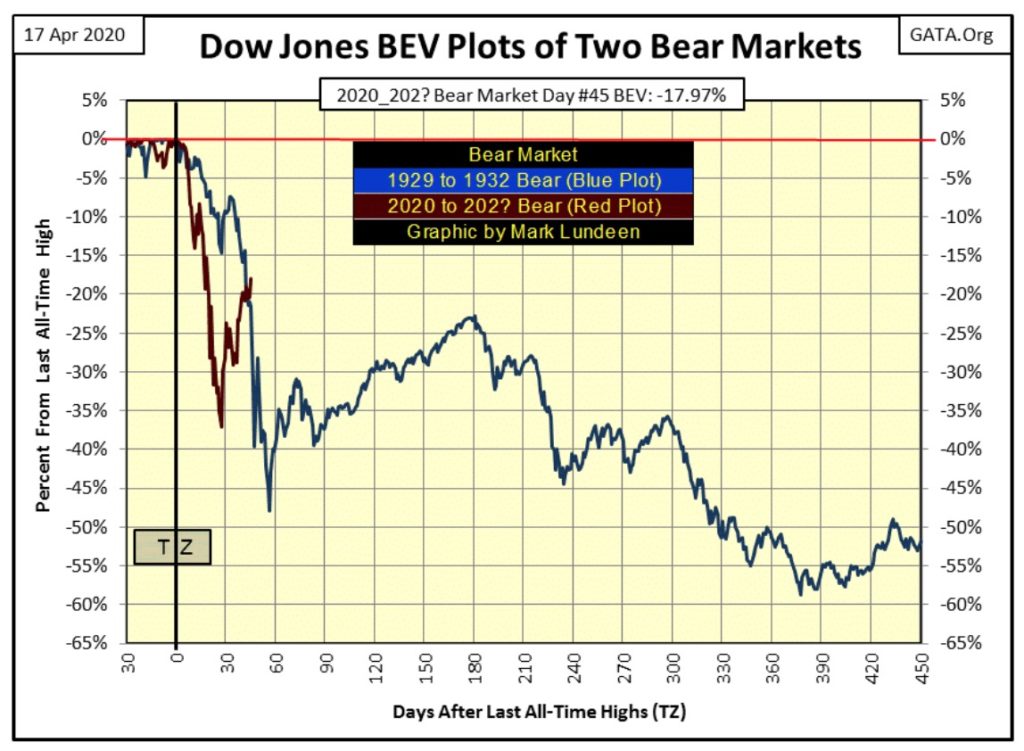
Here’s my Bear’s Eye View (BEV) comparison of the Great Depression Bear Market along with ours. The TZs (Terminal BEV Zeros) are the last all-time highs for these bull markets, and I have them aligned on day Zero, so day #1 is the first day of these bear markets.
This week closed at day #45 of our bear market, and since day #27’s BEV of -37.09% (March 23rd) we’ve seen a nice bounce in the Dow Jones.
For the 1929-32 market crash, day #45 (Saturday 26 Oct 1929) saw the Dow Jones first break below its BEV -20% line. On day #46 the Dow Jones will deflate 10% in a single day, and on day #47 (Black Tuesday) the Dow Jones will deflate an additional 9%.
This William Powell movie of the era captures the gestalt of the Black Tuesday’s market crash. Watch until 7.00 minutes into the movie for the crash. After that it’s an enjoyable 1930s murder mystery starring William Powell.

In a market where everyone wants to sell and no one is buying, the ruined leveraged speculators of a century ago will begin considering suicide only 48 NYSE Trading Days after the Dow Jones made its last all-time high on September 3rd 1929.
Maybe the reason we’ve not seen a similar situation develop in 2020 (or the 2008-09 market crash) is because the FOMC, using monetary inflation (three charts above), is buying stocks, bonds and mortgages at prices no one else in their right mind would be willing to pay.
I, like some of my readers during the week look to the Kitco site for spot gold and silver prices during the week, and this week found me shaking my fist at the computer’s monitor for what I saw happen to the price of gold.
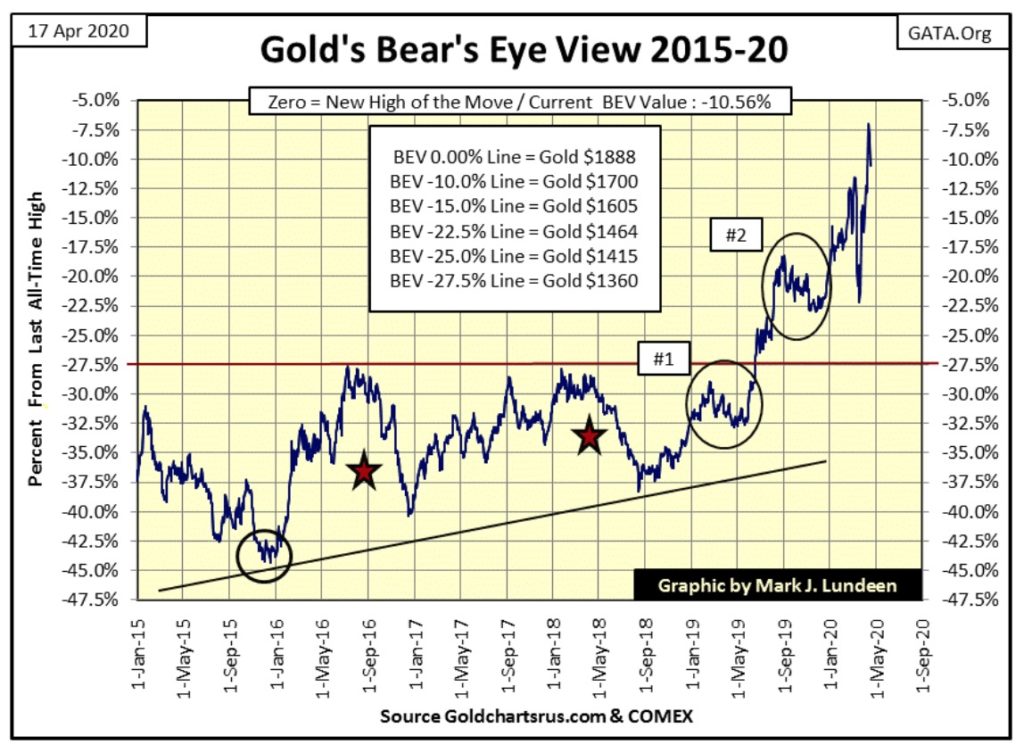
But looking at gold’s BEV data for the week (two charts below), it closed at single digit BEV values for the first time since September 2011, and finished the week with a -10.56% BEV, or up $10 from last Friday’s close.
Seeing how the FOMC is trashing their balance sheet in the chart below, this time with a 10 Wk M/A, I don’t understand why gold didn’t close the week over $3,000 and silver over $100 an ounce.
But just looking at gold’s BEV chart below as it is, the break out above gold’s BEV -27.5% red-line below that began last summer is still intact, and that is no small thing in our world today.
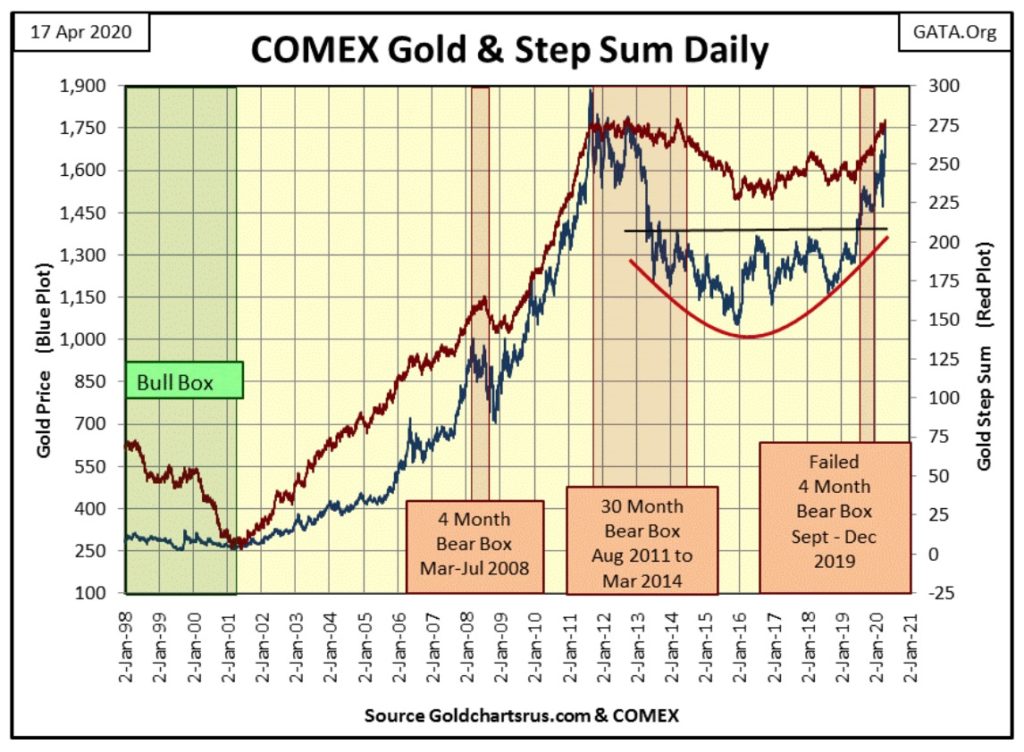
I simply love looking at gold’s step sum chart below.
We see the August 2011 to December 2015 45% market decline, which included a 30 month bear box where the bulls thought the market would turn around – but as is usual with a bear box – the bulls were wrong. From June 2014 to December 2015 the step sum was in a state of collapse as the demoralized bulls finally surrender to the bear market.
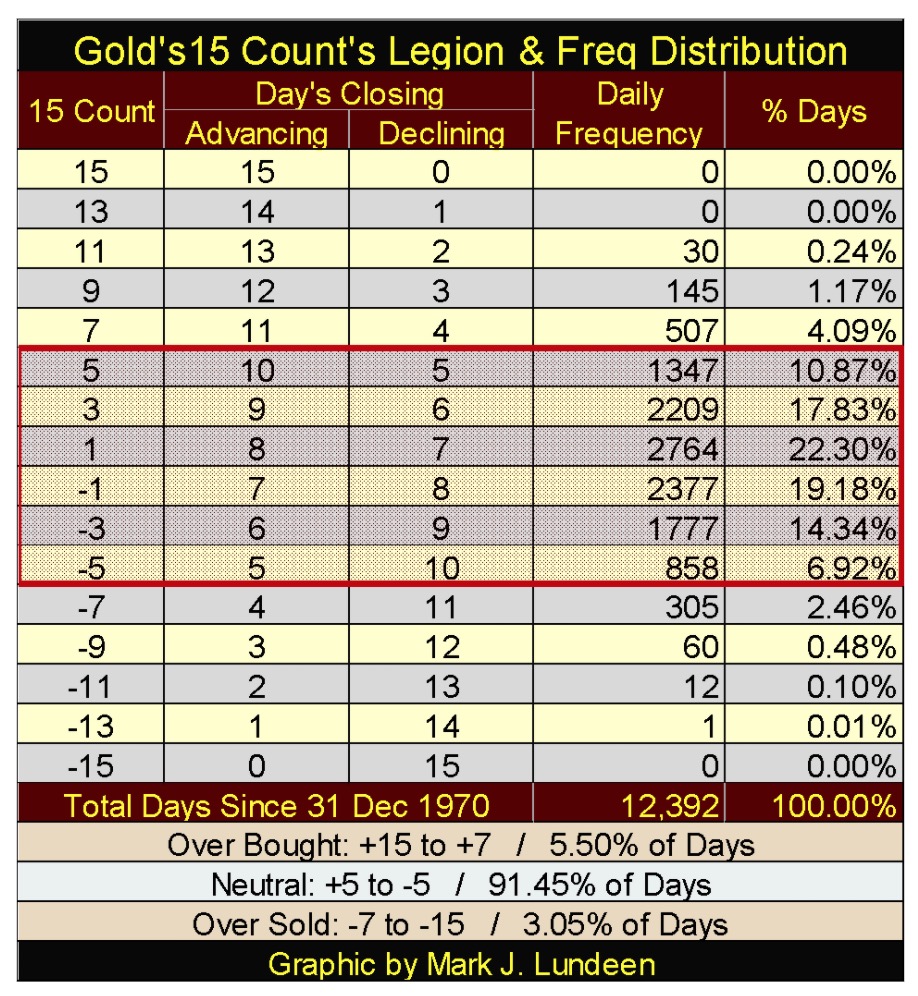
In November 2015 gold’s 15-count declined to a historic -13, or 14 down days in a 15 day sample. Looking at Gold’s 15-Count’s Legion and Freq Distribution table below, that -13 from November 2015 has happened only once since December 1970, making it a very noteworthy, and important extreme-market event.
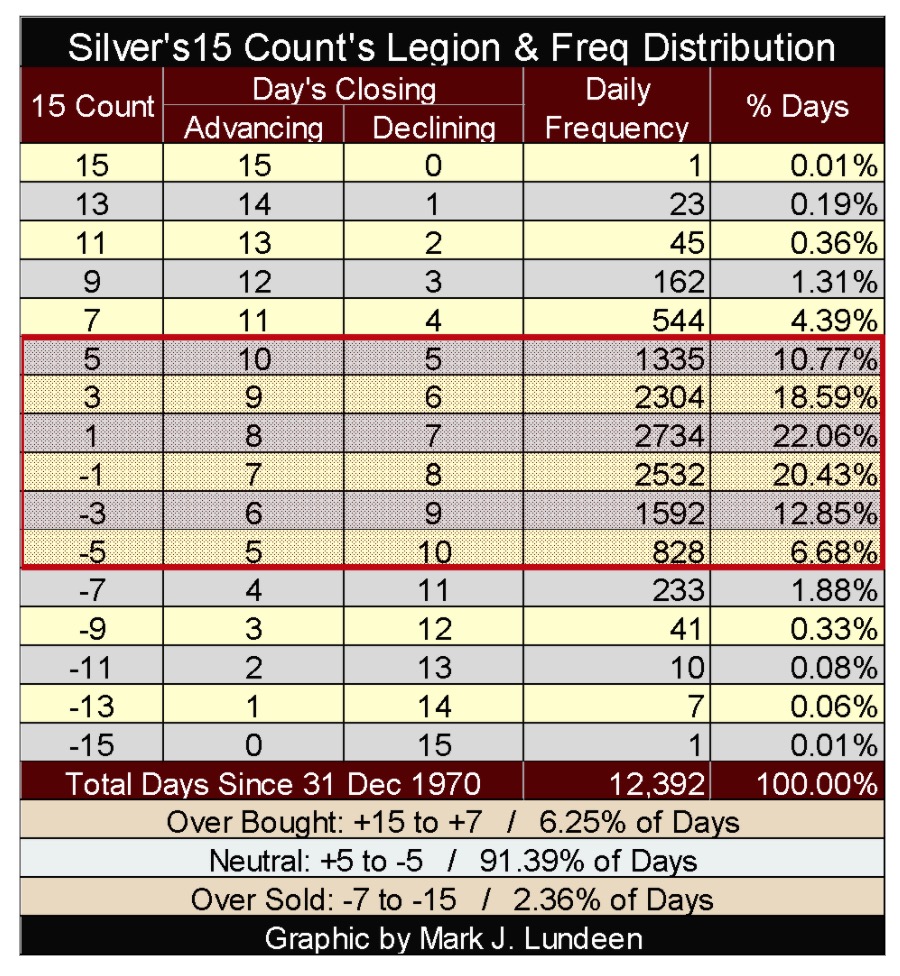
At the same time silver’s 15-count saw a -15, or 15 consecutive down days in a row. Like gold’s 15-count of -13 above, this -15 for silver’s 15-count has happened only once since December 1970; wow!
November 2015 was a depressing time for the old monetary metals, but they then both bottomed in December; not that there were any surviving bulls who cared. Hard bottoms; as noted by negative double-digit 15-counts are the platforms from which big-bull market advances spring from. Sadly for those who lived through them, there is little joy to be had when the market they were formerly so fond of once again begins to advance.
But those were the bad-old days. Still four years after gold’s 45% market correction, most people still don’t care that gold is just a few dollars away from making a new all-time high, at a time when the FOMC is committed to reducing the dollar’s value to ZERO.
But gold and silver are very small markets, and there are enough people who do understand the situation that are currently buying up all the precious metal available in coin shops around the country.
When the public does wake up to what the Federal Reserve is doing to their dollars, panic buying of gold and silver is going to result. And most people will sadly discover there isn’t any gold or silver available in the market for them to purchase at any price.
What to do then? Sell today’s glamor stocks to fund purchases of the miners of gold and silver! The miners are going to see a historic bull market. And when the dollar goes to nothing, Washington will create a new currency that will be gladly traded for the shares of these gold miners. I can’t say the same thing for shares of Apple and Amazon or US Treasury Debt denominated in today’s dollars.
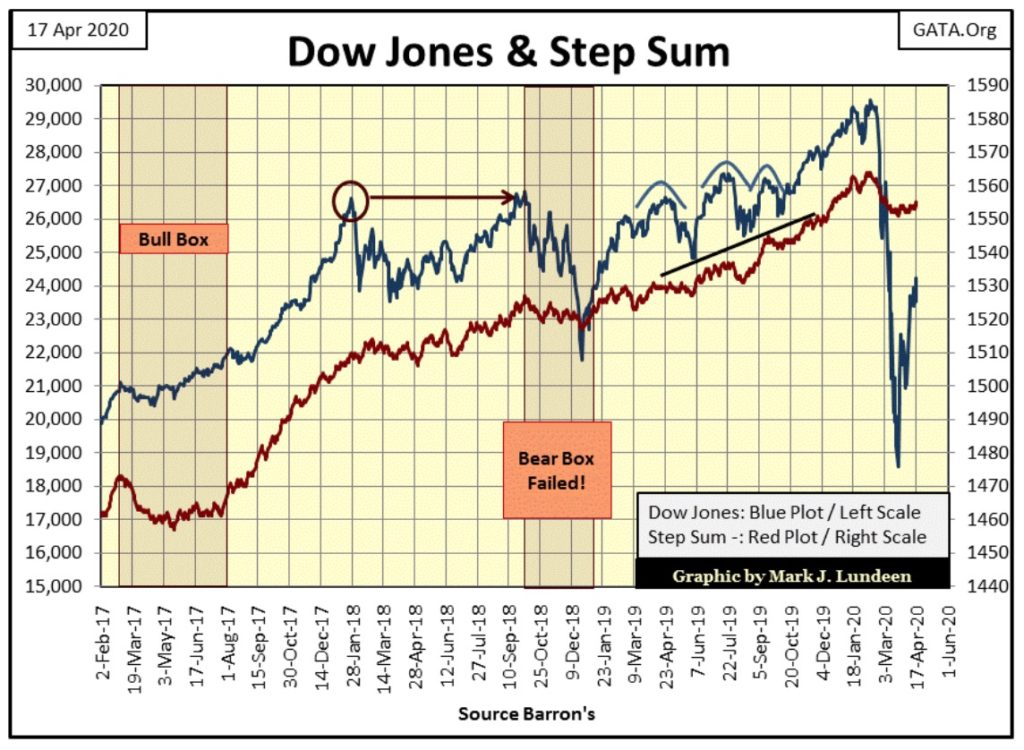
Next is the Dow Jones with its step sum. A bull box is in the works in this chart, a development where the price of a market is going up as its step sum refuses to follow. In any step-sum box formation, be it bull or bear, the price trend is usually correct, which in this case is bullish for the stock market.
But I don’t take such boxes seriously until they gone on for at least eight weeks (two months), with twelve or sixteen weeks even better. So far this bull box has been in the works for only four weeks, and most likely will break up before my threshold of eight weeks. Still I’m tracking it to see if it lasts until late May.
What could break up this box? The price plot could once again break down, or the step sum plot could recouple to the price plot to the upside before the end of May. In any case, seeing a bull box in the works is a positive factor for the bulls.
Moving on to gold’s step sum table below, last week found gold’s 15-count at a +7, or in an overbought market condition. Not surprisingly, gold then saw four consecutive down days, bringing its 15-count down to a +1 on Friday’s close, so gold is no longer overbought.
But a +1 doesn’t really tell us what is likely to come next. However the price of gold has been advancing since last summer. As there is nothing a market can do that’s more bullish than advancing in price, I’m going to assume gold’s next move will be to continue advancing towards its last all-time high in the weeks to come.
However, in a world where coin shops are quickly become gold-free-zones, there is no shortage of paper gold to be had in the COMEX futures-gold market. So like my readers, I too will have to wait to see what actually happens next week to the price of gold and silver. I’m hoping they’ll go up, but they may go down.
Just don’t expect to purchase actual gold or silver bullion at the prices seen on Kitco or the Comex!
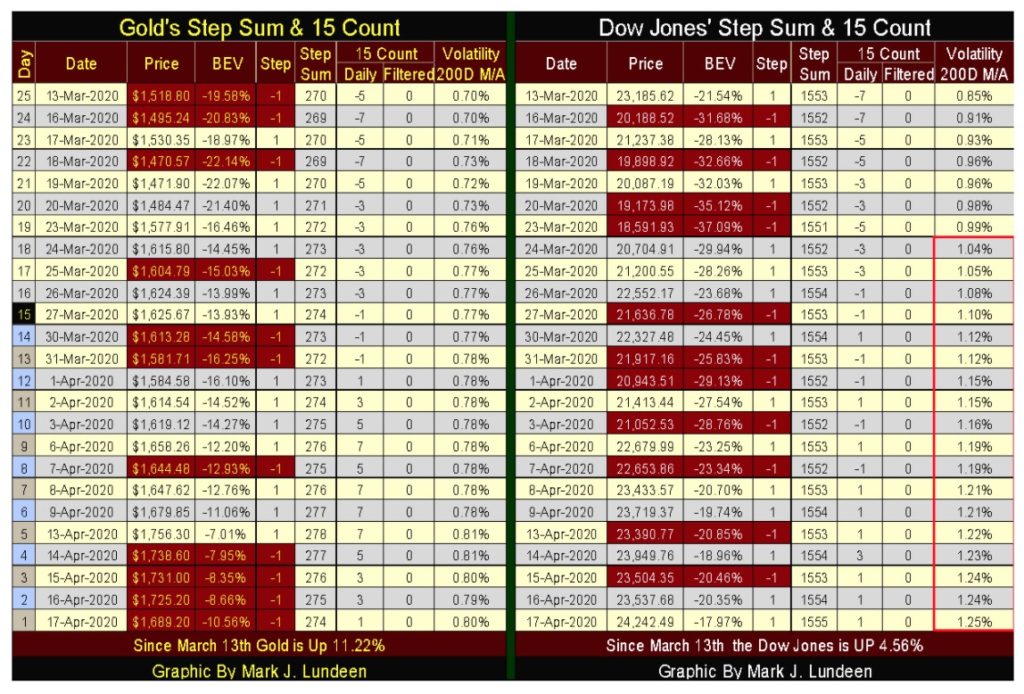
For the Dow Jones in its table above, the most remarkable item is that its daily volatility’s 200 Day M/A reached 1.25% on Friday. If you want to identify the big bear markets for the past 120 years in the chart below, look for Dow Jones’ daily volatility to rise above its 1.00% line.
The only exception to that rule was the April 1942’s 52% bear market bottom (Green Triangle). After living through the Depressing 1930s, four months after Pearl Harbor few cared about the Dow Jones or Wall Street.
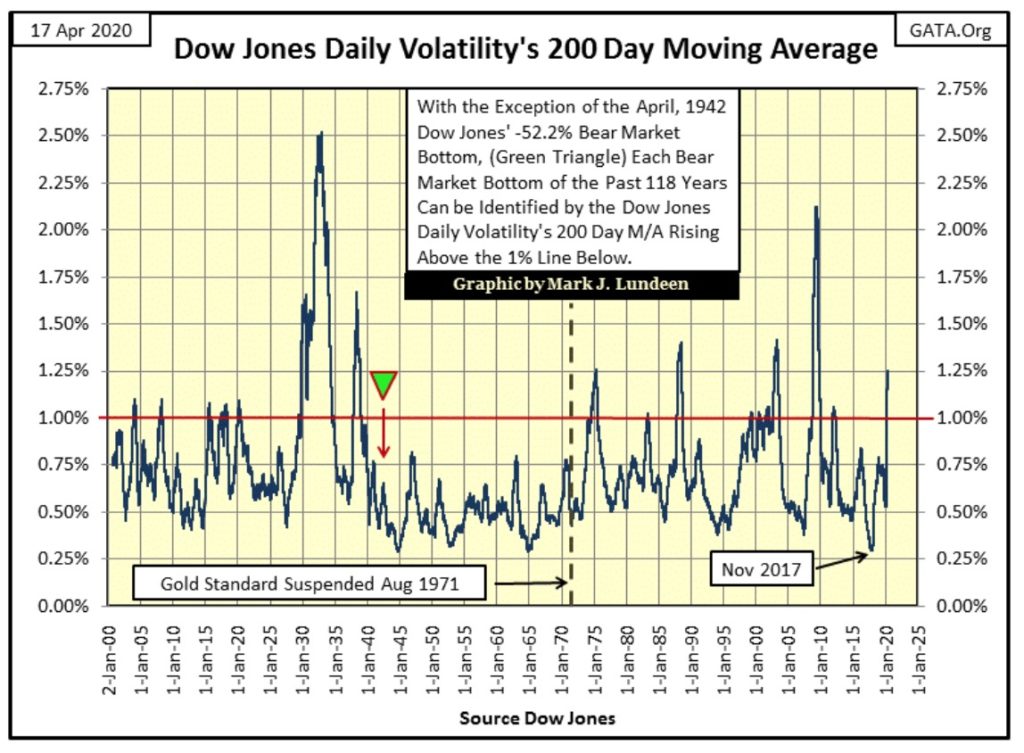
Since January 1900, here is how to use this data for profits; get the heck out of stocks whenever this plot is rising, as it is now. Go back in the market in a BIG WAY when this plot is in decline.
Question: Is Friday’s 1.25% the peak in this bear market’s daily volatility?
If so, now is the time to return to the market in a big way. But if not; should daily volatility in the Dow Jones continue rising to ever greater levels as it did in the Depressing 1930s, and again in 2008-09; you’ll soon be sorry!
So, what’s an investor to do as April 2020 draws to a close?
Hey, I’m not your investment advisor. I’m a guy who for my own reasons likes to share his personal market research with the public. For myself I’m expecting further market declines as 2020 now flows into its summer, autumn and winter. The stock market in my house is about as popular as the coronavirus pandemic.
I’ve been wrong in the past, and I’ll be wrong in the future, but am I wrong now? By early October we’ll all know the answer to that question.
—
(Featured image by Adeolu Eletu via Unsplash)
DISCLAIMER: This article was written by a third party contributor and does not reflect the opinion of Born2Invest, its management, staff or its associates. Please review our disclaimer for more information.
This article may include forward-looking statements. These forward-looking statements generally are identified by the words “believe,” “project,” “estimate,” “become,” “plan,” “will,” and similar expressions. These forward-looking statements involve known and unknown risks as well as uncertainties, including those discussed in the following cautionary statements and elsewhere in this article and on this site. Although the Company may believe that its expectations are based on reasonable assumptions, the actual results that the Company may achieve may differ materially from any forward-looking statements, which reflect the opinions of the management of the Company only as of the date hereof. Additionally, please make sure to read these important disclosures.


PayPal’s Slowdown: From Fintech Leader to Low-Growth Dividend Stock
PayPal has shifted from fintech leader to low-growth, value-style stock, losing over 25% in market value and trading at a...


Tilray (TLRY) Falls as Bearish Momentum Persists Despite Marketing Push
Tilray (TLRY) fell 3.32% to $4.44, remaining below key moving averages and signaling continued bearish pressure. Despite a £1 million...


ESG Gap Persists as Firms Struggle to Link Sustainability to Financial Value
KPMG’s Global Survey shows a major gap between ESG awareness and financial integration. While 72% of managers understand sustainability strategies,...


Bitcoin and Ethereum Slide as Market Pressure Builds Amid Strategy Concerns and Layer 2 Disruptions
Bitcoin fell below $60,000 with heavy ETF outflows, pressured by concerns over Strategy’s finances and its STRC stock decline. Ethereum...


AI Venture Builder Launches €600K Crowdfunding Round to Scale Secure AI Solutions
AI Venture Builder, an Italian-British firm developing AI applications and vertical startups, returns to CrowdFundMe with a equity campaign. After...
 |
|
 |  |
 |
|
-
 Cannabis4 days ago
Trulieve NYSE Listing Signals New Era for Global Cannabis Industry
-

 Africa2 weeks ago
Remote Work Reshapes Sales Management: Key Lessons for Moroccan Leaders
-

 Biotech2 days ago
Gilead HSV Plan Could Transform Market Outlook
-

 Crypto1 week ago
Crypto Market Stays Stable as Bitcoin and Ethereum See Mild Declines