Featured
Stock market on the rise amid costly recovery from Atlantic hurricanes
What could be the cause of the stock market doing well this week despite the devastation wrought by Hurricanes Harvey and Irma?

With the hurricanes over, the cameras have moved away to focus on something else. Yet it is what happens afterward that is more important. Surprisingly, the death toll was not that high, estimated currently at around 81 including deaths in the Caribbean islands. Some of the Caribbean islands were so devastated it could take years to rebuild them—if they can even be rebuilt. Tens of thousands have been left homeless and businesses destroyed, especially the tourist business.
While the devastation in the US (Texas, Florida) overall has not been as bad as what hit the islands, it impacted more people and the costs will be in the hundreds of billions. Trying to get a handle on the costs is difficult as one is dealing largely with estimates. London insurers have estimated it could cost them upwards of $200 billion. Total costs for the disasters could reach $500 billion. The question is, where will the money come from? If insured, from the insurance companies. The rest would have to come from the taxpayer.
There is no doubt it will take some time to recover from these hurricanes, given the widespread damage. Thousands of people have been left homeless and many may well need to be relocated. Thousands are without jobs. Millions remain without power that could take weeks to restore. Businesses are trying to carry on with no power. Half of Florida’s citrus fruit industry has been wiped out. It is estimated that the hurricanes could shave upwards of 0.5% to over 1% off Q3 GDP. There will be residual effects into Q4.
Yet the stock markets continue to rise. This past week the Dow Jones Industrials (DJI) and the S&P 500 hit new all-time highs. It has not yet been confirmed by the NASDAQ and the Dow Jones Transportations (DJT). This divergence needs to be confirmed.
Venezuela announced that they would no longer accept US$ as payment for their oil. Instead, the main currency they will accept is Euros. Venezuela also noted they would accept Russian Rubles, Chinese Yuan, and Indian Rupees. The latter three left most scratching their heads as it mostly seemed designed as rhetoric. Nonetheless, it should be noted that the last two countries that tried to stop accepting US$ for their oil were Iraq and Libya. Both were invaded and their leaders were overthrown.
North Korea launched another missile and threatened to reduce the US to “ashes and darkness” as Kim believes they “should be beaten to death like a rabid dog.” Russia conducted war games on NATO’s borders and at the same time that NATO was conducting war games on Russia’s borders. The markets yawned; gold sold off.
Possibly the most important story of the week was one that flew completely under the radar. Probably deserved to fly under the radar, as it seems fanciful. But then we are dealing with the Trump administration. Treasury Secretary Steve Mnuchin said if China doesn’t follow the UN sanctions approved against North Korea he would seek new financial sanctions on China to cut off access to the US financial system.
Eh, what? Cut off China from the US financial system and the international US Dollar system (SWIFT)? China is the world’s second-largest economy where the US and China do $650 billion of trade annually. It is not “even” trade as the US has a trade deficit of about $350 billion given that the US imports more from China than China does from the US. China also holds about $1 trillion in US debt, about 28% of all US Treasury notes, bonds and bills held by foreign governments and 1/20th of all US Treasury debt.
Mnuchin also threatened more sanctions against Chinese banks and companies that do business with North Korea. The US House of Representatives Foreign Affairs Committee also threatened to go after other companies in other countries that do business with North Korea.
The trouble with threats against China as we have already seen with sanctions against Russia is that it brings “tit for tat” retaliatory measures that could potentially be catastrophic for the global economy. In a trade war between the US and China, the world would lose. Global trade is already falling. China and Russia have been in the process of creating a Chinese yuan-based system backed by gold that includes not only the resurrection of the “Silk Road” but also an equivalent of the World Bank, the IMF, and the global payments system known as “SWIFT.” It all has the potential to hurt the US Dollar. The US Dollar has been falling rapidly the past few months, seemingly in anticipation of the creation of a parallel financial system not based on the US Dollar.
China hosts numerous US firms including Apple, Microsoft, GM, and Boeing. Would barring China from the US financial system mean they can’t sell their goods in the US any longer? What if China in retaliation nationalized US factories and banks operating in China? Somehow, this threat does not appear to be too well thought out.
Furthermore, both China and Russia border North Korea making enforcement of any sanctions regime against North Korea very difficult. Yet the rhetoric and war games involving the US (NATO), Russia, and China continue. North Korea seems to be nothing more than a pawn in a much bigger and potentially more dangerous game.
MARKETS AND TRENDS
| Percentage Gains Trends | ||||||||
| Stock Market Indices | Close
Dec 31/16 |
Close
Sep 15/17 |
Week | YTD | Daily (Short Term) | Weekly (Intermediate) | Monthly (Long Term) | |
| S&P 500 | 2,238.83 | 2,500.23 (new highs) | 1.6 | 11.7 | up | up | up (topping) | |
| Dow Jones Industrials | 19,762.60 | 22,268.34 (new highs) | 2.2 | 12.7 | up | up | up (topping) | |
| Dow Jones Transports | 9,043.90 | 9,546.25 | 1.7 | 5.6 | up | up (weak) | up (topping) | |
| NASDAQ | 5,383.12 | 6,448.47 | 1.4 | 19.8 | up | up | up (topping) | |
| S&P/TSX Composite | 15,287.59 | 15,173.03 | 1.3 | (0.8) | up (weak) | down | up (weak) | |
| S&P/TSX Venture (CDNX) | 762.37 | 779.66 | 1.0 | 2.3 | up | down (weak) | up (weak) | |
| Russell 2000 | 1,357.14 | 1,431.77 | 2.3 | 5.5 | up | up (weak) | up (topping) | |
| MSCI World Index | 1,690.93 | 1,960.24 (new highs) | 0.6 | 15.9 | up | up | up | |
| Gold Mining Stock Indices | ||||||||
| Gold Bugs Index (HUI) | 182.31 | 206.97 | (4.5) | 13.5 | up | up | up | |
| TSX Gold Index (TGD) | 194.35 | 200.86 | (3.7) | 3.4 | neutral | neutral | up (weak) | |
| Fixed Income Yields | ||||||||
| U.S. 10-Year Treasury yield | 2.45 | 2.20 | 6.8 | (10.2) | ||||
| Cdn. 10-Year Bond yield | 1.72 | 2.07 | 6.7 | 20.4 | ||||
| Currencies | ||||||||
| US$ Index | 102.28 | 91.65 | 0.4 | (10.4) | down | down | down | |
| Canadian $ | 0.7440 | 0.8210 | (0.2) | 10.4 | up | up | up (weak) | |
| Euro | 105.22 | 119.56 | (0.6) | 13.6 | up | up | up | |
| British Pound | 123.21 | 135.99 (new highs) | 3.0 | 10.4 | up | up | down | |
| Japanese Yen | 85.57 | 90.19 | (2.7) | 5.4 | down | up | up (weak) | |
| Precious Metals | ||||||||
| Gold | 1,151.70 | 1,325.20 | (1.9) | 15.9 | up | up | up | |
| Silver | 15.99 | 17.70 | (2.3) | 10.7 | up | up | up (weak) | |
| Platinum | 905.70 | 971.80 | (4.0) | 7.3 | neutral | up | down (weak) | |
| Base Metals | ||||||||
| Palladium | 683.25 | 921.75 | (1.0) | 34.9 | up (weak) | up | up | |
| Copper | 2.5055 | 2.95 | (3.0) | 17.7 | neutral | up | up | |
| Energy | ||||||||
| WTI Oil | 53.72 | 49.89 | 5.1 | (7.1) | up | neutral | down (weak) | |
| Natural Gas | 3.72 | 3.02 | 4.5 | (18.8) | up | down (weak) | neutral | |
© David Chapman
Note: For an explanation of the trends, see the glossary at the end of this article.
New highs/lows refer to new 52-week highs/lows.
Source: StockCharts.com
North Korea launches another missile. The stock market yawns. Trump cuts deals with the Democrats. The stock market rejoices. Hurricane Irma and Hurricane Harvey? The stock market thinks it`s a money making proposition and moves higher. Steve Mnuchin threatens China with sanctions. The stock market yawns.
Yes, it does seem at times that this is the unstoppable stock market. Pullbacks are fairly brief and shallow. Maybe there is a “put”` underneath the market. After all, in the 1990s they used to talk about the Greenspan “put.” Maybe there is a Yellen “put”—meaning no matter what the authorities will come to the rescue to ensure the stock market keeps moving higher. After all, with stagnant wages, this is the one way the average citizen makes money. Some 47% of American households are in the stock market mostly through funds.
The Dow Jones Industrials (DJI) and the S&P 500 made new all-time highs this past week. No, they were not alone. The MSCI World Index, the Dow Jones Utilities (DJU), the S&P 100 (OEX), the NYSE Composite Index, the Russell 1000, the Russell 3000, the NASDAQ 100 and the Wilshire 5000 Composite all joined the party. Not joining the party were the NASDAQ Composite and the Dow Jones Transportations (DJT). If there is a nagging divergence, it is the failure of the DJT to join the DJI in making new highs. The averages are supposed to confirm each other, according to Dow Theory.
Naturally, it could still happen. Confirmation of the divergence can only be made when there is a breakdown confirming a high. For the S&P 500, we would need to break down under 2,400. For the DJI we would need to break down under 21,600. But those, in turn, might only confirm tops on the daily charts. More important would be confirmations on the weekly charts. For the DJI that would be a breakdown under 20,400 and for the S&P 500 under 2,300.
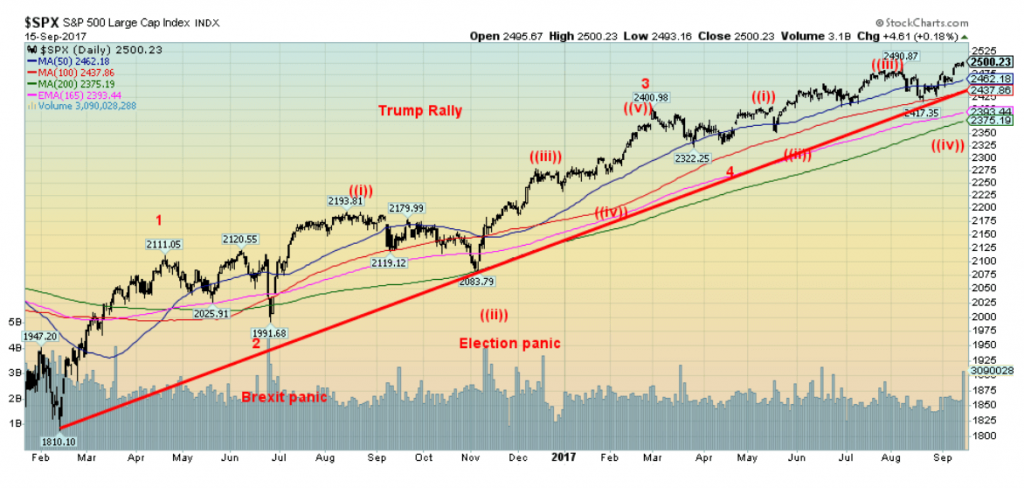
They say the market climbs a “wall of worry.” Certainly there is a lot to be worried about. But the market keeps going higher. The bulls will say it’s because it is for the long term. The bears will say okay, it’s going higher but it will eventually collapse. The question is, what will be the trigger and when? That is why we are more comfortable watching breakdown points and until those points are broken the trend is up.
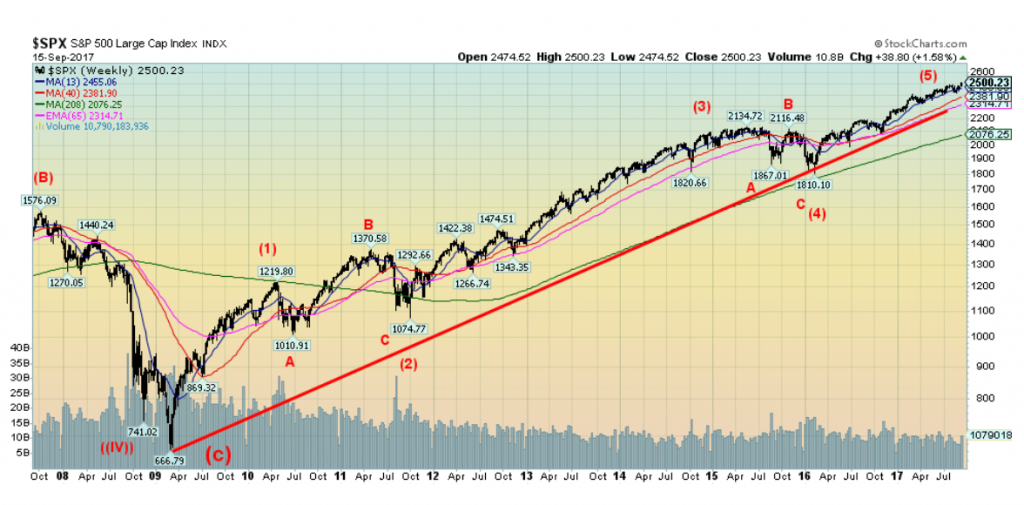
The wave count shown is from Elliott Wave International www.elliottwave.com. We cannot help but notice Elliott Wave International has made numerous adjustments to their wave count as the market moves higher. Such are the nature and complexities of the Elliott wave. We are more comfortable with the big picture wave count and in that respect we know we are on the 5th wave up from the 2009 major low. Two major corrections were seen in 2011 during the EU Greek crisis (2) and again in 2015/2016 during the tapering of QE (4). So we are in wave (5). It will end. It is a question of when, not if.
© David Chapman
© David Chapman
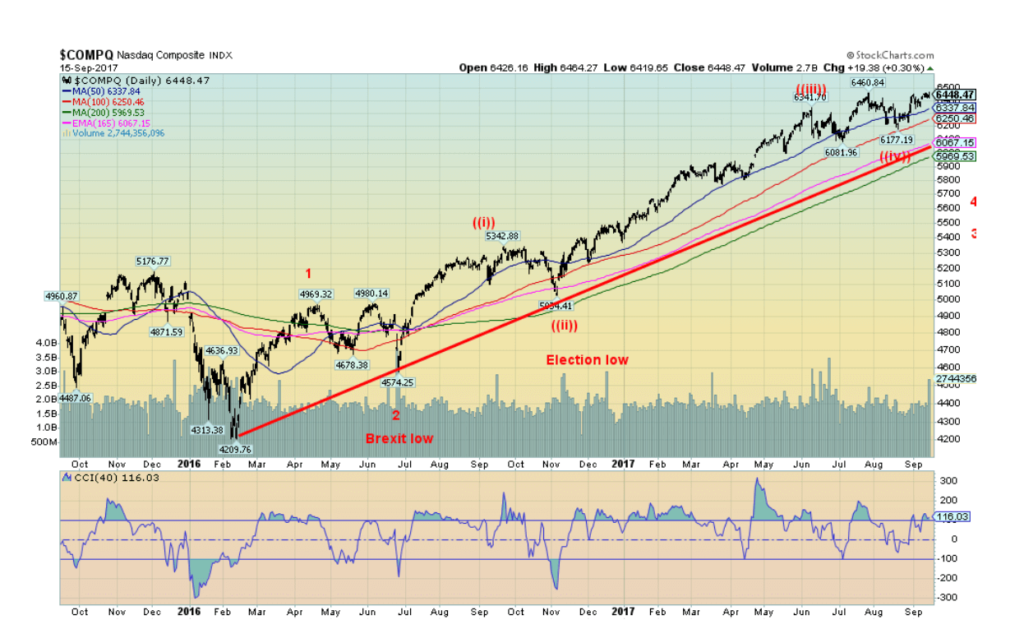
Here is the NASDAQ Composite dominated as it is by the FAANGs (Facebook, Apple, Amazon, Netflix, and Google). The NASDAQ did not make a new all-time high this past week. But it is very close to making one. We put on our own wave count from the important February 2016 low. Our conclusion is we are still working on minor wave 3 to the upside although we are in the 5th wave. Following what could be a short sharp correction (wave 4) into October November we should embark on one more wave to the upside that could take us into the first quarter of 2018. It is not a whole lot different from Elliott Wave Internationals interpretation, but we consider ourselves merely rank amateurs beside Elliott Wave International. Anyway, it is a potentially interesting premise that does suggest there is more to come in this bull market before we see the final top.
© David Chapman
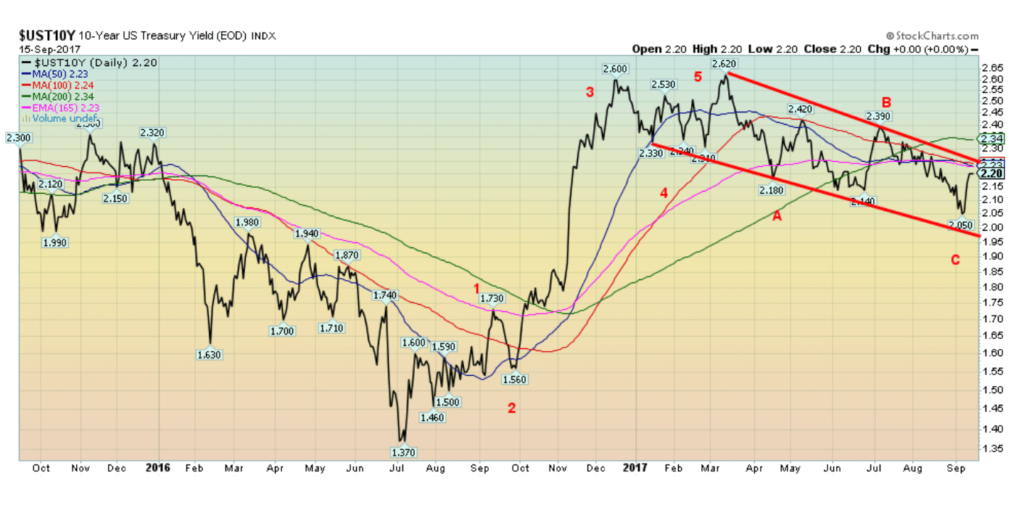
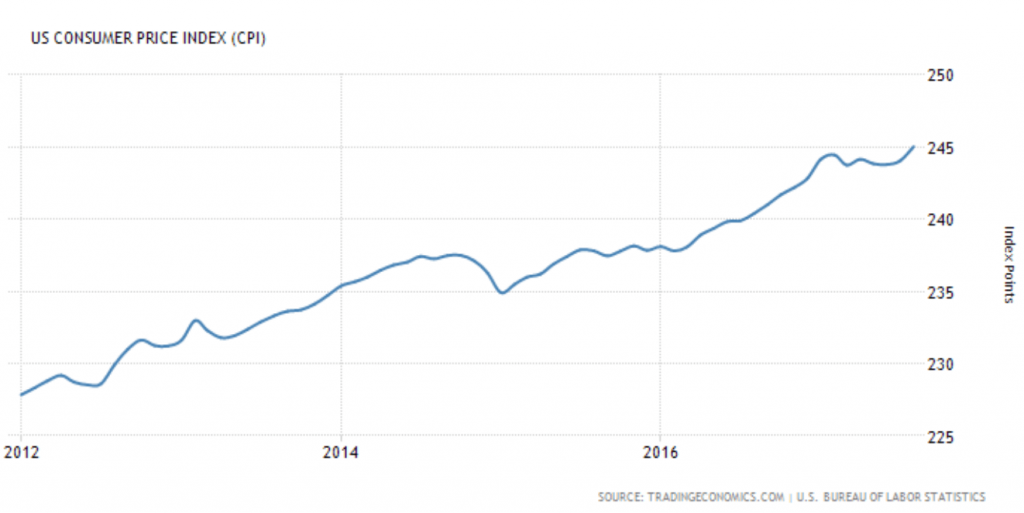
Thanks to a jump in inflation this past week US bonds jumped in yield (prices that move inversely to yields fell). The yield on the 10-year US Treasury note jumped to 2.20% from 2.06% a week earlier. Canadian bond yields also rose as the 10-year Government of Canada bond rose to 2.07% from 1.99% a week earlier. The 10-year Treasury note is now just below a breakout to the upside at 2.25%.
Above 2.35%, odds increase that the note could challenge the high seen in March 2017 at 2.62%. It is possible the 10-year note has completed an ABC corrective wave (wave 2) from the 2.62% high. The run from July 2016 does appear to have unfolded in five waves to the upside. However, we need confirmation. If we are correct, then wave 3 is to the upside. That wave could last months and take the 10-year to 3% or higher. US government debt now officially exceeds $20 trillion or 103% of GDP. Sounds high, but in the context of global debt of $230 trillion, it is still small peanuts.
Source: TradingEconomics.com
Inflation took an uptick this month with the US CPI up 0.4% from August. Even the core rose 0.2% on the month. Both were higher than expected. Year over year it still seems benign at 1.9% while the core remained relatively flat at 1.7% year over year. The core remains below the Fed`s target of 2%. A jump in gasoline prices was a prime mover following the hurricanes and the shutdown of refineries.
Source: StockCharts.com
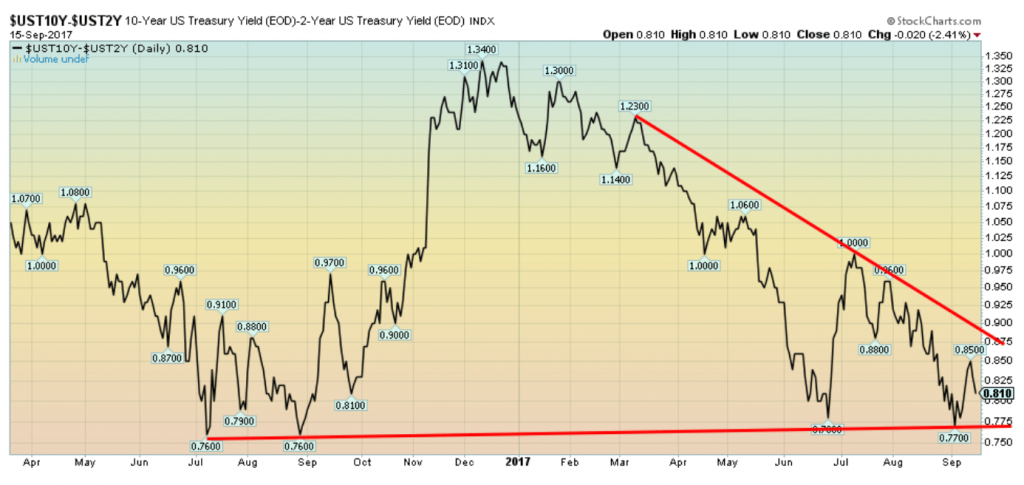
Spread watch. The jump in longer-dated yields was not matched in the short-end this past week. The result was the 2–10 spread bounced once again off its major support line to close at 0.81%, up from 0.79% the previous week. We continue to believe this spread will eventually crash through the major support and head sharply lower. That suggests further pressure should be seen on short rates. Recall the debt ceiling comes up again December. Our thoughts are, given the ongoing dysfunction in US politics, the debt ceiling fight in December could turn rancourous, thus potentially threatening a government shutdown and a technical default. That is of course, setting aside the recent deal between the President and the Democrats.
Source: StockCharts.com
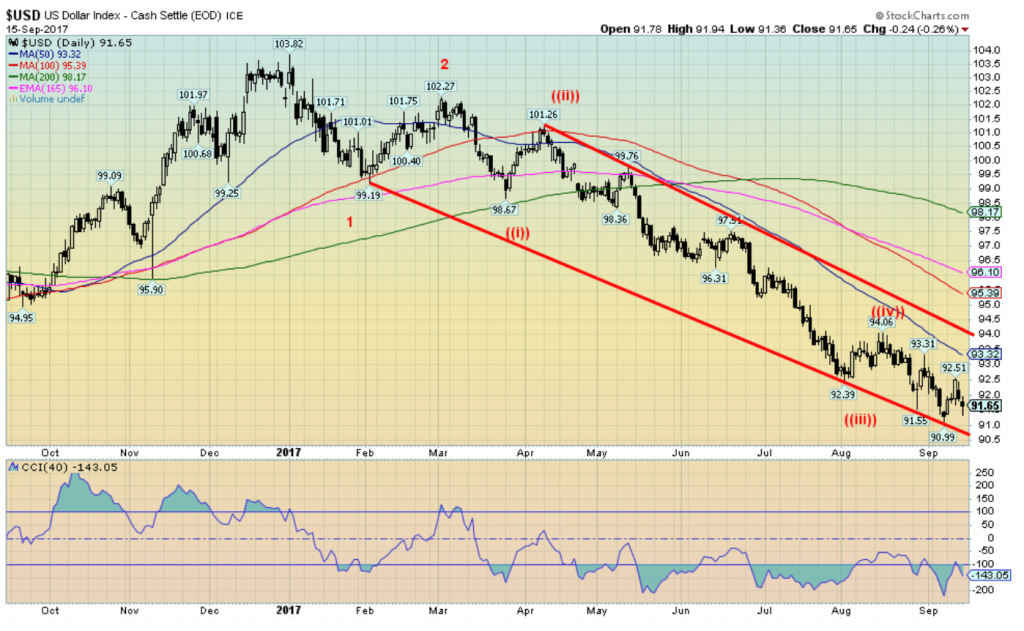
After trying to bounce back this past week, the US$ Index now appears poised to fall further once again. A solid break of the recent low at 90.99 could start a descent to our next targets near 88. So what is triggering the US$ Index’s descent? There are signs the US economy is beginning to weaken, as seen in recent retail sales figures and unemployment numbers. The hurricanes and their resultant cleanup could be a drag on the economy for months. Inflation is picking up, giving the US$ Index a double whammy. Recall the long decline of the US$ Index in the 1970s was the result of a weak economy and rising inflation. Political discord continues in Washington and elsewhere.
Rhetorical or other clashes between the US, North Korea, China, and Russia make many people nervous, causing them to seek out safe havens other than the US$. Finally, countries moving off of the US$ as the prime currency for trade and oil—such as Venezuela, China, and a host of other Asian nations who are increasingly using the Yuan—lessens the need for US$ holdings. The beneficiaries going forward have been the Euro, the Yen, the Swiss Franc, gold and to a lesser extent the Canadian Dollar. Increasing global use of the Yuan will increase its value vis-à-vis the US$.
The recent high was at 92.51 and if the US$ Index were to return there and take it out a run to 94 could not be ruled out. But the US$ Index appears to be locked in a long-term descent. This is despite attempts by the Fed to prop up the US$ by hiking interest rates and jawboning. But even Trump likes a lower US$ as it could help US exports. New lows below 90.99 could point the way lower towards the next potential targets of 88.
Source: CoinDesk.com
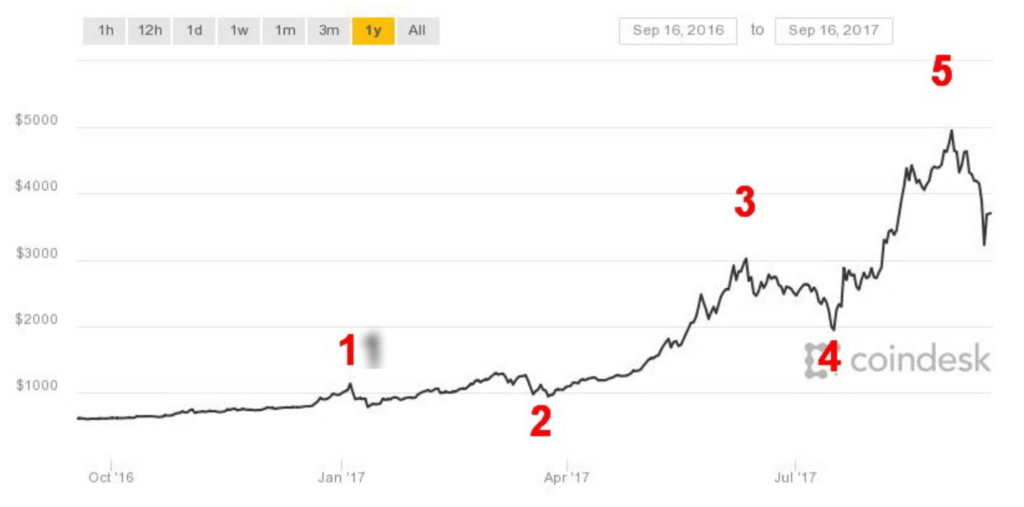
Is Bitcoin about to come down to earth? This past week saw Bitcoin dramatically drop to the low $3000s after topping near $5,000 on September 2, 2017. The trigger was China banning fundraising for initial coin offerings (ICOs) followed by a cease trading order. This in turn could spread. After soaring from around $500 only a year ago the rise in Bitcoin has been nothing short of spectacular. But the past few weeks started to trace out what appears to be a head and shoulders top pattern. Bullish sentiment was at extremes. When the trendline broke, Bitcoin fell rapidly. It made a recovery on Friday but it may be only a “dead cat bounce.” This drop has been more severe and it fell from a definitive top pattern. A 40% drop in a matter of 10 days is nothing to sneeze at. It projects down to at least $2,500 which would be at least a 50% correction.
Bitcoin is not the only crypto currency. Two others, Ethereum and Ripple both made their tops earlier in May and June. They did not accompany Bitcoin to the September top, a classic non-confirmation divergence. Manias are never permanent. Just ask about those who bought tulips in the 17th century (a classic bubble known as Tulipmania). And we do point out the NASDAQ that soared in the 1990’s but during the dot.com bust of 2000–2002 fell over 80%. Many dot.com stocks ceased to exist (remember Nortel?) Maybe crypto currencies are the next big thing. But their longevity will be determined by how well they handle and recover from a crash. Until we can buy a hamburger and pay our taxes with a crypto currency one has to wonder, are they today`s tulips (which incidentally survived the mania and people still plant them every spring).
Source: StockCharts.com
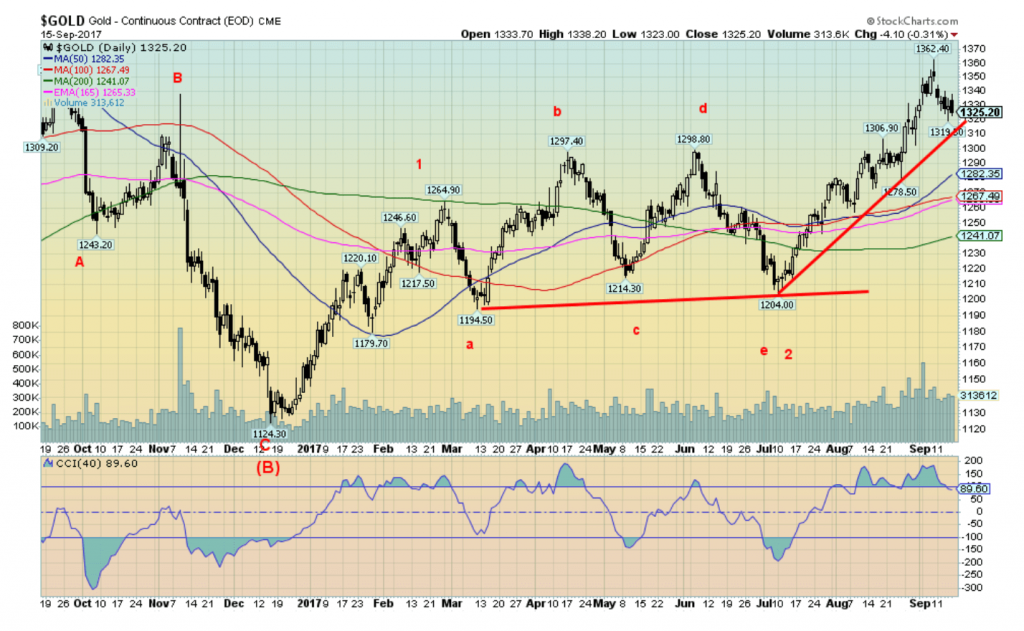
Gold hit our major breakout point near $1,360 then turned down. Gold has found support thus far in the $1,320/$1,330 range with stronger support down to $1,300 once we break under $1,320. Gold fell on Friday despite a weaker US$ Index, North Korea, and a host of other reasons as to why gold should have gone up on Friday not down. Furthermore, we have read that India’s gold imports jumped three-fold during the April/August period as well as signs that gold demand in China is higher than that being reported. Gold has jumped more than $100 from the 10 July 2017 low but has now faltered at our key breakout point.
Does that mean that gold is about to fail here? Probably not. We noted a buildup in short position of the commercial COT before this recent drop and certainly, that may be playing a role, or as some say “crass” manipulation by the banksters. More important is we view these types of pullbacks as normal and preferable to one where it just goes straight up. It is important to have these corrections along the way to strengthen the bull case not weaken it.
Naturally, it is also important that gold holds above previous lows to strengthen the bull case that a favorable trend is unfolding. We note two recent August lows at $1,272 and $1,278. As long as the pullback stays above those levels the trend remains up. All our trends are currently pointed up, daily (short), weekly (intermediate), and, monthly (long-term). A burst above $1,360 would put $1,400 within sight. It will come, but at this point we can’t say whether this current correction might have another week to run.
We suppose if we want to worry it is in the past couple of years gold has basically topped out in September to be followed a long steady decline into December. Will this happen this year? Anything is possible which is why we note that $1,272/$1,278 zone. As long as it holds on any pullback then odds favour higher prices ahead.
Source: StockCharts.com
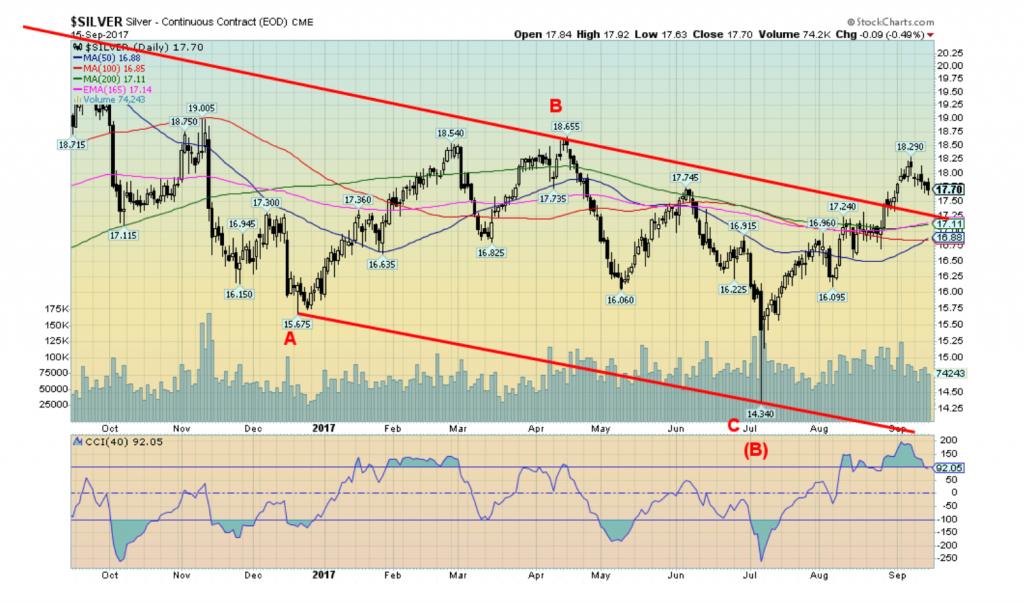
Silver continues to baffle and confuse us. Ideally we want silver (and the gold stocks) leading the way to the upside. That has not been the case. Silver made lower lows on July 10, 2017 then did gold. Silver has thus far failed to take out its April 2017 high of $18.66. Gold has long cleared those points once it broke above $1,300. On the positive side, silver has finally broken its downtrend line and above the key MAs of 50, 100, and 200. There is considerable support down to $17 to $17.25. We cannot rule a test of that support. Silver’s trends are not as strong as gold. The monthly (long-term) trend has finally turned up but it is weak so far. We need to see that strengthen. Nonetheless, as with gold, we remain optimistic this is just a pullback within the context of a new uptrend. Key as noted is at roughly $16.90/$17. As long as we stay above that level the trend remains intact.
Source: COTPriceCharts.com
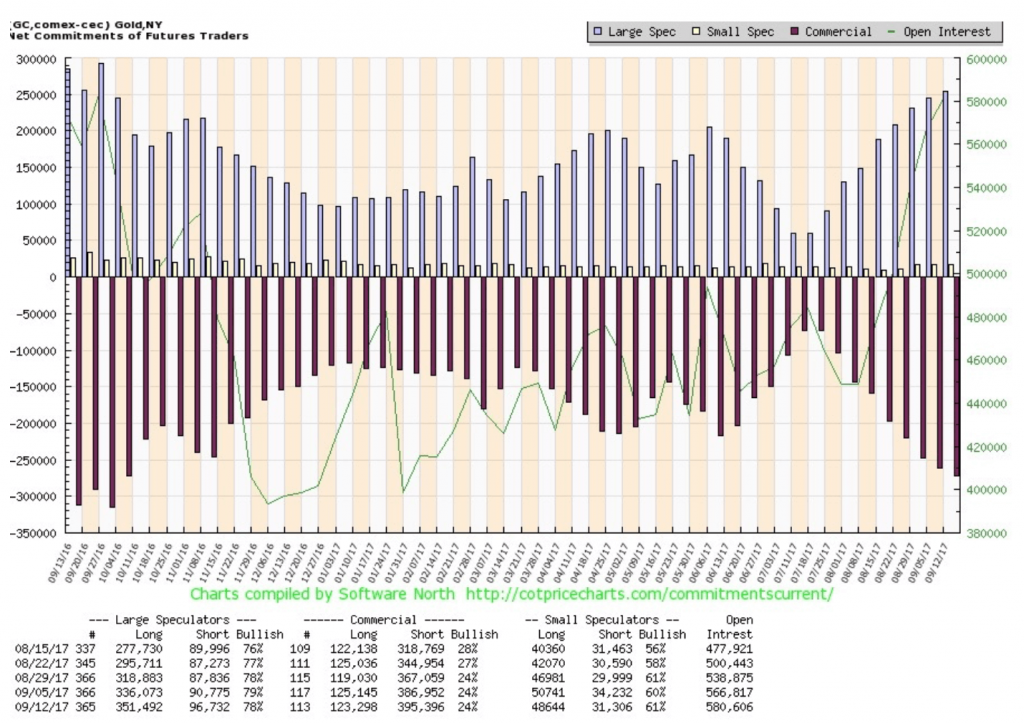
For the third week in a row, the commercial COT remained at 24%. This is a negative drag on gold prices going forward. There was little change in the makeup as long open interest slipped by roughly 2,000 contracts while short open interest rose by roughly 8,000 contracts. We note that the large speculators COT slipped slightly to 78% from 79%. Still, their long open interest jumped by roughly 15,000 contracts even as short open interest was up about 6,000 contracts. The silver commercial COT (not shown) also deteriorated this past week to 26% from 28% even as the large speculators COT jumped to 79% from 75%. For the commercials, long open interest was only off roughly 1,000 contracts but short open interest jumped about 6,000 contracts. The large speculators added roughly 6,000 contracts to their long open interest and slashed their short open interest by about 5,000 contracts. The reported commercial COT is still a concern. Only a rising gold and silver price might force them to cover some of their short positions.
Source: StockCharts.com
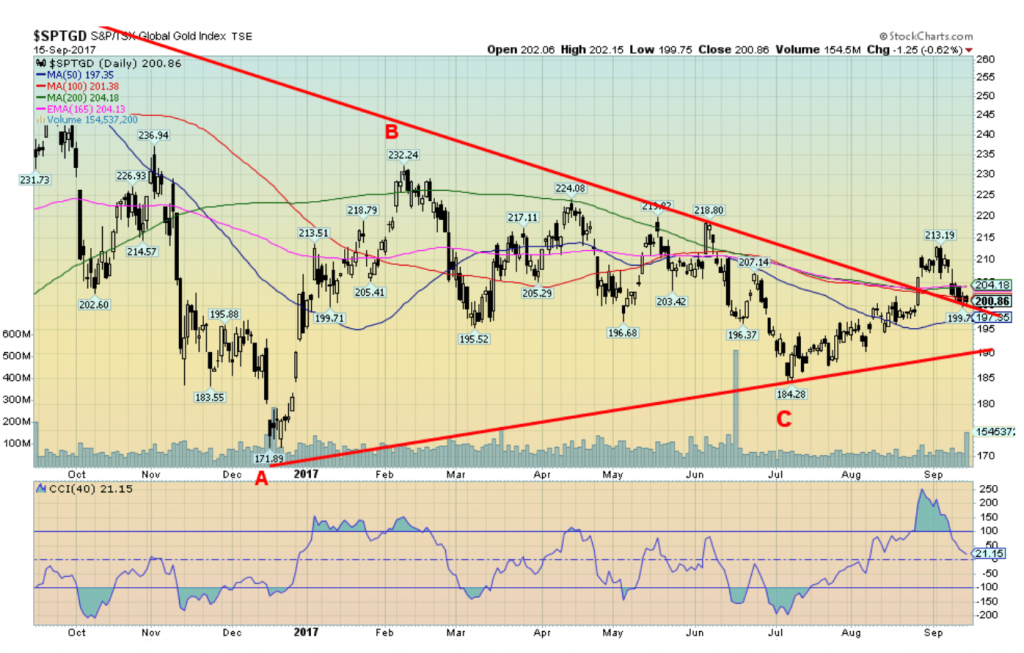
Gold stocks continue to give us grief. As with silver, we prefer that gold stocks lead in a bull market. They certainly do a good job of leading in a bear market. While we did not see new lows as with silver at the July 10, 2017 low, the TSX Gold Index (TGD) remains below highs seen in February and April 2017. The TGD is nowhere near its July 2016 high of 283. After hitting a high of 213 on September 6, 2017 the TGD has fallen 5.6%. Our key support zone is seen at 195 to 200. We are now at the high end of that range. A break under 195 could suggest a test of 190 and even the July 2017 low of 184. The down trend line shown is from the July 2016 high. We are currently testing that breakout. Another reason we need to see the TGD hold roughly in the current range.
Source: StockCharts.com
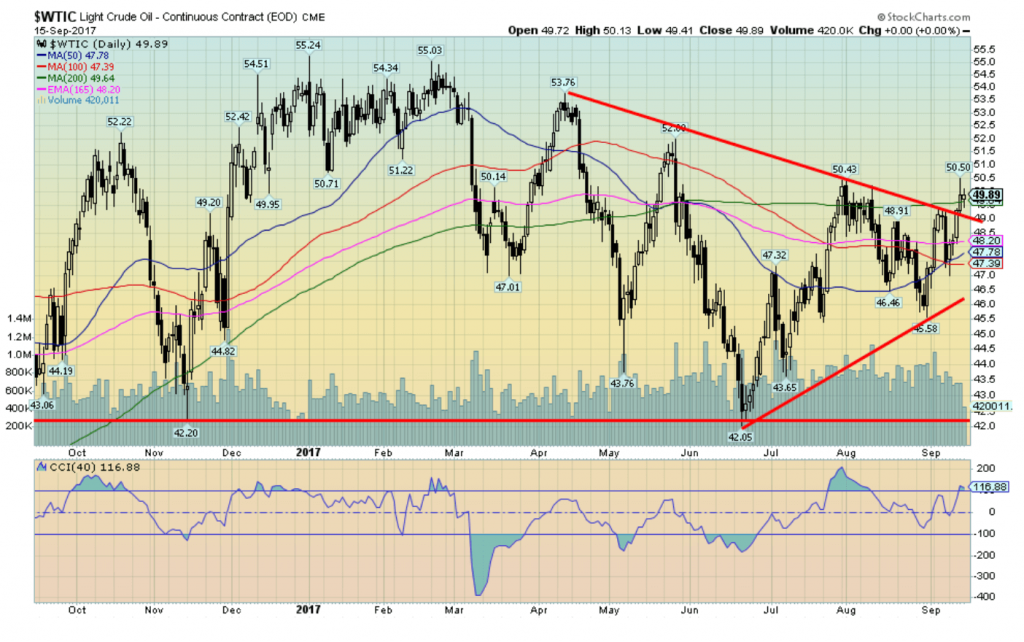
We can’t help but notice that WTI oil has broken out above its downtrend line from the February/April 2017 highs. WTI oil also managed to close (barely) above the 200 day MA as well this past week. This is a potentially positive development. WTI oil has support down to $47 and $46. As long as any pullback holds these levels WTI oil could be poised to turn up. Still there is considerable resistance above at $50/$51, $52 and $54. Above $55, odds favour new highs.
Source: StockCharts.com
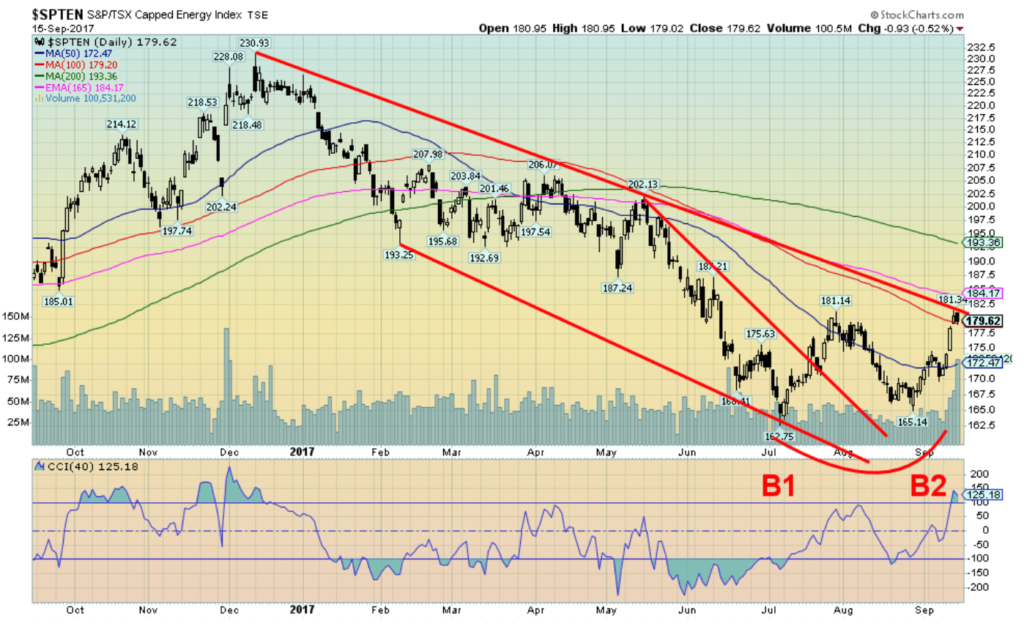
With WTI oil prices turning up it is probably no surprise that the energy stocks are looking a little “perkier.” Could the TSX Energy Index (TEN) have made a double bottom (B1 and B2)? Technically we broke above the neckline of a potential double bottom. It projects up to at least 200. As well we note the TEN busted above a possible descending wedge triangle in July 2017. The wedge pattern projects up to around 200 to 210. So, the two fit nicely. Above lies the 200-day MA 193 so that might provide a bit of resistance. Nonetheless, energy stocks turning should also help the TSX Composite given their dominance in the index.
GLOSSARY
Trends
Daily – Short-term trend (For swing traders)
Weekly – Intermediate-term trend (For long-term trend followers)
Monthly – Long-term secular trend (For long-term trend followers)
Up – The trend is up.
Down – The trend is down
Neutral – Indicators are mostly neutral. A trend change might be in the offing.
Weak – The trend is still up or down but it is weakening. It is also a sign that the trend might change.
Topping – Indicators are suggesting that while the trend remains up there are considerable signs that suggest that the market is topping.
Bottoming – Indicators are suggesting that while the trend is down there are considerable signs that suggest that the market is bottoming.
(Featured image by NASA Goddard Space Flight Center via Flickr. CC BY 2.0. All charts are courtesy of Stock Charts, Trading Economics, CoinDesk and COT Price Charts.)
—
Disclaimer
David Chapman is not a registered advisory service and is not an exempt market dealer (EMD). We do not and cannot give individualised market advice. The information in this newsletter is intended only for informational and educational purposes. It should not be considered a solicitation of an offer or sale of any security. The reader assumes all risk when trading in securities and David Chapman advises consulting a licensed professional financial advisor before proceeding with any trade or idea presented in this newsletter. We share our ideas and opinions for informational and educational purposes only and expect the reader to perform due diligence before considering a position in any security. That includes consulting with your own licensed professional financial advisor.


Abivax Shares Surge as New Trial Data Eases Safety Concerns Over Ulcerative Colitis Drug
Abivax shares surged nearly 36% after positive updated trial results for its ulcerative colitis drug obefazimod reassured investors following earlier...


El Dorado Raises $9M to Expand Cross-Border Fintech Platform
El Dorado, a Latin American fintech improving cross-border financial services, raised a $9 million Series A led by Paradigm with...


Bitcoin Stalls Near $60K as Strategy Moves, ETFs Outflow, and EU MiCA Rules Take Effect
Bitcoin hovers near $60,000 with ETF outflows, while Strategy boosts reserves, sells BTC, and raises dividends to reassure investors. Ethereum...


Cannabis Dominates Global Drug Use: Trends, Risks, and Shifting Markets
Cannabis remains the world’s most widely used illicit drug, with 256 million users in 2024, surpassing all others combined. Growth...


Italy Approves First Hydrogen-Powered Train for National Rail Network
ANSFISA has approved Italy’s first hydrogen-powered train, the Alstom HMU214, for use on the Brescia–Iseo–Edolo line. Capable of 140 km/h,...
 |
|
 |  |
 |
|
-

 Impact Investing2 weeks ago
AI Adoption in Italian Retail Stalls Despite Strong Experimentation
-
 Cannabis24 hours ago
Cannabis Dominates Global Drug Use: Trends, Risks, and Shifting Markets
-

 Impact Investing1 week ago
EU Weighs More Free Emission Permits in ETS Review to Boost Industry Competitiveness
-

 Impact Investing2 weeks ago
SBTi Net-Zero Standard 2.0 Enhances Corporate Climate Action
You must be logged in to post a comment Login