Featured
The stock market struggles at 500 level
The recent rollercoaster dynamics in stock market trading leaves investors worrying about stock market failure leading to a major crash.
On Tuesday, Rodney Johnson talked to his Triple Play Strategy subscribers about the extreme volatility we’re experiencing in the markets. He asked the question: “How are you feeling?” as he observed that investors are looking increasingly tired from the extreme drops and bounces we’ve endured the last few weeks. He concluded that the situation isn’t looking good, and he’s admittedly turned bearish.
I may be with Rodney on that.
Never mind that the economy and debt and financial asset bubbles need to deflate if we’re ever to grow again. Right now, the bears are putting up a fight for dominance. But the short-term fluctuations seem to be favoring the upside a bit for now.
Previously, I wrote that there are two scenarios we could see in the stock market before the inevitable greatest crash of our lifetimes.
Well, we keep testing the bottom trend-lines of the final “orgasmic” rally but have yet to see anything more than a few minor, brief breaches. Like mentioned earlier, it’s exhausting.
In my mind, those breaches suggest we could see a strong break to the downside. It could even get as bad or as violent as the sudden 1987 crash. If that happens, as my research suggests, the first drop could be at least 30 percent—and may even extend to 50 percent—in a matter of months.
The big question on everyone’s mind is: when?
In the last 12 trading days, stocks have been up or down as much as 500 to 700 points on the Dow (something that happened just before the sudden two-week crash in the Dow in 1987).
And yes, the stock market is way overvalued due to Quantitative Easing (QE) and zero-interest-rate policies since early 2009, so it won’t take much to upturn the apple cart (ahem… trade war with China… or disappointing job and economic growth numbers ahead, despite projections to the upside…)
Yet, as I said earlier, the indicators seem to be favoring a break up, not down.
Since everyone is confused, I keep looking at chart patterns. Most other indicators have been rendered useless thanks to central banks taking over the free-market system with endless QE and now tax cuts from the fiscal side.
Look at this chart.
Recent volatility suggests up or down break
S&P 500 and potential reverse head-and-shoulders pattern
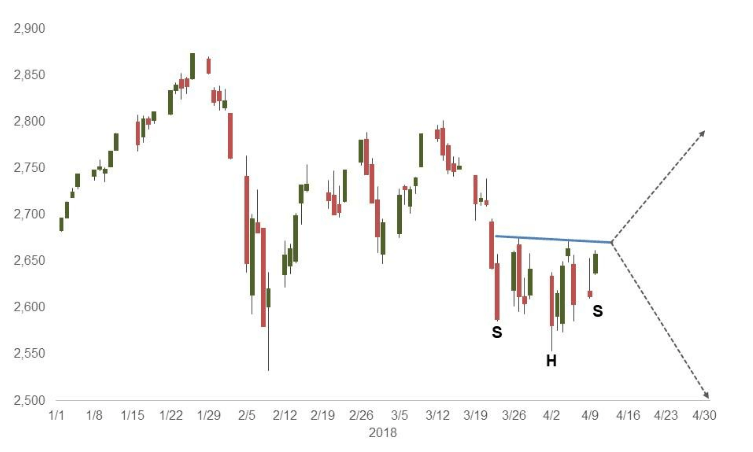
(Source: Yahoo! Finance)
This chart shows a small but classic reverse head-and-shoulders pattern, which suggests that if the market breaks convincingly enough above 2,670 on the S&P 500, we could see a bullish move with some momentum.
But we need to break to new highs, or at least above 2,800, for the bullish case to still be in play, especially after the violent crash from late January into February.
That said, a failure to break just above Tuesday’s highs of 2,662, to say 2,670-plus, would be a bearish sign.
Exhausting!
The number to watch here is 2,670 give or take a bit on the S&P 500.
Possibly most important of all is to make sure you stick to your chosen strategy, be that Cycle 9 Alert, 10X Profits, Triple Play Strategy, Peak Income, Hidden Profits, or Treasury Profits Accelerator.
—
DISCLAIMER: This article expresses my own ideas and opinions. Any information I have shared are from sources that I believe to be reliable and accurate. I did not receive any financial compensation for writing this post, nor do I own any shares in any company I’ve mentioned. I encourage any reader to do their own diligent research first before making any investment decisions.
(Featured image via DepositPhotos)


PayPal’s Slowdown: From Fintech Leader to Low-Growth Dividend Stock
PayPal has shifted from fintech leader to low-growth, value-style stock, losing over 25% in market value and trading at a...


Tilray (TLRY) Falls as Bearish Momentum Persists Despite Marketing Push
Tilray (TLRY) fell 3.32% to $4.44, remaining below key moving averages and signaling continued bearish pressure. Despite a £1 million...


ESG Gap Persists as Firms Struggle to Link Sustainability to Financial Value
KPMG’s Global Survey shows a major gap between ESG awareness and financial integration. While 72% of managers understand sustainability strategies,...


Bitcoin and Ethereum Slide as Market Pressure Builds Amid Strategy Concerns and Layer 2 Disruptions
Bitcoin fell below $60,000 with heavy ETF outflows, pressured by concerns over Strategy’s finances and its STRC stock decline. Ethereum...


AI Venture Builder Launches €600K Crowdfunding Round to Scale Secure AI Solutions
AI Venture Builder, an Italian-British firm developing AI applications and vertical startups, returns to CrowdFundMe with a equity campaign. After...
 |
|
 |  |
 |
|
-

 Biotech2 weeks ago
Advances in Biomarkers and Targeted Therapies Transform Kidney Care in Autoimmune Disease
-

 Impact Investing3 days ago
Coastal Cities Lead as Heat Strains Italy’s Urban Livability
-

 Fintech1 week ago
Trade Republic Brings Back Human Support and Launches Customer Council
-

 Africa5 days ago
Moroccan Bond Market Shows Mixed Signals as Primary Eases and Secondary Pressures Persist
You must be logged in to post a comment Login