Markets
Stock markets fear of new financial crash, US total national debt increases
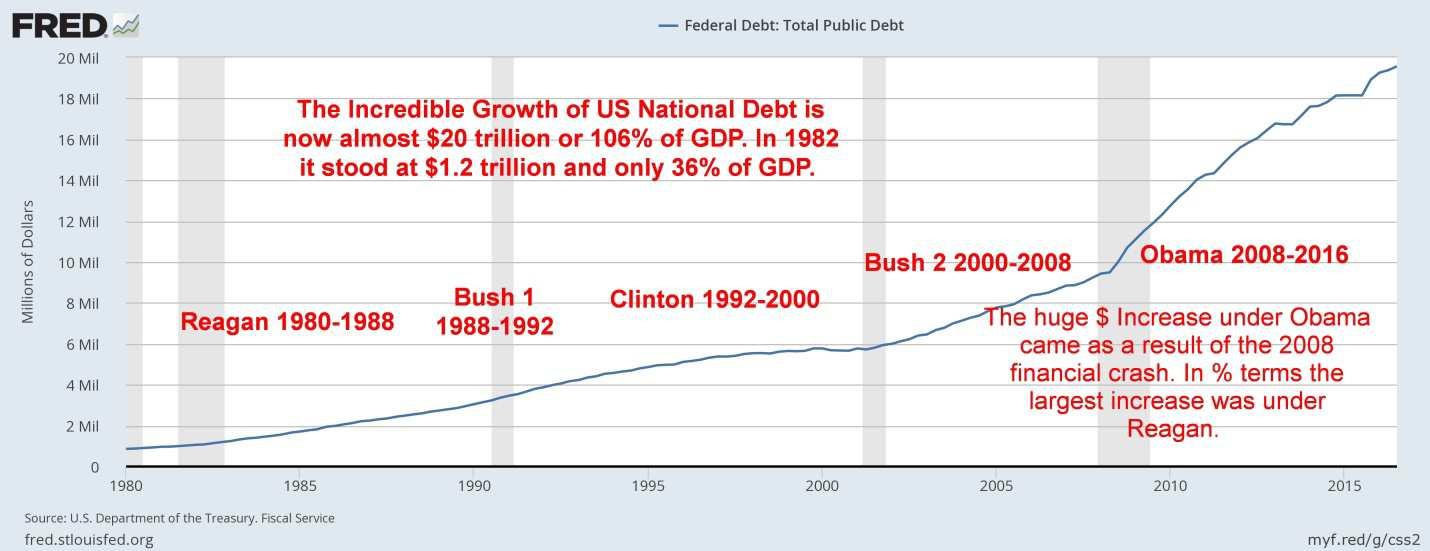
Since the bottom of the 1982 bear market, US national debt has grown from $1.2 trillion to just under $20 trillion today. During the same period, US GDP has grown from $3.3 trillion to $18.9 trillion.

The difference between financial crashes in the past and the feared financial crash that might happen in the present is the U.S. national debt that has grown to just under $20 trillion.
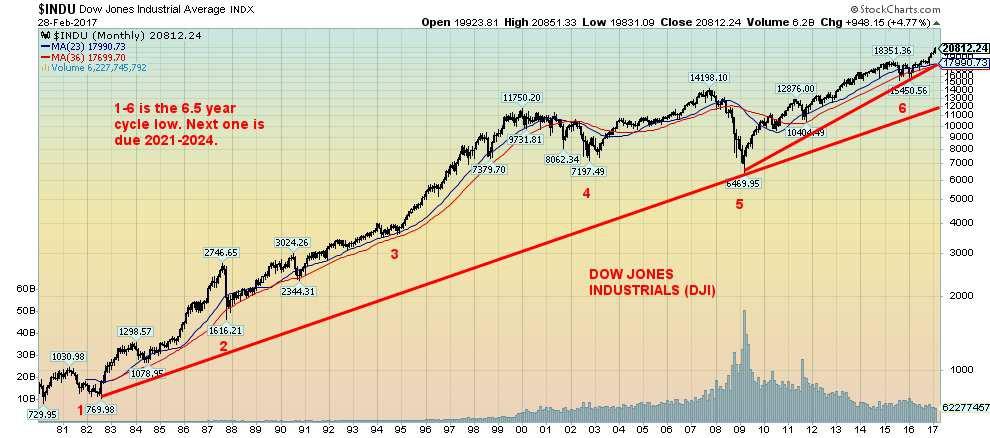
One has to marvel at the current bull market in stocks. The bull market to February 28, 2017, is now 2,913 days long with no correction, exceeding 20%. The bull started with the bear market bottom from the 2007–2009 financial crash on March 9, 2009. The granddaddy of all bull markets was the 1990s when the Dow Jones Industrials ran from October 1990 to the high in January 2000 with only one significant correction in 1998, but even it was just under 20%. That was 3,382 days. Stock markets, despite periodic and even sharp corrections, just seem to go higher and higher.
(Source)
So, is this time different? The stock market crash followed by the Great Depression and war took 25 years before the highs of September 1929 were taken out. The period 1966–1982 (16 years) saw periodic forays towards the 1966 high, but it took until early 1983 before the 1966 high was taken out. Since then, despite the stock market crash of 1987, the recession of the early 1990s, the high-tech/Internet crash of 2000–2002, and the financial crash of 2007-2009 followed by the Great Recession, the stock markets recovered—sometimes with sharp setbacks—and then soared to new highs. This gives true meaning to the adage “don’t worry folks, this is just temporary.”
So what is different this time? In a word: “debt.” Since the bottom of the 1982 bear market, US national debt has grown from $1.2 trillion to just under $20 trillion today. During the same period, US GDP has grown from $3.3 trillion to $18.9 trillion. In other words, it took $18.8 trillion of new national debt to create $15.6 trillion of GDP, a ratio of $1.20 of debt to create $1 of GDP. To put that into perspective, all US debt which includes government, corporate, and consumer debt stood at $5.9 trillion at the end of 1982. Today it stands at $67 trillion, an increase of $61.1 trillion. That translates into $3.90 of new debt to purchase $1 of GDP. It took the US 206 years for everyone to accumulate $5.9 trillion of debt and a mere 35 years to add another $61.1 trillion. No wonder they call debt “easy money.”
(Source)
It is expected that by 2021, according to www.usdebtclock.org, US national debt will have increased to $22.5 trillion and all debt will rise to $75.7 trillion. It took $3.90 of new debt to purchase $1 of GDP for the period 1982 to 2017. Since the financial crash of 2007–2009 and the Great Recession, all debt has grown $12.7 trillion and the national debt has grown $7.7 trillion. GDP has grown $4.5 trillion. It has taken $2.82 to purchase $1 of GDP or $1.70 of new national government debt to purchase $1 of GDP.
What all this suggests is that without more debt participation from corporations and the consumer the odds of the US economy achieving 3% growth as set out by President Trump are low to nil. If debt accumulation had been maintained at $3.90 to buy $1 of GDP then it would most likely have added at least another full point to GDP growth. No wonder GDP growth has been sluggish. Debt is not growing fast enough. Has the consumer tapped out? Bank credit growth is sluggish. Banks are already in the process of tightening credit.
Since the 2007–2009 financial crash followed by the Great Recession the stock markets have been rising based on two things: one, bubble finance from the Federal Reserve—a wave of debt, record low-interest rates and quantitative easing (QE)—and, two, financial engineering from corporate America through leveraged financial deals, stock buybacks and M&A deals. While this has been a boon to Wall Street and the upper 20% of the population the remainder of the population has seen little or no wage growth, a wave of part-time jobs and while consumer debt growth has been sluggish the burden of debt has increased.
On the consumer side, there are potential signs of trouble in the mortgage market once again as interest rates are pressured higher and many mortgages come due over the next year; and, the delinquency rates are rising on automobile and student loans. Since 2009 student loans have soared rising to $1.4 trillion from $771 billion. Automobile loans have grown from $719 billion at the end of 2009 to over $1.1 trillion today. It is interesting to note that the used car index has fallen 6.5% in the past year and a tide of cars is coming off lease agreements in 2017. Car companies have overproduced just as demand is slipping with many cars coming back onto the market.
The Trump rally continues. The rally is driven by the thought that there will be huge tax cuts, massive deregulation, fiscal stimulus with infrastructure, a wall, and build-up of a “winning” military with a $54 billion increase in defense spending. All of this is supposed to “jack” corporate profits. In terms of de- regulation, one of the prime targets is the Dodd-Frank Act an act for Wall Street reform and consumer protection. In Dodd-Frank stress tests in 2016, two out of 33 banks failed the tests, however, many were noted with significant shortfalls. Loosening the regulations could result in a return to pre-2007 conditions that resulted in the financial crash of 2008.
Some of the proposed changes would be paid for by eliminating departments (i.e. EPA) and cutting back on everyone else. Except for the universe that can be cut back is pretty small. Medicare/Medicaid, Social Security, Defense, Income Security, Interest on the debt and pensions cannot really be cut back. That constitutes almost 89% of the entire US budget. It leaves a mere $448 billion from which to cut $54 billion that will go to increased defense spending. An implied 12% cut.
Already congressional representatives and senators are lining up to throw a wrench into that size of a cut. Given the razor-thin majorities in both Congress and the Senate, it won’t take many to switch sides to defeat the notion of massive cuts to programs. And the current spending doesn’t take into account the impact of an infrastructure program estimated at a $1 trillion over 10 years in addition to the increased defense spending. Further tax cuts, as proven in the past particularly under the George W. Bush tax cuts, largely benefit the well-off (Warren Buffet indicated Berkshire Hathaway might benefit to the tune of $27 billion), do little for the broader economy, and add considerably to the debt. Deregulation might be good, but the benefits largely accrue to corporations and banks and don’t necessarily add any jobs for the broader economy.
The President reiterated his agenda in his speech to Congress on February 28, 2017. The Trump rally is predicated on promises that may never happen or that prove difficult to fulfill. And that, in turn, sets up the markets for a major disappointment when reality sets in. The Trump rally is a classic “buy the rumor, sell the news.” Buyers should beware.
—
DISCLAIMER: This article expresses my own ideas and opinions. Any information I have shared are from sources that I believe to be reliable and accurate. I did not receive any financial compensation in writing this post, nor do I own any shares in any company I’ve mentioned. I encourage any reader to do their own diligent research first before making any investment decisions.


Youth Cannabis Use in Colorado Is Falling — But the Full Story Is More Complex
The 2026 Colorado survey shows teen cannabis use fell to 10 percent in 2025, down from 21 percent in 2015....


Morocco’s Growth Holds at 4.6% as Agriculture Offsets Economic Pressures
Morocco’s economy grew 4.6% in Q1 2026, driven by a strong agricultural rebound offsetting declines in industry. Services expanded moderately...


Abivax Shares Surge as New Trial Data Eases Safety Concerns Over Ulcerative Colitis Drug
Abivax shares surged nearly 36% after positive updated trial results for its ulcerative colitis drug obefazimod reassured investors following earlier...


El Dorado Raises $9M to Expand Cross-Border Fintech Platform
El Dorado, a Latin American fintech improving cross-border financial services, raised a $9 million Series A led by Paradigm with...


Bitcoin Stalls Near $60K as Strategy Moves, ETFs Outflow, and EU MiCA Rules Take Effect
Bitcoin hovers near $60,000 with ETF outflows, while Strategy boosts reserves, sells BTC, and raises dividends to reassure investors. Ethereum...
 |
|
 |  |
 |
|
-

 Fintech1 week ago
Mollie Expands Across EEA With €350M Investment to Strengthen European Payments Network
-

 Crowdfunding5 days ago
AI Venture Builder Launches €600K Crowdfunding Round to Scale Secure AI Solutions
-

 Impact Investing2 weeks ago
AI Adoption in Italian Retail Stalls Despite Strong Experimentation
-

 Cannabis1 day ago
Cannabis Dominates Global Drug Use: Trends, Risks, and Shifting Markets
You must be logged in to post a comment Login