Featured
Stock Markets Have Moved into a Correction Mode
The BOE and some others hiked interest rates this past week and the Fed is indicating that two more hikes could be on the way. The BofC is also leaning towards another possible hike. We’ve also noted some declining liquidity as the Fed pulls back. That alone helps take markets lower. Two areas stand out, however. Energy and the metals including gold.

Yes, the stock market can be considered a gambling casino. Not much different than an evening out at Fallsview Casino, Niagara Falls. And, like all casinos, the odds favor the house. You could put your funds under the mattress or you could put it in a bank account that pays interest and just leave it there. The mattress could catch fire and, given inflation, your funds in the bank would lose every year, regardless.
Since 2000, the best return for any investment has been Bitcoin, up 5,958% to June 21, 2023. Except Bitcoin only started in 2014, that market is down 60%–90% from its top, and regulators are poring all over the sector. Setting Bitcoin aside, the best-performing asset has been gold, up 572%. The weakest we looked at was 10-year U.S. treasury notes, up a paltry 18% before the coupon. In between, of course, they all had their ups and downs. One of the wildest rides has been the TSX Venture Exchange (CDNX), dominated by gold and metal mining stocks. The CDNX has had wild rides, sometimes with gains of 200% to over 400%, followed by big downswings of 80% or more. After 23 years, the CDNX is recording a net loss of almost 18%. All this goes to suggest that one has to be standing in the right place at the right time to achieve large gains. The old adage of buy low, sell high. Or, as we sometimes say, buy when nobody wants them, sell when everyone wants them.
Warren Buffet (b: 1930) said much the same thing with his quote “We simply attempt to be fearful when others are greedy and to be greedy only when others are fearful.” Stock markets are constantly going up and down. Since 1900, there have been 40 bull markets with 10% or more gains. There have also been 39 bear markets of 10% or more. The breakdown is as follows:
Gains and Losses Bull and Bear Markets 1900–present
Dow Jones Industrials (DJI)
| Gains (Bull Markets) | Losses (Bear Markets) |
| 100% Plus | 50%–100% | >50% <10% | 30% Plus | 20%–30% | 10%–20% |
| 9 | 18 | 13 | 15 | 11 | 13 |
The biggest single prolonged gain was 344.5%, seen from October 23, 1923, to September 3, 1929—the Roaring Twenties. The biggest single prolonged loss was the 86% drop from April 1930 to July 1932—the Great Depression. It’s the old adage of what goes up fast comes down even faster. Since 2000, the best bull market was 97.9% from March 2020 to January 2022—the Pandemic Bull—and the worst drop was the 53.8% decline seen from October 2007 to March 2009—the Great Recession. Intriguingly, since the world came off the gold standard in August 1971, gold has gained 4,487% vs. the DJI up 3,855%. Seems to pay to hold a little gold in one’s account.
Note that we are referring to physical gold, not the gold stocks. The longest-running gold stock index that we’ve followed is the Philadelphia Gold & Silver Exchange (XAU). It’s up only a paltry 9% since its inception back in 1984. However, Barrick Gold (GOLD) is up almost the equivalent of gold itself, 4,252%. The NASDAQ, with its heavy emphasis on technology stocks, is up 12,882% since 1978 when it started. It all depends on where you are standing when the bull gets underway.
So, where do we stand? One of our long-time favorites is the Kondratieff Wave (also Kondratiev). Nicholas Kondratieff (1892–1938) was a Russian economist tasked by Stalin to do a study on capitalist business cycles. What he came up with was the Kondratieff Wave theory. His theory was that capitalist societies have long-term waves lasting roughly 50–60 years. The cycles include booms, recessions, boom and, depressions. Kondratieff gained worldwide attention. No, not every economist agrees with the theory, nor is it widely followed. Kondratieff, however, made one mistake. He told Stalin the theory applies to the Soviet Union just as it does to capitalist societies. His reward was being sent to Siberia where he died in 1938 at the age of 46. His theory lives on, but as noted, is not necessarily widely accepted.
Our table below summarizes the Kondratieff Waves since 1784 on a generally-accepted basis. So far, there have been four long cycles:
First cycle (1784–1844) – 60 years
Second cycle (1844–1896) – 52 years
Third cycle (1896–1949) – 53 years
Fourth cycle (1949–2009) – 60 years
Fifth Cycle 2009-?
Kondratieff Wave 1784–2023
| Spring (Expansion) Stocks | Summer (Recession) Commodities | Autumn (Plateau) Stocks | Winter (Depression) Commodities |
| 1784–1800 (American Revolution) | 1800–1816 (War of 1812) | 1816–1835 (Era of Good Feelings) | 1835–1844 (Indian Wars) |
| 1845–1858 (Mexican-American War) | 1859–1864 (Civil War) | 1864–1874 (Reconstruction) | 1875–1896 (Indian Wars) |
| 1896–1907 (Spanish-American War) | 1907–1920 (WWI) | 1920–1929 (Roaring 20s) | 1929–1949 (WWII) |
| 1949–1966 (Korean War) | 1966–1982 (Vietnam War) | 1982–2000 (The New Economy) | 2000–2009 (War on Terror) |
| 2009–2022 (Pandemic) | 2022–? |
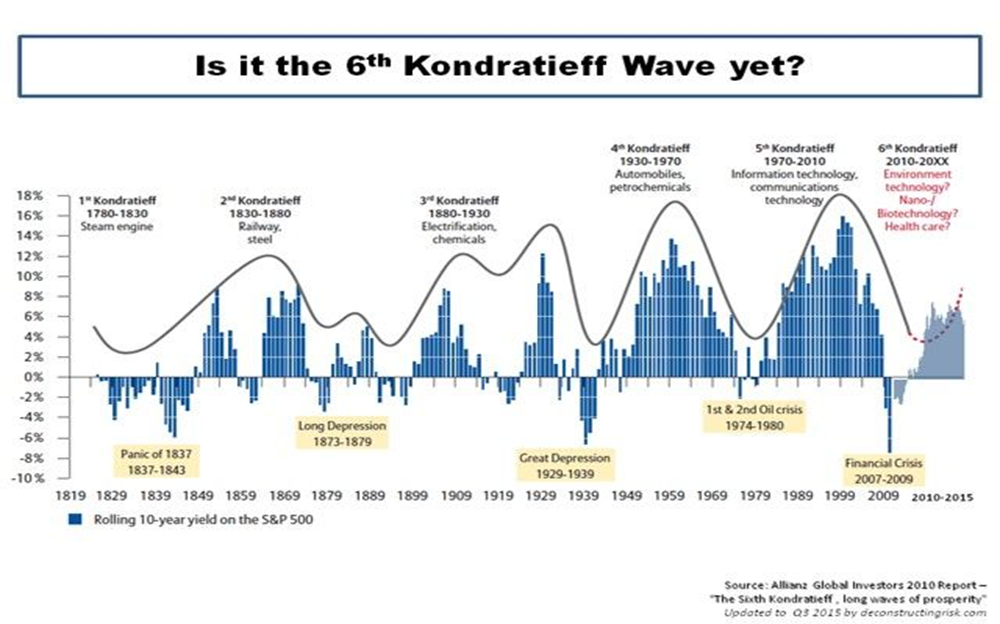
We have noted in the chart above the best-performing asset during each phase of the Kondratieff cycle. Another way of looking at the Kondratieff Waves is as technology cycles. This hypothesizes that we are currently working on the sixth Kondratieff Wave. (Chart follows on next page).
The chart is based on the rolling 10-year yield of the S&P 500. Its lows line up nicely with either the summer or winter Kondratieff Wave in our table. It only goes to 2015, but we have not as yet hit the skids for a low to the cycle. Note how inventions drove the bull markets. From steam engines to railways and steel to electrification and chemicals, to automobiles and petrochemicals, to information and communication technology, to the current one of environment technology, nanotechnology, biotechnology, and AI technology. Just because we are on the cusp of a huge AI wave doesn’t mean we escape the cycles. Current challenges of war (Ukraine), climate change, and the end of a long period of expansion and ultra-low interest rates, and easy money are now impacting the market.
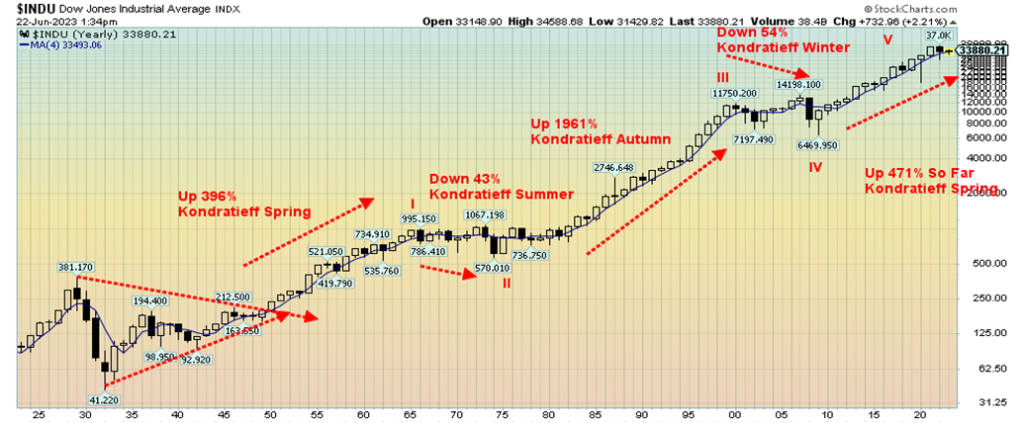
We also provide a 100-year chart of the Dow Jones Industrials (DJI) on a yearly basis and have marked off the Kondratieff Waves, as noted in the table. Note the five-wave advance from the Great Depression low of 1949.
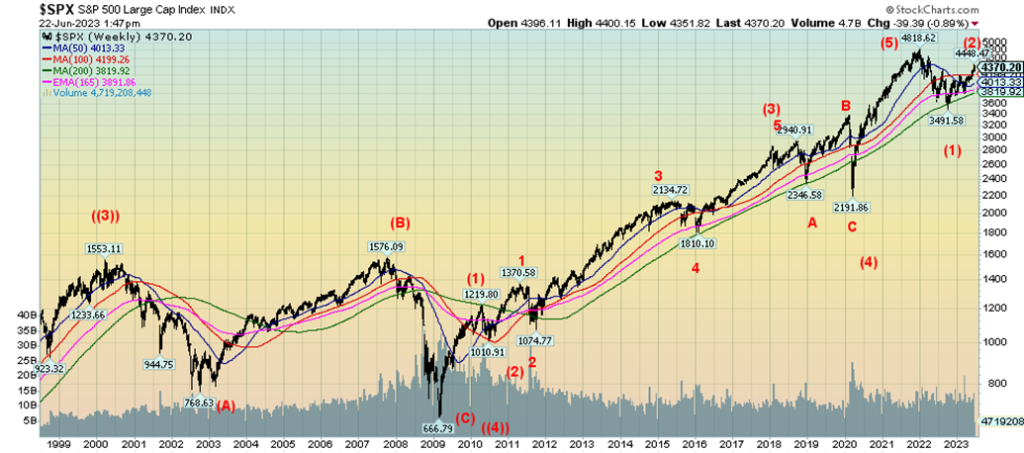
Our next chart takes a closer look at the waves since that important top of January/March 2000. That proved to be the top of wave III, noted above. Note how the wave from March 2009 to the top in January 2022 unfolded in five waves. This was an impulse wave to the upside. A key correction came on wave (4) that included the pandemic crash as the culmination. The B wave was above the top of wave (3), leading many to believe we were in a new bull market. Since topping in January 2022, the market fell in five waves down (an impulse wave) that bottomed in October 2022. That is marked as wave (1). We are now on wave (2) up. Could it end in a melt-up? Absolutely. As our chart of the week notes, the S&P 500 has potential targets up to 4,800 and a top equal to or possibly higher than the top of January 2022.
S&P 500 1999–2023
In what was considered a surprise move, the Bank of England (BOE) hiked its key bank rate on June 22 to 5%, an up move of 50 bp. The market hadn’t expected that. Predictably, stock markets wobbled. U.K. inflation was last at 7.1%, so the reality is that the BOE remains behind the curve. By comparison, the U.S. Fed rate is 5.00%–5.25% with an inflation rate last reported at 4%. The Fed is already above the rate of inflation. The ECB remains behind the curve as well, with a bank rate recently raised to 4% but an inflation rate of 6.1%. Still, the BOE hike started speculation that the Fed will hike at its next two meetings. Canada entered the conversation as well with speculation that they too could hike rates at their next meeting. Canada’s bank rate (BofC) is currently 4.75% with an inflation rate last at 4.4%.
The U.S. job market remains surprisingly resilient, even as the weekly claims have crept up from roughly 200,000/week to 260,000/week. Retail sales remain okay and not all manufacturing indices are flashing negative. That said, today’s economy is service-oriented rather than manufacturing- or agriculture-oriented. A service economy tends to be somewhat more resilient. There is no sign yet of a recession, even as Germany has fallen into an official recession, the U.K. is not far behind, and the EU wobbles. The next U.S. jobs report is not due out until Friday, July 7.
Interest rates have been hiked, but while the economy is showing signs of slowing down, there are a few signs that we are poised to fall into a recession. It is clearly possible to have a slowdown and not an official recession. A black swan event could knock everything off its bearings, but we’ve had no black swan events since the pandemic of March 2020. While the Russian invasion of Ukraine could be considered a black swan, the buildup was there, so in some respects, it wasn’t a surprise.
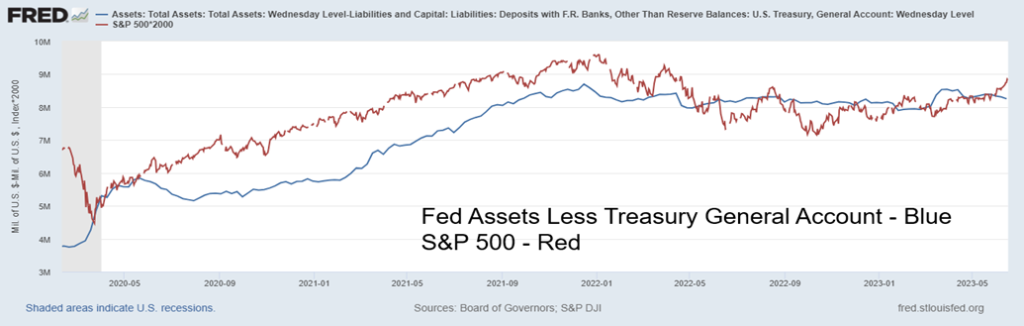
The Fed is continuing with quantitative tightening (QT). Our final chart is interesting in that it shows the Fed’s balance sheet less treasury deposits of Federal Reserve Banks and it is compared with the S&P 500. The Fed’s balance sheet less deposits peaked back in December 2021 and the stock market peaked in January 2022. This chart was seen at MarketWatch (www.marketwatch.com), courtesy of Chief Economist Torsten Slok of Apollo Global Management (www.apollo.com). Before that, both the Fed’s balance sheet less treasury deposits and the S&P 500 had been rising together. Since then, except for blips, the Fed balance sheet less Treasury General Account deposits has been falling. All that has coincided with the S&P 500 falling. An upward blip in the Fed’s balance sheet less deposits got underway in March 2023, which has coincided with a run-up in the S&P 500. But now we note that the Fed’s balance sheet less deposits has turned down again. Liquidity is what makes the markets go up. And, right now, that liquidity appears to be being sucked out once again.
S&P 500 vs. Fed Balance Sheet less Treasury General Account 2020–2023
The Kondratieff Wave chart shows that the Kondratieff summer can last on average 12.5 years with a range from 5 to 16 years. Commodities tend to do well during the Kondratieff summer, but the real up-move for commodities, including gold, could occur at the end of the cycle, not at the beginning. As well, the stock market in a bear market doesn’t just go down. A down period such as we saw from January 2022 to October 2022 can be followed by a strong up period as we are currently witnessing.
The late 1960s and 1970s are a classic example. During that period, we saw seven bears with losses ranging from 16.1% to 45.1% and six bulls with gains ranging from 22.3% to 75.7%. Overall, however, the stock market went nowhere. From the top in 1966 to the final low in 1982, overall, the DJI lost 21.1%, but in between it was wild ride. On an inflation-adjusted basis, the loss was more dramatic, down 73%. Commodities, however, soared during the Kondratieff summer, especially oil and gold. Oil was up 1,063% while gold gained 935% in the same period. The Kondratieff summer is a tricky period with many twists and turns. One just needs to be standing in the right place at the right time.
Chart of the Week
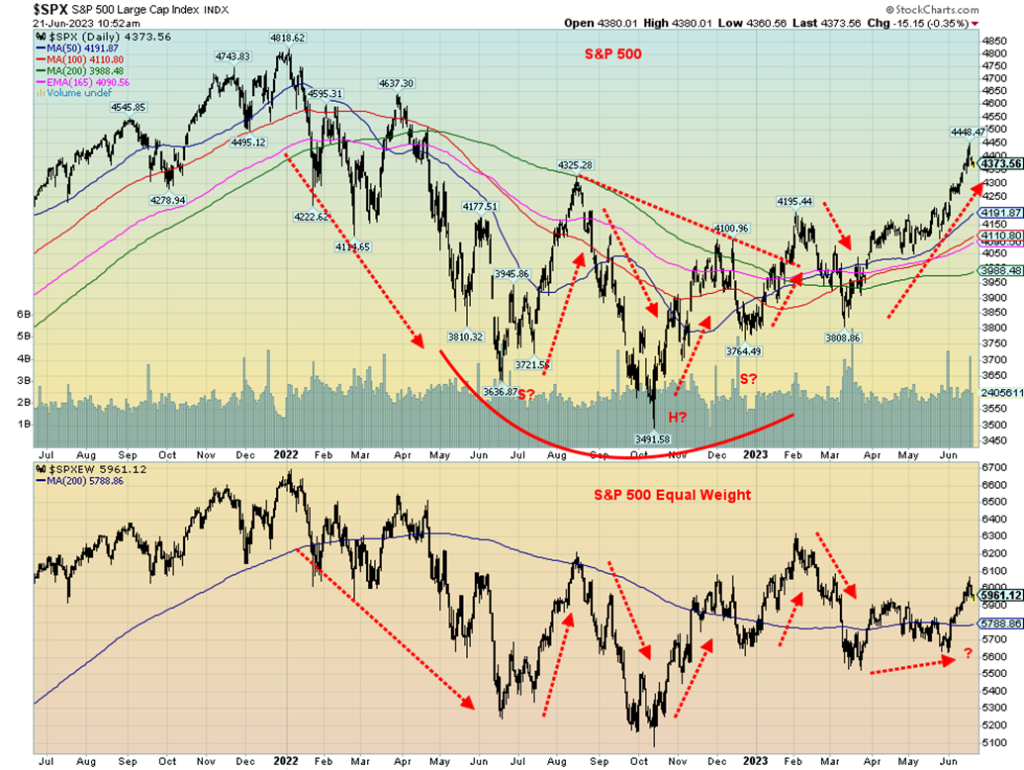
We don’t believe we’ve ever seen the S&P 500 (SPX) and the S&P 500 Equal Weight Index (SPXEW) diverge from each other the way they have for the past three months. Since that March 2023 low, the SPX is up about 15% while the SPXEW is only up about 8%. Doesn’t seem like much, but that decline from the high in January 2022 to the low in October 2022 saw the SPX lose 27.5% while the SPXEW fell 24.1%. Not a lot of difference. From that October 2022 low, the SPX has gained over 25% while SPXEW is up 17%. In 2023 to date, the SPX is up over 13% while the SPXEW is up only 2.5%.
The expectation is that, while we would expect the SPX to outperform both the upside and downside, the divergence between the two is not usually as wide as we are seeing today. The reason why SPX is outperforming is quite simple as effectively eight stocks are dragging the S&P 500 index higher: Meta (Facebook), Amazon, Apple, Netflix, Alphabet (Google), Microsoft, Nvidia, and Tesla. Together, they comprise some 27% of SPX. SPX is a market-weighted cap while SPXEW is an equal-weight index of 0.2% for each stock. People’s portfolios normally look more like the SPXEW than the SPX, and the result is they would be considered to be underperforming. Portfolio managers’ weightings in portfolios tend to mimic the SPXEW more than the SPX. It is believed to attain better balance.
One study had seven of these eight high-tech companies contributing 84% of SPX’s return to June 7, 2023. Taking these companies out of the equation, the SPX would be up only about 1.9% vs. the 13% the SPX is actually up. No one, it seems, would be talking about the great new bull market.
None of this precludes the indices from going even higher. That head and shoulders pattern that appeared to form on the SPX in the latter half of 2022 suggests a possible target of around 4,800. Right back at the highs of 2022. For SPXEW, a similar pattern suggests a target of around 7,100. If that’s correct, both have a lot of work to reach those targets, but it’s not impossible. After all, the market can keep going higher longer than the shorts can stay solvent.
Irrespective of this, the market has taken notice and the great new bull market is being hailed. We even have the headline as shown on the front page of Barron’s back on June 12 (see the next page). It appears to be the new view. These headlines, however, are often associated with tops in the market. However, again, none of this precludes the market from going higher first. The S&P 500 is up 25% from that October 2022 low; however, the Dow Jones Industrials (DJI) is up only 18%. Another divergence? The NASDAQ is the best of all, up 34% led by the NY FANG Index up 85%. The reality is, unless one has these high-tech stocks in their portfolio they are most likely underperforming.
In 1996, former Fed Chairman Alan Greenspan coined the phrase “irrational exuberance” when referring to the budding stock market bubble. At that time, the NASDAQ was around 1,300. It didn’t top until March 2000 at over 5,000. Rather than pay attention to the ramblings of the Fed Chairman, the market, it seems, was just getting underway for real “irrational exuberance.”
Is the 2023 Bull just really getting underway? Or is this the classic bear market rally—or, as some even call it, a “sucker’s rally”? We’ve seen famous bear market rallies in the past. November 1929–April 1930, March 1938–November 1938, November 1971–January 1973, September 2001–March 2002, and probably the best and longest one of all: October 2002–October 2007. Some would even refer to the latter bull as a legitimate bull market, even though the SPX only went back to the highs of March 2000. But after those bear market rallies topped, they fell: respectively 86%, 41%, 45%, 32%, and 54% (all for DJI). The trend is up, until it isn’t.
Barron’s Cover on June 12, 2023

Markets & Trends
| % Gains (Losses) Trends | ||||||||
| Close Dec 31/22 | Close Jun 23, 2023 | Week | YTD | Daily (Short Term) | Weekly (Intermediate) | Monthly (Long Term) | ||
| Stock Market Indices | ||||||||
| S&P 500 | 3,839.50 | 4,348.33 | (1.4)% | 13.3% | up | up | up | |
| Dow Jones Industrials | 33,147.25 | 33,727.33 | (1.7)% | 1.8% | up (weak) | up | up | |
| Dow Jones Transport | 13,391.91 | 14,687.87 | (0.7)% | 9.7% | up | up | up (weak) | |
| NASDAQ | 10,466.48 | 13,492.52 | (1.4)% | 28.9% | up | up | up (weak) | |
| S&P/TSX Composite | 19,384.92 | 19,418.23 | (2.8)% | 0.2% | down | down (weak) | up (weak) | |
| S&P/TSX Venture (CDNX) | 570.27 | 598.74 | (2.5)% | 5.0% | down | neutral | down | |
| S&P 600 (small) | 1,157.53 | 1,166.32 | (3.2)% | 0.8% | up (weak) | neutral | neutral | |
| MSCI World | 1,977.74 | 2,140.99 | (1.6)% | 8.3% | neutral | up (weak) | up (weak) | |
| Bitcoin | 16,535.23 | 30,150.70 | 18.8% | 82.3% | up | up | neutral | |
| Gold Mining Stock Indices | ||||||||
| Gold Bugs Index (HUI) | 229.75 | 231.54 | (4.8)% | 0.8% | down | neutral | down (weak) | |
| TSX Gold Index (TGD) | 277.68 | 274.29 | (4.4)% | (1.2)% | down | neutral | down (weak) | |
| % | ||||||||
| U.S. 10-Year Treasury Bond yield | 3.88% | 3.74% | (0.8)% | (3.6)% | ||||
| Cdn. 10-Year Bond CGB yield | 3.29% | 3.36% | flat | 2.1% | ||||
| Recession Watch Spreads | ||||||||
| U.S. 2-year 10-year Treasury spread | (0.55)% | (1.01)% (new lows) | (6.3)% | (83.6)% | ||||
| Cdn 2-year 10-year CGB spread | (0.76)% | (1.32)% (new lows) | (9.1)% | (73.7)% | ||||
| Currencies | ||||||||
| US$ Index | 103.27 | 102.54 | 0.7% | (0.7)% | neutral | down | up | |
| Canadian $ | 73.92 | 75.91 | (0.1)% | 2.7% | up | up | down (weak) | |
| Euro | 107.04 | 108.93 | (0.4)% | 1.8% | neutral | up (weak) | down (weak) | |
| Swiss Franc | 108.15 | 111.48 | (0.3)% | 3.1% | up (weak) | up | up | |
| British Pound | 120.96 | 127.17 | (0.9)% | 5.1% | up | up | neutral | |
| Japanese Yen | 76.27 | 69.566 | (1.3)% | (8.8)% | down | down | down | |
| Precious Metals | ||||||||
| Gold | 1,826.20 | 1,929.60 | (2.9)% | 5.7% | down | up (weak) | up | |
| Silver | 24.04 | 22.35 | (7.4)% | (7.0)% | down | down | neutral | |
| Platinum | 1,082.90 | 923.70 | (6.4)% | (14.7)% | down | down | neutral | |
| Base Metals | ||||||||
| Palladium | 1,798.00 | 1,279.00 | (9.7)% | (28.9)% | down | down | down | |
| Copper | 3.81 | 3.80 | (2.2)% | (0.2)% | up (weak) | neutral | neutral | |
| Energy | ||||||||
| WTI Oil | 80.26 | 69.16 | (3.9)% | (13.8)% | down | down | neutral | |
| Nat Gas | 4.48 | 2.84 | 8.0% | (36.6)% | up | down (weak) | down | |
New highs/lows refer to new 52-week highs/lows and, in some cases, all-time highs.
Last week’s reversal day did get follow-through this week as the indices fell. For the week it was a sea of red ink (mostly). The S&P 500 was down 1.4%, the Dow Jones Industrials (DJI) was off more, down 1.7%, the Dow Jones Transportations (DJT) fell only 0.7%, and the NASDAQ lost 1.4%. The smaller cap indices were hit harder with the S&P 400 (Mid) down 2.5% and the S&P 600 (Small) off 3.2%. If breadth is to improve, it is these indices that must lead the way. The NY FANG Index fell 1.1%.
In Canada, the TSX Composite fell 2.8% and is now barely up on the year, only 0.2%. The TSX Venture Exchange (CDNX) fell 2.5%. In the EU, the London FTSE fell 2.3%, the EuroNext was down 3.0%, the Paris CAC 40 dropped 3.1%, and the German DAX was off 3.2%. Recession in Germany and threatening recessions in the U.K. and the EU helped push the European indices lower. In Asia, China’s Shanghai Index (SSEC) dropped 2.3%, the Tokyo Nikkei Dow (TKN) finally fell, off 2.7%, after making fresh 52-week highs, while Hong Kong’s Hang Seng (HSI) fell 5.7%.
Is Bitcoin the new gold? Hardly, as regulators are scouring the crypto market. However, Bitcoin leaped 18.8% this past week and was the only real winner on a week that saw mostly red ink. Bitcoin is now back over $30,000.
This is just a developing story, but there was a potential coup going on in Russia. As of the moment, it appears to have gone nowhere. Irrespective, if a coup happened in Russia it could shake markets globally.
While Europe is stressed by war and Germany has fallen into recession, the U.S. economy continues to hum along. Recession, what recession? Some are now expecting only a shallow recession or no recession at all. There remain lots of job openings and the job market has been strong. The FAANGs have shed some 50,000 people and their stocks have gone higher. The manufacturing sector is weaker, but the U.S. is largely a services economy and that remains strong. There are problems in the commercial real estate market, but no major bankruptcies. Housing prices have stabilized and have started to rise again. The SPDR S&P homebuilders ETF (XHB) is up some 28% so far in 2023. That is happening in Canada as well. The markets fell this past week, but it’s only one week. The yield curve is horribly inverted at record levels, but we have no sign of a recession. Consumer confidence is also at or near lows seen in 2008 during the Great Recession and the early 1980s recession. That said, the consumer keeps on buying as retail sales remain good, fuelled by a rise in consumer debt. AI is a coming big thing and the biggest worry is whether AI could take over humans.
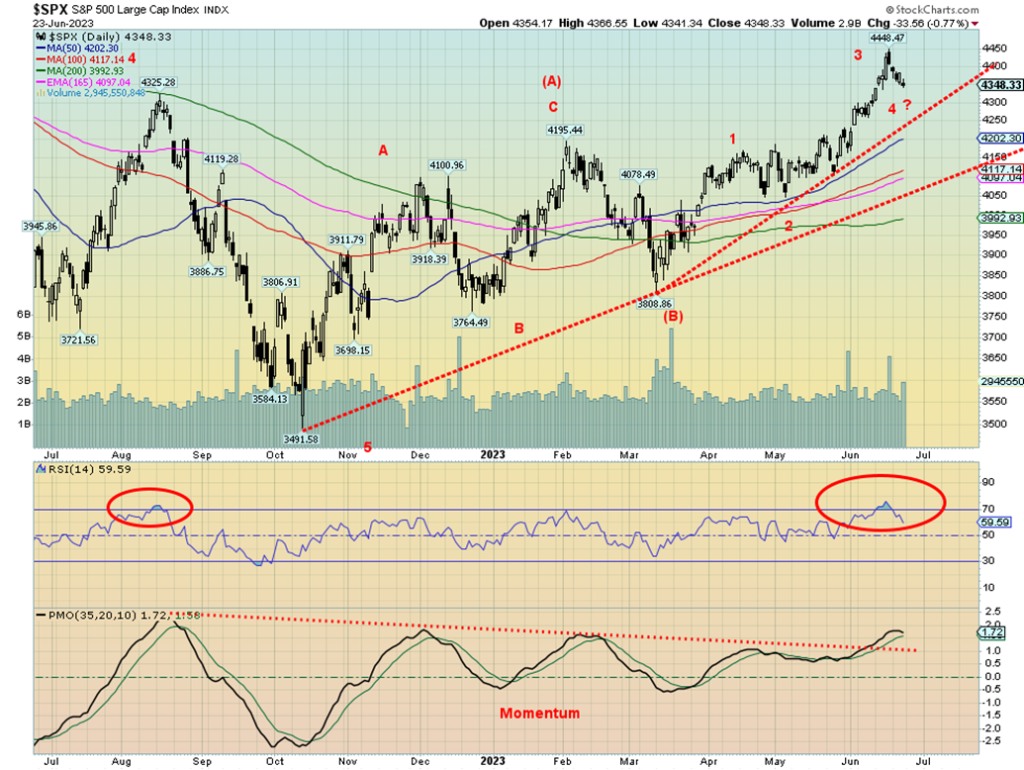
The biggest problem we see is the huge divergence between the S&P 500 and NASDAQ with other indices. They power higher but the others lag. We noted that in our chart of the week. The momentum indicator we keep showing on the S&P 500 finally broke out, suggesting this market could go higher still. Unless it’s a false breakout. The RSI has come down off its overbought levels and the momentum indicator is threatening to turn back down.
Support is down to 4,300 but if that breaks, then we begin to confirm at least a temporary top. We don’t have any major breakdown unless we fall under 4,100 and especially under 3,900. As we noted in our chart of the week, we have potential targets for the S&P 500 up to 4,800. That would equal the high seen last January 2022 if achieved. Trends remain up. The DJI has been the weakest index, up only 1.8% in 2023 vs. 13.3% for the S&P 500.
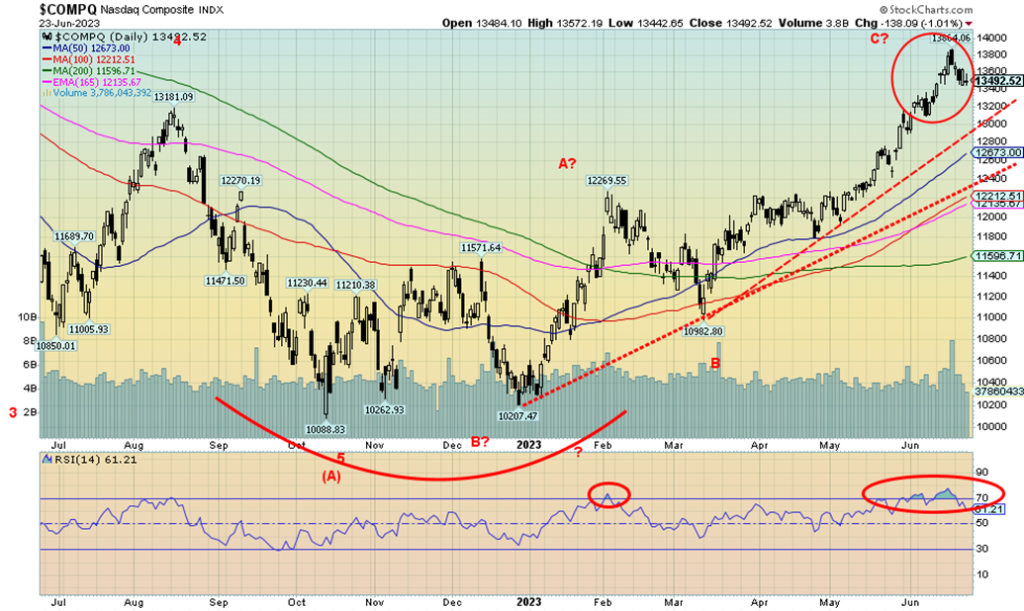
The NASDAQ wavered this past week, falling 1.4%. That reversal seen late last week did get downside follow-through this week. The NASDAQ did better than the other indices, primarily because some of the FAANGs continued to do well and even made new highs once again. Making new highs were Meta, Apple, and, Amazon. Nvidia and Tesla. However, both Tesla and Nvidia reversed and closed down on the week, with Nvidia losing 1.1% and Tesla down 1.6%. The NY FANG Index was down 1.2%. The big FAANG losers were Alibaba, down 7.8% and Advanced Micro, down 8.4%. The NASDAQ has good support down to 13,000, but below that a top may be in. Next good support is down at 12,400. Unless we are getting a spike top in the NASDAQ, we see no topping pattern. Ergo, why those support levels are important if they were to fall. There were no significant divergences at the recent top for indicators, suggesting that this is just a pullback and not a major top. The FAANGs continue to do well and there still could be a melt-up.
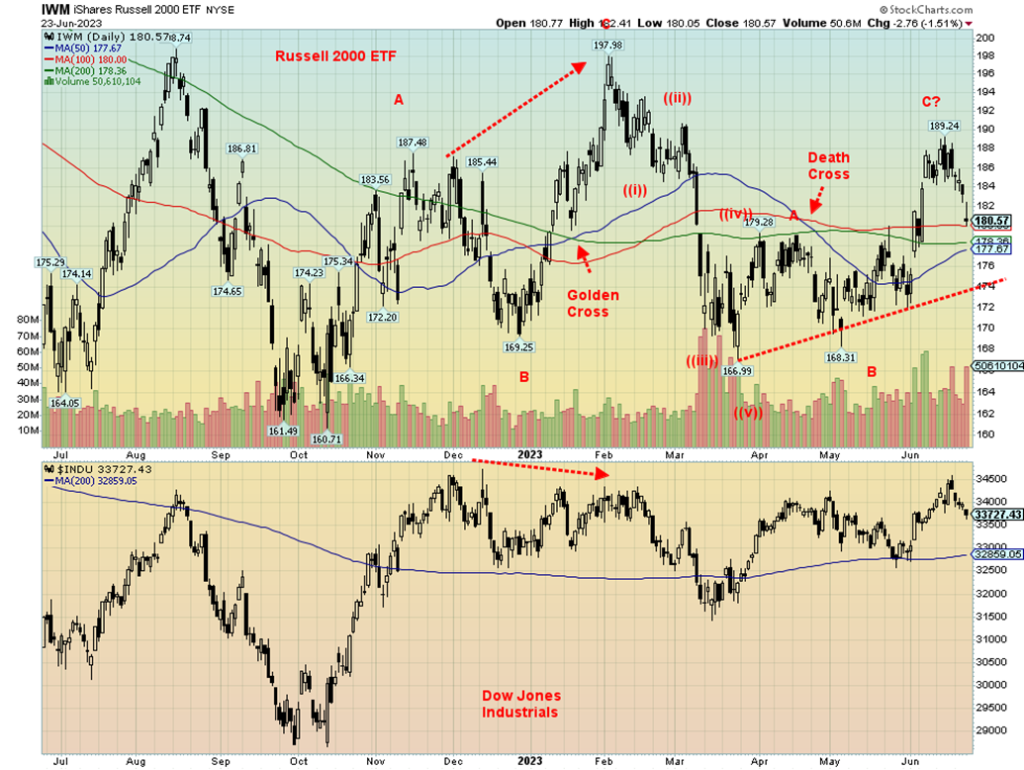
Here are the Russell 2000 ETF and the Dow Jones Industrials (DJI). Small cap vs. large cap. The picture is very similar. Both have struggled to rise in 2023, unlike the tech-heavy NASDAQ and S&P 500. The Russell 2000 is up 4.2% so far in 2023 vs. the DJI up 1.8%. That’s not too unlike the TSX Composite, up 0.2%, vs. the TSX Venture Exchange (CDNX), up 5.0%. The TSX 60, which is the TSX’s large-cap index, is barely up, by our calculation 0.01%. Hard to believe but, yes, the TSX 60 is underperforming the broader TSX Composite. Regardless, all this shows the lack of breadth in the market. The S&P 500 is up 13.3% while the NASDAQ is up 28.9%. Somebody forgot to tell these other indices. Or maybe they just don’t have Nvidia, Tesla, and Meta in their index. Answer: they don’t.
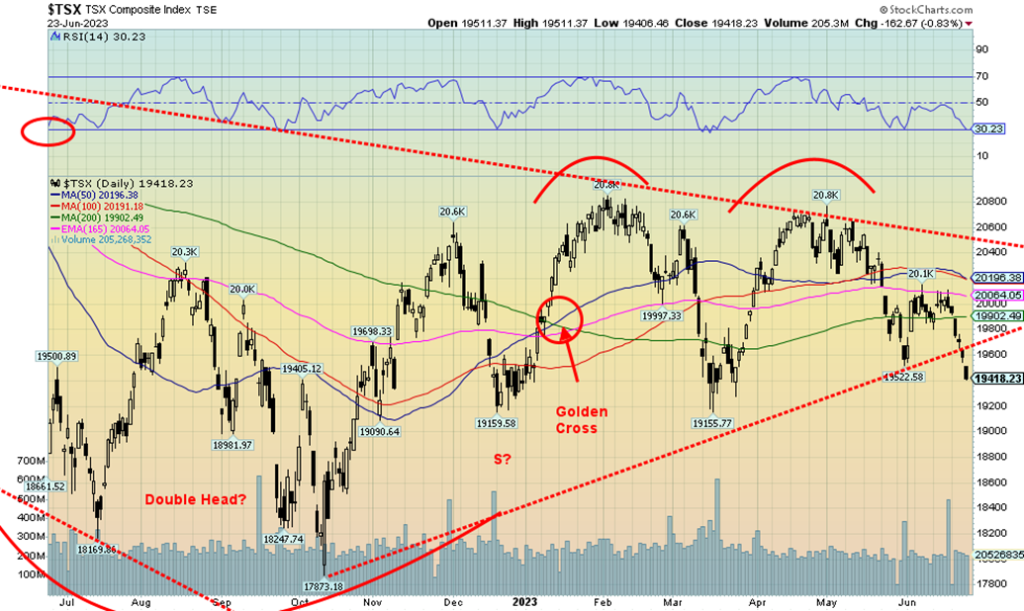
Is the TSX breaking down? The TSX this past week broke the uptrend line from the October lows and also broke the most recent daily low at 19,522. The only good news is that with the RSI now at 30 it is approaching oversold. The TSX has been underperforming the U.S. indices. On the week, the TSX fell 2.8% and is now clinging to a small 0.2% gain in 2023. The TSX Venture Exchange (CDNX) also fell down 2.5% but remains up about 5.0% on the year. It was a miserable week all around as not one TSX sub-index had an up week. All down. The biggest loser was Metals & Mining (TGM), down 5.1%. Other losers over 4% were Golds (TGD), down 4.4%, and Materials (TMT), down 4.5%. The largest component, Financials (TFS) fell 3.5% while the second largest component, Energy (TEN) was off by 3.6%. Definitely a miserable week. Next up for the TSX is the March low around 19,155. We are under the 200-day MA, another sell signal. The golden cross hasn’t happened yet, but the 50-day is threatening to cross the 100-day. Resistance is now going to be seen at 19,700 and 19,900, the 200-day MA. A buy signal would be seen only if we regained back above 20,000. The chart appears quite negative and a possible double top could project down to 17,500 a further drop of 10%. Interest rate sectors such as Financials (TFS), Real Estate (TRE), Telecommunications (TTS), Utilities (TUT), and Income Trusts (TCM) look particularly vulnerable. Consumer Discretionary (TCD) had a big down week, off 3.2% after making new highs the previous week. Not a good sign. If there was a winner this past week, it’s Consumer Staples (TCS), which fell only 0.5%. Nothing looks particularly good right now, although Energy (TEN) keeps appearing to form a low.
U.S. 10-year Treasury Bond/Canadian 10-year Government Bond (CGB)
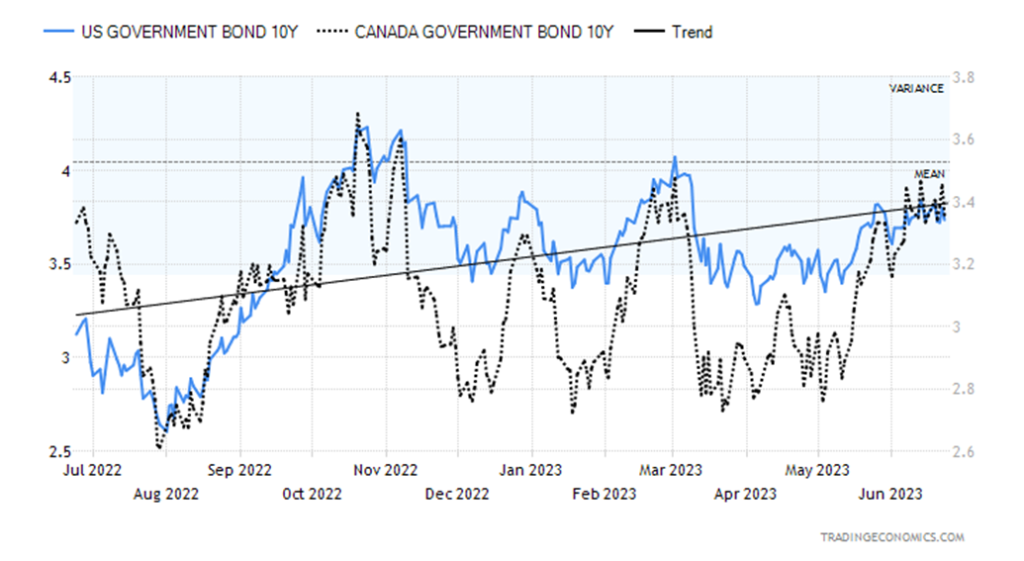
Despite interest rates hikes by the BOE and the ECB, U.S. bond rates were steady this past week. The 10-year U.S. treasury fell slightly to 3.74% from 3.77%. The Canadian 10-year Government Bond (CGB) was unchanged at 3.36%. But what widened was the 2–10 spread and 3-month–10-year spread. The U.S. 2–10 spread widened to 101 bp from 95 bp while the 3m–10 spread rose to 167 bp from 157 bp. The reason the spreads widened was Fed Chair’s oblique reference to potentially two more rate hikes. The result was that short rates rose while the longer rates slipped slightly, based on recession concerns. In Canada, the 2–10 spread widened to 132 bp from 121 bp. There were hints that the BofC might hike rates further as well.
There were not a lot of numbers this past week. However, housing numbers continued to strengthen as building permits, existing home sales, and housing starts all came in stronger than expected. The only down note was the weekly claims that came in at 264,000 when they expected 260,000. Not a barn burner, for sure. The manufacturing PMI came in at 46.3, below the expected 48.5, but the services PMI was 54.1, slightly better than the expected 54. Manufacturing is weakening and suggesting recession. A reading under 50 is considered recessionary. The U.S. economy is primarily a services economy and that continues to show strength. This coming week we get home prices and new home sales. On Thursday, Fed Chair Jerome Powell speaks again. Friday could be the big day with the GDP Q1 final. The market is expecting a dip to 1.4% from the previous 2.6%. Canada reports its inflation numbers on Tuesday.
We still have in place a potential descending triangle for the 10-year. A break of 3.35% could start a decline.
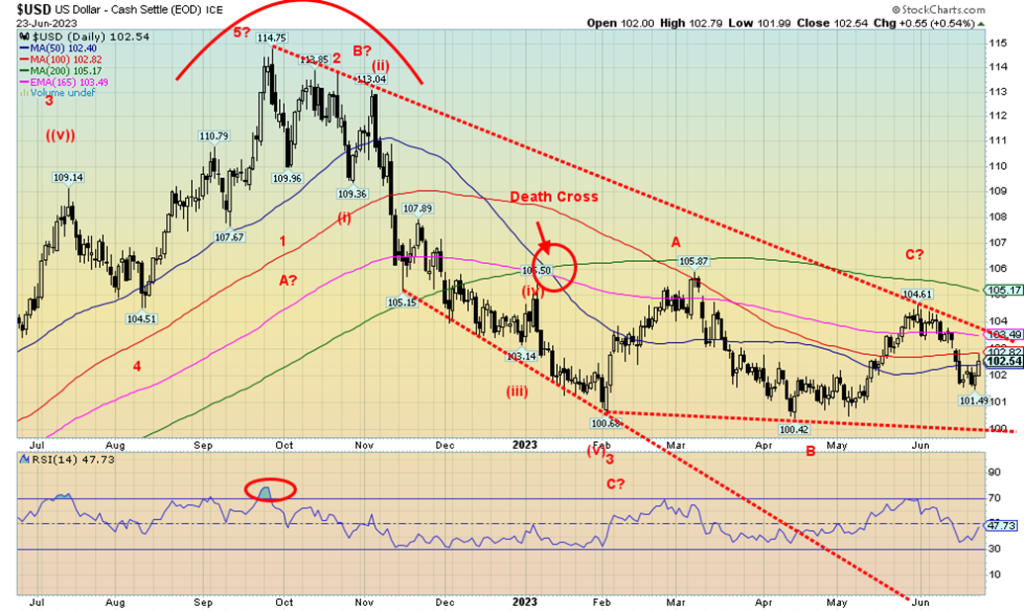
The US$ Index rebounded this past week with a gain of 0.7%. Currencies fell. The euro was down 0.4%, the Swiss franc fell 0.3%, the pound sterling was off 0.9%, while the Japanese yen continued its decent, falling 1.3%. The Canadian dollar was almost steady, down only 0.1%. There is nothing conclusive about this week’s rebound. The breakout point is at 103.50 while major support can be seen down to 100. The recent high at 104.61 appears to be a good top. If this is, as we suspect, an ABC-type correction, it is what we call a failed C wave, so far at least. It is possible that this is an ABCDE correction and this is the D wave with an E wave to come that could still pull the US$ Index up to the 200-day MA near 105. The U.S. dollar is benefitting somewhat by the U.S.’s stronger economy, compared to the EU, the UK, and Japan. Trouble in Russia could also spark a run to safety in the U.S. dollar. New lows below 101.50 would allow the recent decline to resume heading towards 100.
Gold took it on the chin this past week, falling 2.1%. Silver was whipped, losing 7.4%. Platinum didn’t fare much better, down 6.4%. Meanwhile, palladium was killed, off 9.7%, while copper dropped as well, down 2.2%. The gold stock indices fell as well with the Gold Bugs Index (HUI) down 4.8% and the TSX Gold Index (TGD) off 4.4%. Not a pleasant week for the PMs.
One could blame it on the rise in the US$ Index. But it was up only 0.7%. Fear of higher interest rates didn’t help as the BOE hiked 50 bp and needs more hikes just to catch up to inflation. Others raised rates as well in Switzerland, Norway, and Turkey. Powell talked obliquely about two more rate hikes. Gold does not like higher interest rates. At least gold is still up on the year by 5.7%. Silver is down 7% and platinum is down 14.7%. Palladium is getting killed to offset the great up move last year, down 28.9%, while copper is off only 0.2% in 2023.
Some manufacturing indices continue to weaken, but then the U.S. economy is largely a service-oriented economy. GDP for Q2 is running around 2%. Recession? What recession? GDP numbers are reported later this coming week. The market is focused on AI stocks, not gold and gold stocks. Talks of digital currencies abound. Who needs gold when you have blips on the screen? They could even make them a gold colour. The only hope is the severely inverted yield curve that continues to point to a recession. But will it be just a shallow one? Some even believe there won’t be a recession.
On a positive note, we picked up a report from Ted Butler of Butler Research (www.butlerresearch.com). Ted Butler is a well-known PM commentator. Butler outlined that the recent reports from the Office of Comptroller of the Currency (OCC) noted that PM derivative positions with JP Morgan Chase and Bank of America have soared. Are they expecting something? The full report can be found at https://silverseek.com/article/another-stunning-occ-report-1.
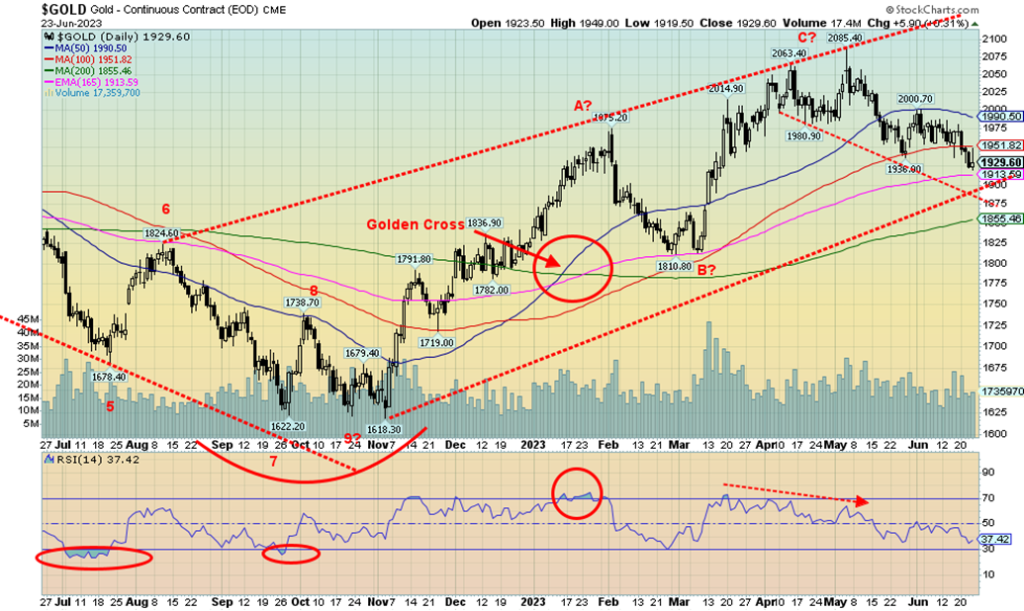
The commercial COT for gold was steady last week, so the best we can interpret that is the COT is neutral. Gold hit a low of $1,920 for August futures this past week. The swing-down target for gold appears to be $1,875. Will we get there? That’s the bottom of that downward-sloping channel. The 200-day MA is down at $1,855, providing another layer of long-term support. The short-term trend has turned down and the intermediate trend is weak. The long-term trend remains up.
A rebound could occur this coming week. Who knows at this point in time of writing what the possible coup, non-coup attempt in Russia might bring? Geopolitical trouble can often be positive for gold. The reality is we need to regain and break out above $2,000 to suggest that a low is in. Talk of a big bull run in gold is just to talk by the gold bugs who always talk positively. We need evidence and only new highs above $2,100 might give us that. We continue to look for evidence of our 7.83-year and 23.5-year cycle lows. We are not convinced they are in. However, we expect them by the end of the year.
Given the current oversold conditions in the PM market and rising bearish sentiment, we are looking for a temporary low either this coming week or the first week of July. It could then be the start of a summer rebound. Then we expect more trouble in the fall.
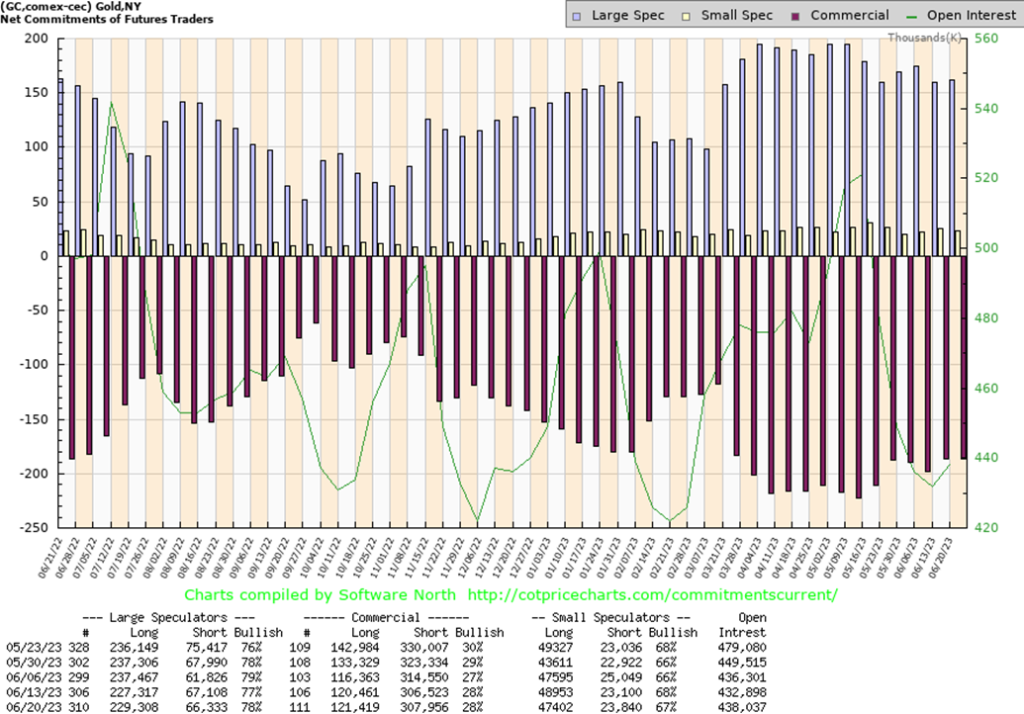
The commercial COT (bullion companies and banks) was unchanged this past week. Long open interest did rise to roughly 1,000 contracts while short open interest was also up just over 1,000 contracts. So, it evened out. The large speculators’ COT (hedge funds, managed futures, etc.) rose slightly to 78% as they added roughly 2,000 longs while the shorts fell about 1,000 contracts. Overall, open interest was up to over 7,000 contracts. This week’s numbers do not include the last three days, so next week’s will be interesting. It’s not an overwhelming COT for either bulls or bears.
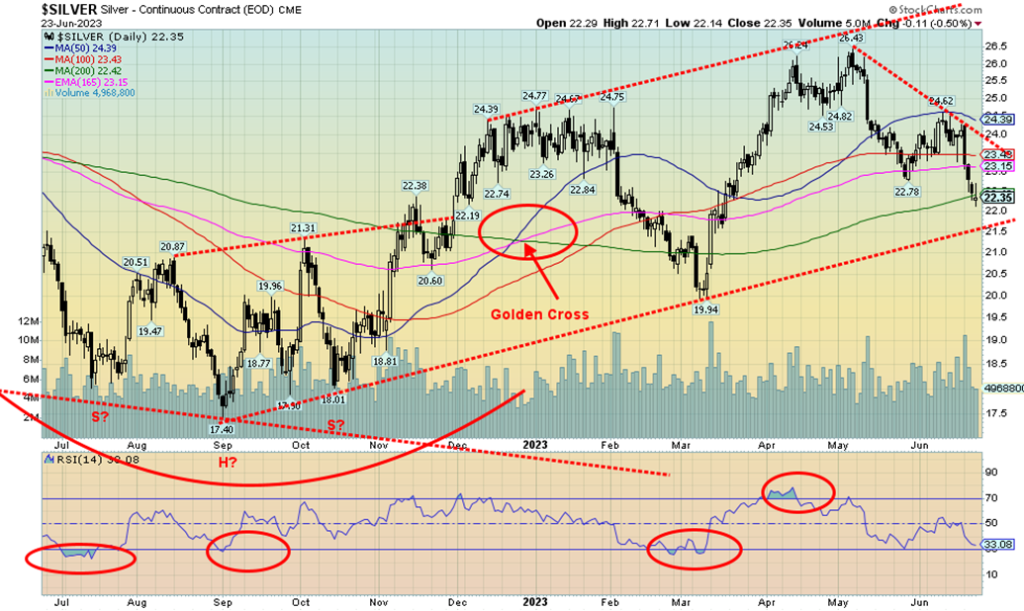
Silver was hit hard this past, week falling 7.4%. An ugly week, for sure. Silver has fallen to potential support at the 200-day MA near $22.40. That uptrend line from the September low also looks like a potential target and is down near $21.50. What the silver bugs don’t want is to break that line at $21.50 and then break the March low of $19.94. That in turn could set up a test of the September low at $17.40. Despite the fall from that peak at $26.43, the RSI is still above 30. So, technically at least, we are not quite oversold, yet. The commercial COT (noted next) is mildly bullish, so that could help a rebound this coming week. But that downtrend line is at $24 and we need to break above that level to suggest a low is in place. We are now down around 15.5% from that May high. Silver has turned negative for the year, off 7.0%. The swing-down target from that rebound in May that took us from $22.78 to $24.62 has a potential target of just under $21. Hence, that’s why that $21.50 support line is important. The daily trend is down and the weekly trend has also turned down. Only the monthly trend is hanging in and it’s neutral. All this is concerning, particularly given stories that suggest there are growing silver shortages. And then there is the OCC report we noted under gold that suggests a buildup in over-the-counter derivatives in gold and silver by two banking behemoths. Something is building, but we are not there yet.
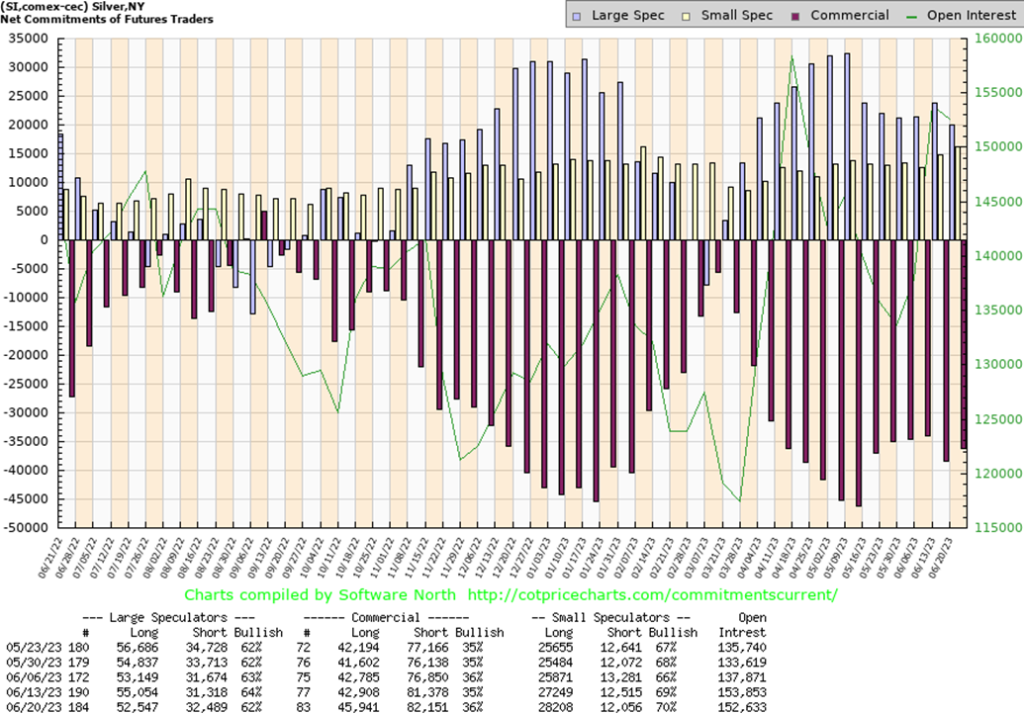
The silver commercial COT improved slightly to 36% this past week from 35%. Long open interest rose roughly 3,000 contracts while short open interest also rose but only by about 1,000 contracts. The large speculators’ COT fell to 62% from 64% as they shed almost 3,000 longs and added about 1,000 shorts. Open interest was down about 1,000 contracts. The silver COT is mildly bullish.
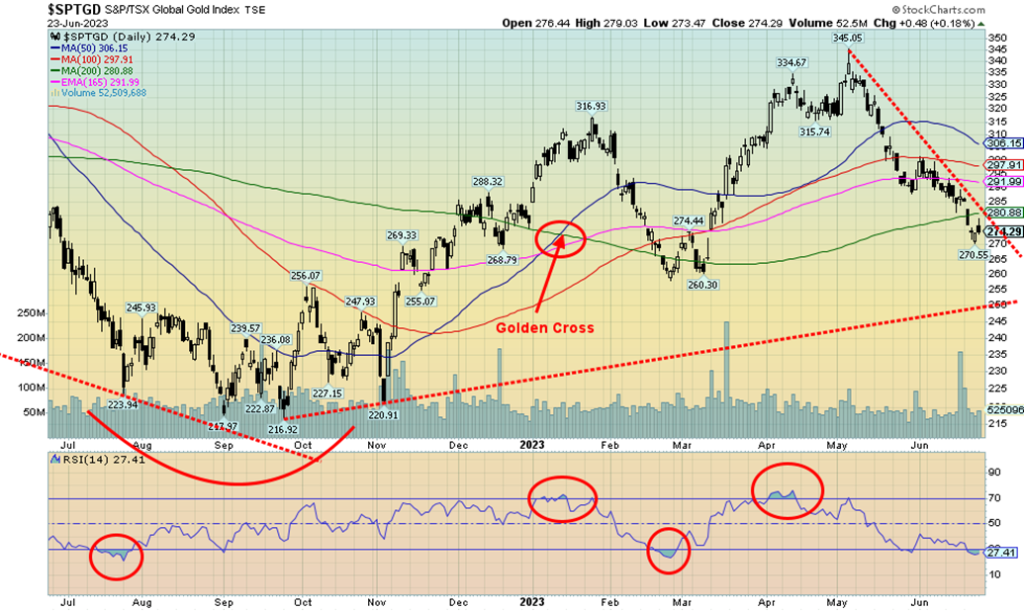
Misery is the gold stocks. Not only did they fall again, but they have now broken under 200-day MA. No, we don’t have a death cross yet. The decline this past week to the 270 level leaves it just above that March low of 260. If that falls, there is at least trendline support near 250. This past week, thanks to a down week for gold and silver, the TSX Gold Index (TGD) fell 4.4% while the Gold Bugs Index (HUI) dropped 4.8%. The TGD is now down on the year by 1.2% while the HUI clings to gains up 0.8%. A far cry from the May high. We are now down 20.5% from the May high, an official bear market for gold stocks. We are also oversold as witnessed by the RSI, which was down to 27. The good news is just a rebound above 280 would break that steep downtrend line. The reality, however, is that we won’t breathe easily until we regain above 305. June is a weak month for gold and gold stocks and, so far, it is proving that in spades. And we can’t even call a bottom yet. We did, however, like the action on Thursday when we made new lows for the current move reversed and closed barely off the previous day’s close. New lows under 270 could set up a drop to 260, but a breakout over 280 could set up at least an up move to 290. Sentiment, as measured by the Gold Miners Bullish Percent Index (BPGDM), is actually quite neutral, currently at about 43. In March it fell below 30 and last year, in the September/October lows, the BPGDM fell to 3.5, giving us huge buy signals. In theory, this could either turn around or fall further.
If the gold stocks have been miserable the junior gold and metals mining dominated TSX Venture Exchange (CDNX) is also miserable having fallen under 600. The low seen last December 2022 at 555 now looms. We are
down 54% from that top seen in February 2021. Many junior gold and metal stocks are down that and more from their highs as well. Companies report good results and the stock falls. The good news is that companies are having little problem in raising funds and insider buying continues. Accumulation is underway but saying that doesn’t rule out even lower prices first. For those, however, who wish to speculate now is an excellent time to be accumulating those stocks.
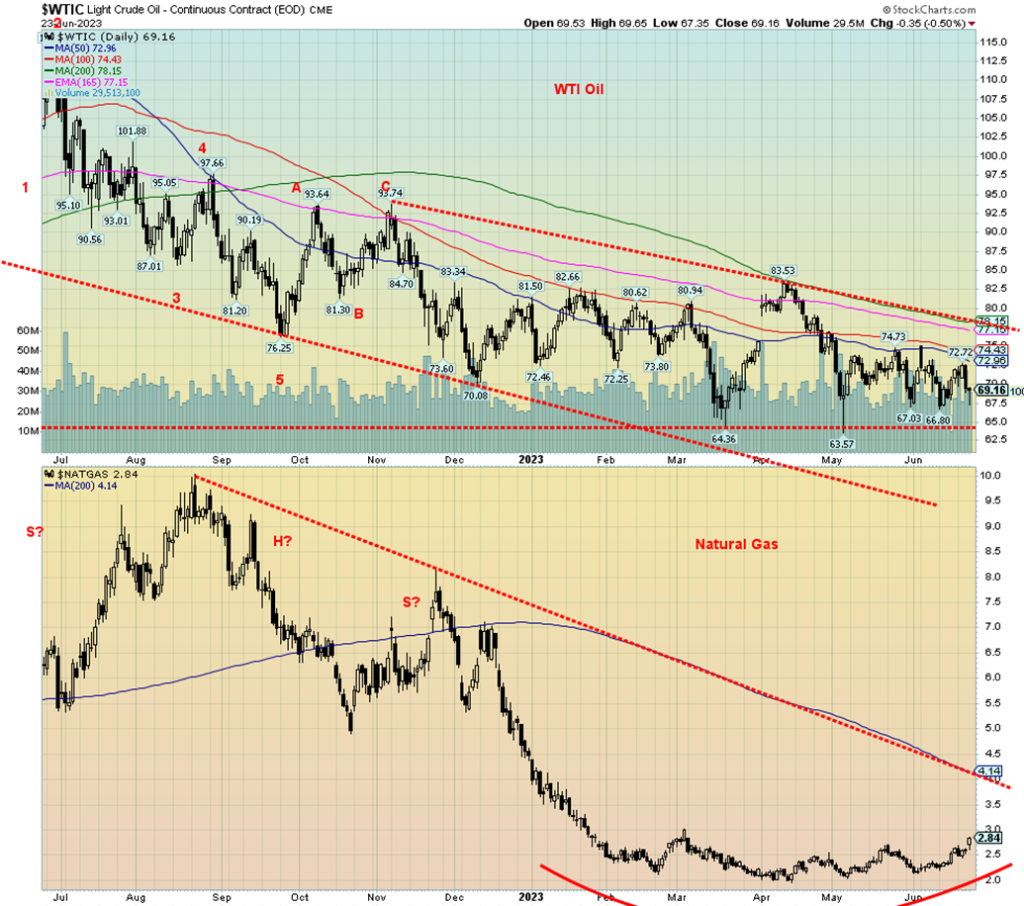
Just as it looks as if oil prices might rise, they get smashed down again. If it isn’t decreased demand, it’s fear of recession or the latest fear of higher interest rates that might trigger a recession. The latter seems to be one of the reasons oil prices turned tail this past week. The BOE hiked an unexpected 50 bp and we had Powell and others talking about more interest rate hikes—obliquely, of course, as they will never come right out and say they are going to raise rates further. Nonetheless, oil prices dipped on that very fear following the rate hike and realizing that the U.K. is on the verge of a recession and possibly the EU as well. What will the ECB do? Like the U.K., it is well behind the inflation curve and needs to catch up.
On the week, WTI oil lost almost $3, falling 3.9%. Brent crude fell only 1.6%. Natural gas (NG) at the Henry Hub jumped about 8%, but NG at the Dutch Hub fell 7%. At $2.84, NG is getting closer to our possible $3 breakout. That would be helpful, but that downtrend line comes in currently around $4 so NG would really have to break that level to go higher. The energy indices weren’t enthused about the fall in oil prices as the ARCA Oil & Gas Index fell 3.3% while the TSX Energy Index (TEN) was down 3.6%. A miserable week all around. Okay, except for NG at the Henry Hub.
All that leaves oil exactly where it has been for the past several weeks, in a trading range between roughly $65 and $75. The oil downtrend line comes in around $77, which is slightly above the $75 trading range level. To be safe, oil needs to break above $78 and not fall under $65, and definitely not under $63.
Could the noise emanating from Russia about a possible coup have an impact on oil prices? That is difficult to say at this point as the events are in the process of unfolding and the coup appears to be over as fast as it began. It’s safe to say, however, that oil prices need a catalyst of some sort to jump them higher. The trouble is, it is fighting the seasonals that have moved into the weak part of the year when we don’t normally expect a big jump in oil prices. However, the bottom formation is compelling. It needs a spark to break out. The floor appears solid. Besides, the Saudis and others (Russia?) won’t allow prices to fall much. It’s not in their interest.
__
(Featured image by Pexels via Pixabay)
DISCLAIMER: This article was written by a third party contributor and does not reflect the opinion of Born2Invest, its management, staff or its associates. Please review our disclaimer for more information.
This article may include forward-looking statements. These forward-looking statements generally are identified by the words “believe,” “project,” “estimate,” “become,” “plan,” “will,” and similar expressions. These forward-looking statements involve known and unknown risks as well as uncertainties, including those discussed in the following cautionary statements and elsewhere in this article and on this site. Although the Company may believe that its expectations are based on reasonable assumptions, the actual results that the Company may achieve may differ materially from any forward-looking statements, which reflect the opinions of the management of the Company only as of the date hereof. Additionally, please make sure to read these important disclosures.
David Chapman is not a registered advisory service and is not an exempt market dealer (EMD) nor a licensed financial advisor. He does not and cannot give individualised market advice. David Chapman has worked in the financial industry for over 40 years including large financial corporations, banks, and investment dealers. The information in this newsletter is intended only for informational and educational purposes. It should not be construed as an offer, a solicitation of an offer or sale of any security. Every effort is made to provide accurate and complete information. However, we cannot guarantee that there will be no errors. We make no claims, promises or guarantees about the accuracy, completeness, or adequacy of the contents of this commentary and expressly disclaim liability for errors and omissions in the contents of this commentary. David Chapman will always use his best efforts to ensure the accuracy and timeliness of all information. The reader assumes all risk when trading in securities and David Chapman advises consulting a licensed professional financial advisor or portfolio manager such as Enriched Investing Incorporated before proceeding with any trade or idea presented in this newsletter. David Chapman may own shares in companies mentioned in this newsletter. Before making an investment, prospective investors should review each security’s offering documents which summarize the objectives, fees, expenses and associated risks. David Chapman shares his ideas and opinions for informational and educational purposes only and expects the reader to perform due diligence before considering a position in any security. That includes consulting with your own licensed professional financial advisor such as Enriched Investing Incorporated. Performance is not guaranteed, values change frequently, and past performance may not be repeated.


Blockchain Evolves Toward AI, Finance and Quantum Security
Blockchain is evolving beyond crypto into finance, AI applications, and digital markets, while security and regulation remain challenges. Quantum threats...


The Italian Crowdinvesting Market Faces Sharp Decline in 2026
Italian crowdinvesting market continued to decline in 2026, with fundraising falling 36.8% year-on-year to €164.19 million. Platforms and active campaigns...


Sartorius Stedim Biotech Maintains Growth Momentum in H1 2026
Sartorius Stedim Biotech reported solid H1 2026 results, with revenue reaching €1.527 billion and EBITDA rising to €479 million. Growth...


Bank of Africa Launches BOA MDM Network to Boost Diaspora Investment in Morocco
Bank of Africa launched the BOA MDM Network to channel diaspora remittances into productive investment, aiming to raise their share...


Switzerland’s Medical Cannabis Reform Advances Access, But Barriers Remain
Switzerland’s 2022 medical cannabis reform improved patient access by removing federal approval requirements, but challenges remain. MEDCAN highlights barriers including...
 |
|
 |  |
 |
|
-

 Africa2 weeks ago
Morocco Cuts Card Fees to Spur Digital Payments, but Uncertainty Remains
-
 Biotech1 day ago
Sartorius Stedim Biotech Maintains Growth Momentum in H1 2026
-

 Cannabis1 week ago
Virginia Cannabis Market Could Reshape Regional Competition
-

 Impact Investing4 days ago
Ecobnb Turns Sustainable Tourism Into Measurable Impact