Business
The big kaboom: interest rate swaps
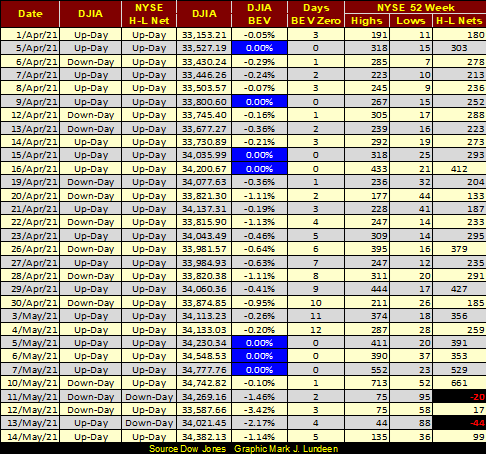
Looking at the major market index’s BEV values, this week saw a big decline of new all-time highs; only one on Monday. Though at Friday’s close, sixteen of these indexes closed the week in scoring position, less than 5% from their last BEV Zero. Seeing so many indexes in scoring position at the close of this week makes me optimistic that the market will see more BEV Zeros next week.

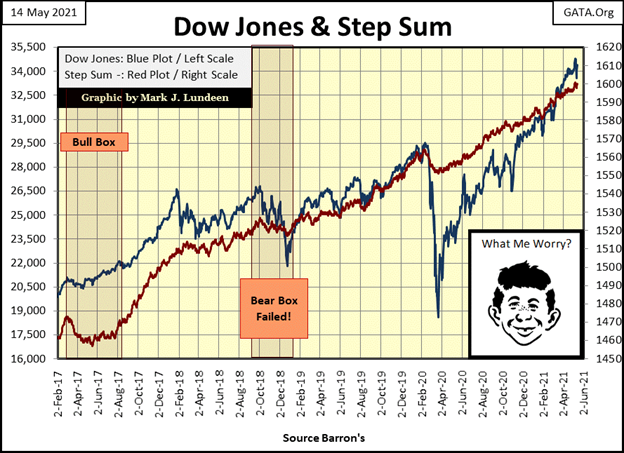
The Dow Jones made no new BEV Zeros this week, closing Friday 1.14% from its all-time high of last Friday. On Wednesday this week it declined 3.42% from last Friday, before recovering later in the week. None of this is startling to the bulls. And I agree nothing has changed in the stock market that signals the end of the incredible advance that began following 23 March 2020’s 38% decline seen below.
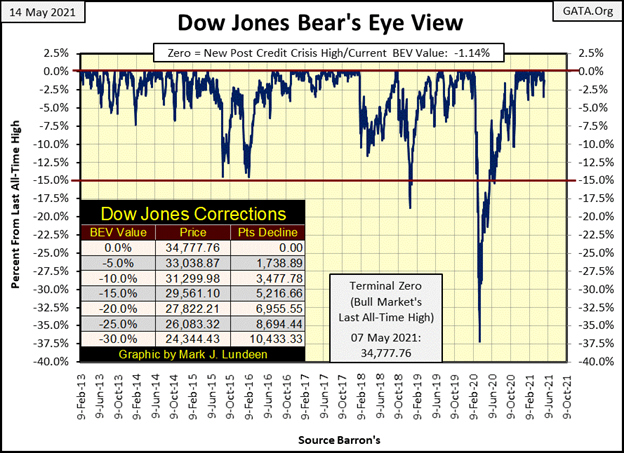
What sort of market event would signal the possible start of a deflationary phase in the market? Well, the sort of market event that has always signaled the beginning of a deflationary stage in the market:
- Days of Extreme Market Volatility / Dow Jones 2% Days.
- Days of Extreme Market Breadth / NYSE 70% Advances – Declines.
Extreme market volatility is seen when the Dow Jones moves (+/-) 2% or more from a previous day’s closing price. NYSE 70% A-D days are computed as follows;
Advancing issues – declining issues: total issues trading that day
If the math above results in (+/-) > 70%, a day of extreme market breadth has occurred.
These extreme days can occur during big market advances, but almost never do. It’s during big bear market declines they become regular market events as market valuations deflate.
This week on Wednesday we came within a sliver of seeing both; a day of extreme volatility (-1.99%) and market breadth (-69.70%). Wednesday was a bad day; sometimes things just happen. So, I remain short-term bullish on the stock market. But should we see extreme days increase in their frequency, especially should we see two or three of them in a single trading week, my advice would be to get out of the market and stay out.
Of course, I don’t recommend exiting the gold and silver mining shares, such as those seen in the XAU below (#20).
Looking at the major market index’s BEV values below, this week saw a big decline of new all-time highs; only one on Monday. Though at Friday’s close, sixteen of these indexes closed the week in scoring position, less than 5% from their last BEV Zero. Seeing so many indexes in scoring position at the close of this week makes me optimistic that the market will see more BEV Zeros next week.
This brings us to the XAU; the index that closed the week 31.27% from its last all-time high seen in April 2011. What is there to say when all of the XAU’s comrades in the table below are just a few percentage points away from making market history, with many making new all-time high since last November? That maybe all of XAU’s comrades have been feasting on the “liquidity” flowing from the FOMC. Maybe they are now overvalued and likely to deflate deep into double-digit percentage declines on the next market downturn, while the XAU will not.
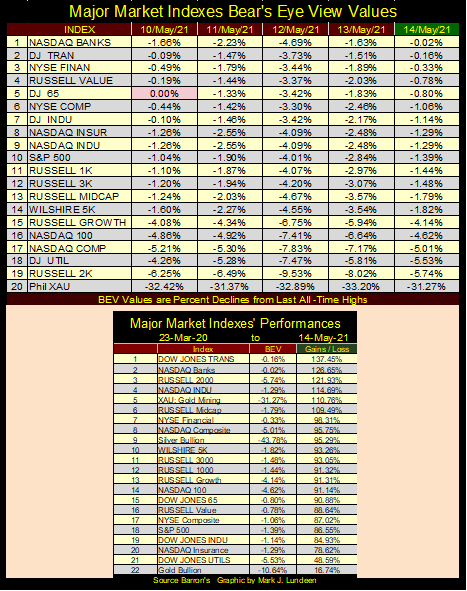
Still, the XAU is at #5 in the table above, advancing 110% since its lows of March 2020. How can I say the XAU isn’t overvalued? Well, let’s look at the XAU in both dollars and BEV format below.
The XAU started trading on the Philadelphia Options Exchange on 20 December 1983, closing at 107.06. Thirty-eight years later, at the close of THIS WEEK the XAU closed at 157.36, for a thirty-eight year gain of 47%. Since December 1983, gold and silver miners in the XAU have been called many things by many investors, most of them uncomplimentary. And I can assure you that “overvalued” was a term seldom used.
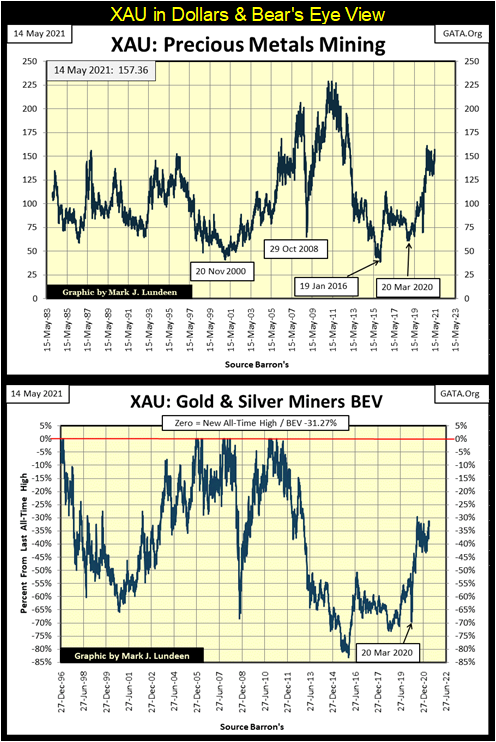
The XAU in its BEV chart above is still working off an 80% market decline from its last all-time high seen ten years ago in April 2011. An 80% market decline? That’s something from the depressing 1930s. Technically speaking, until the XAU exceeds its last all-time high of ten years ago (229), let’s say by at least a double (458), one cannot describe the XAU as being overvalued.
This will become an important point when Mr Bear returns and he begins deflating inflated market valuations in the financial markets. That’s just what he does! As valuations in the precious metals market haven’t really been inflated by the flows of monetary inflation from the FOMC, see charts above, these miners are in perfect position to benefit from a broad based, market wide deflation.
Capital flight from Wall Street will be seeking a safe harbor from Mr Bear’s coming storm. Many times in the past, gold and silver bullion as well as precious metals mining has provided a safe harbor for dollars fleeing deflation in the financial markets. I’m of the opinion they will do so again.
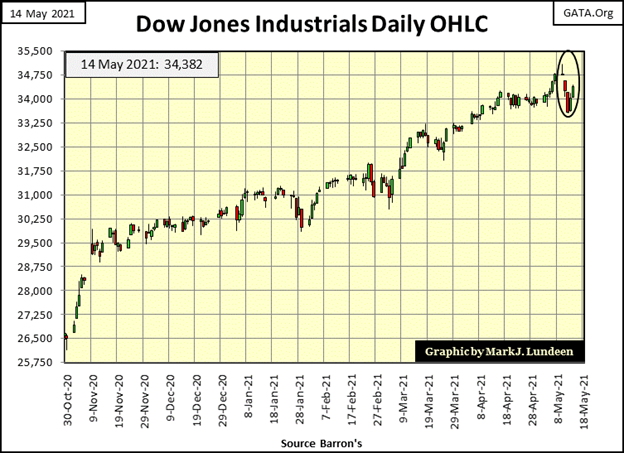
Moving on to the Dow Jones in daily bars below, this week the increase in market volatility is clearly on display. But if you look at past weeks in the chart, we’ve seen weeks like this before, only to see the Dow Jones continue its advance. But that is looking at the market in its rearview mirror. There will come a time when daily volatility will increase, marking the start of Mr Bear’s valuation claw back from the bulls in the stock market.
Is the volatility seen this week that start? Could be. But unless we see a continuation of these big daily moves in the Dow Jones in the weeks to come, taking the Dow Jones down with them, I’m going to assume the big advance off the lows of March 2020 will continue.
On Monday the NYSE 52Wk H-L Nets saw a big 661 in the table below. Come Tuesday the NYSE backed off of its 52Wk Highs in a big way. This week we actually saw two negative 52Wk H-L nets, but that isn’t unusual and so no reason to panic. Still I’m noting it happened.
I want to cover interest rate derivatives, but first I’m going to discuss a corn contract trading at the Chicago Board of Trade (CBOT) as there are similarities between the two. Every corn contract trading on the CBOT is a standard contract; each containing 5000 bushels of dry clean corn, guaranteed by the exchange.
Two significant groups trade corn at the CBOT; food producers such as farmers, and food processors such as General Mills. Farmers produce corn, and when selling want as high a price as possible. But the fact that farmers are selling depresses the price of corn in the market. General Mills processes corn for public consumption, and when buying wants a price as low as possible. But the fact that General Mills is buying corn, increases the price of corn in the market.
There is a nice negative feed-back loop in the corn market’s pricing mechanism. But the point to take away from this is corn producers like high prices, while consumers of corn like low prices. Still, these two very different groups can get together and do business at the CBOT buying and selling corn; it’s called price discovery.
Another grouping found trading commodities is that of the commercials and speculators. Commercials are those who actually produce or process for consumption the commodity being traded. The other group are the speculators. Speculators are said to be people who buy what they don’t want, and sell what they don’t have. At the CBOT corn market, that would be city-slickers like you and me.
Most speculators lose money trading futures contracts, to the profit of the commercials. So, of course city-slickers like you and me are always welcomed to trade corn in Chicago. But it should be noted that there are speculators who profit handsomely from trading futures contracts, but they approach their trading like a business, because to them, it is.
Here’s a table showing a 5,000 bushel corn contract. This contract has two parties;
- The Short / the seller of 5,000 bushels of corn. Shorts profit when the price of corn decreases.
- The Long / the buyer of 5,000 bushels of corn. Longs profit when the price of corn rises.
#1 shows this contract at its moment of creation; 5,000 bushels of corn for $3.75, giving the contract a notional value of $18,750. One could think this notional value to be the value of this contract, and if you wanted to take 5,000 bushels of corn home with you today, while the price of corn was at $3.75, indeed it would be.
But this CBOT corn contract may be traded for maybe a year or more, and during the year the price of corn is going to change. We’ll assume the original short and long in this contract will remain its owners for its duration in the following example to keep things simple. But in fact, its owners (both short & long) could change many times in a single day.
The CBOT also treats commercials (farmers and General Mills) differently from speculators (city-slickers like you and me). We’ll assume both sides to this contract (short & long) are speculators, and speculators must post money for their margin. Margin accounts in the stock market are funded with a bank loan. Not so with commodities. Speculators in commodities must fund their margin account with their own money. We’ll assume these speculators are posting 50% of the notional value for this contract; $9,375. Posting only half the notional value doubles their profits / and losses.
Notice, as long as the price of corn remains at $3.75, nothing happens with this contract. But should the price of corn increase to $4.75 (#2), $5,000 from the shorts margin account flows to the long’s margin account. Should the price of corn decrease to $2.75 (#3), $5,000 from the long’s margin account flows to the short’s margin account.
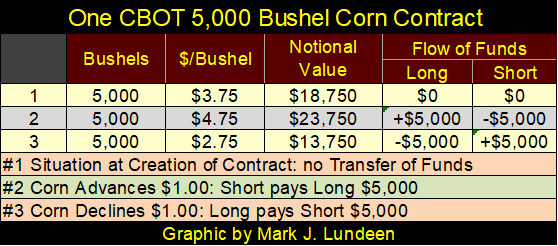
I went into more detail above than I had to, because the point I wanted to make is that in a functioning market seeking price discovery – like corn, there are market participants who benefit when the price of corn increases or decreases.
So, what’s with interest-rate derivatives? If you think about them, there is something very odd that makes comparing them to a CBOT corn contract a poor comparison. With corn, the farmers profits from rising corn prices, while food processors (and the public) benefit from lower corn prices.
Taking this comparison with bond yields in an interest-rate derivative, I can see who benefits from lower bond yields; both the bond issuer and bond holder. The bond issuer can rollover their maturing debt at a lower rate of interest, the bond holder sees the value of their bonds increase as interest rates decline. But who benefits from rising bond yields and deflating bond prices?
That’s an easy question to answer for the corn market; corn producers do. In the debt markets, do producers of debt, like the US Treasury and corporations dream of the day when bond yields rise above their current historic low levels to something over 6%? I think not. What about holders of debt? Maybe they dream of bond yields above 6%? Nope, not them either.
So, who does benefit from rising bond yields? Who is willing to counter party for profit, with those who benefit from declining bond yields in this hundred trillion dollar market? I can’t think of anyone.
Barron’s had a cover article on interest-rate swaps (derivatives) in their 19 August 1985 issue, thirty-six years ago when these derivatives were a then huge 150-billion dollar market. This same issue of Barron’s reported the market cap for the NYSE at $1,778-billion dollars. So, in 1985 the interest-rate swap market’s notional value was a bit less than 10% of all the stocks trading at the NYSE.
It’s been a long time since I’ve read this article, but I recall the author was puzzled by what purpose they served, concluding that being a massive 150-billion dollar market, they must be useful to someone.
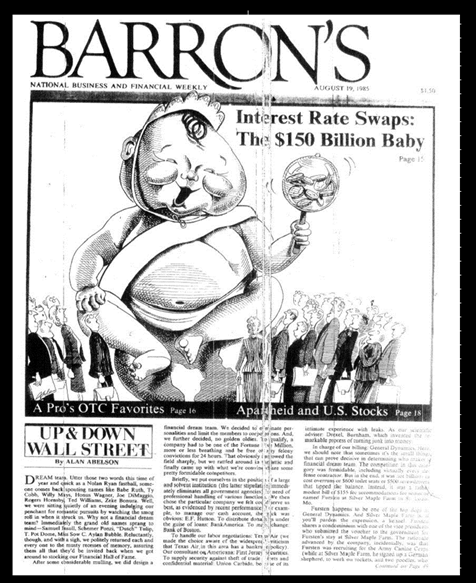
Looking at the Bank of International Settlement’s derivative report this week (Table D7), interest-rate swaps are now a $355.79 TRILLION dollar market, over 2,000 times the notional value this market had in 1985. That’s a lot of counter party risk for someone should bond yields once again rise above 5%!
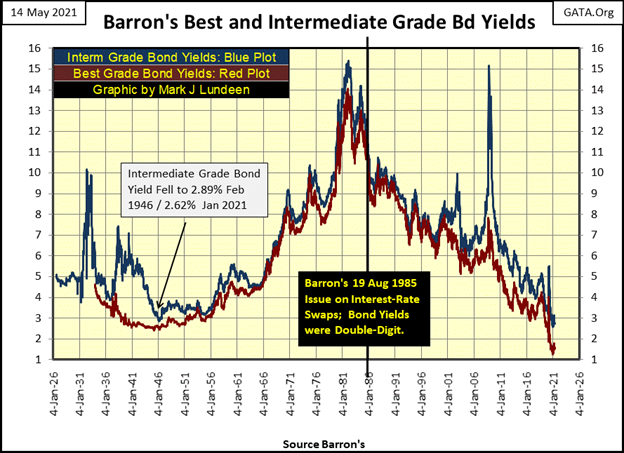
Let’s look at bond yields since 1985. The heavy black vertical line is for Barron’s 19 August 1985 issue, when their Best and Intermediate Grade Bond Yields were published at 10.96% & 11.63%. In the following four decades these bond yields declined, down to 1.29% and 2.62% in Barron’s 04 January 2021 issue.
When were these derivatives first created? Sometime during the rise in bond yields from 1955 to 1982 when fiduciaries would have loved to have some means to hedge their interest-rate risks? Or did they first come about after October 1982, following the peak in bond yields seen below? I don’t have the answer to that question; but I suspect this market was created after October 1982.
I’m not a financial industry insider, but the financial markets have been a personal obsession of mine for decades. I’ve seen lots of snake oil sold to suckers on Wall Street over the years. I think these interest rate derivatives is Wall Street’s biggest scam ever.
As I see it, one party to these interest rate swap contracts wants to hedge their risk should interest rates rise. But the problem is, unlike a CBOT corn contract, there aren’t ready counter-parties that will naturally profit should bond yields rise to take the other side of these contracts. And if there are, they are of insufficient quantity to counter-party the current 355.79 TRILLION dollars this market currently has, or the 150 billion dollars this market had in August 1985.
The only reason the big banks on Wall Street created this phony market, and willingly took the other side of these contracts was because they knew the fix was in; that the Federal Reserve was going to do what you see above; engineer bond yields lower in the decades to come. I suspect since 1985, the wealth these big banks have skimmed off of pension funds and insurance companies has been astronomical.
Isn’t it odd that Fed Chairman Powell in March 2020, during a selling panic in the corporate bond market, announced the FOMC was for the first time buying (monetize) corporate bonds. Why would he do that? Maybe because that is what it took to keep a multi-hundred trillion-dollar fraud from coming into the money at Wall Street’s expense?
Is this possible? Could a fraud of this scale and multi-decade duration not be uncovered and reported to the public by the financial media, government-market “regulators”, academics who study the economy and markets, or our elected officials in Washington? Apparently, these people haven’t a clue what is going on, and that’s their story. If they’re smart they’ll stick to it.
Do you think interest rate swaps is the only scam being foisted on a trusting public? Below is a CNBC report on CPI inflation for April 2021.
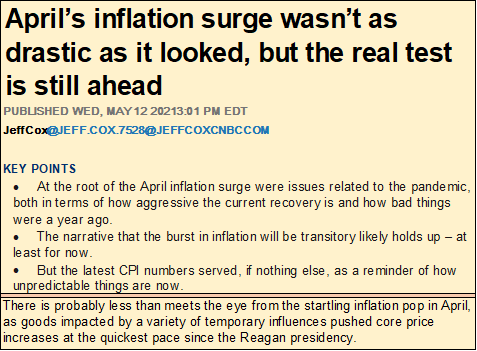
Yep! As per CNBC the CCP Virus caused the big jump in CPI inflation for April, but it’s only a “transitory” spike.
I’d be ashamed to have my name on the by-line for this article. But reporters for financial-mainstream media know what their paymasters want; keep the public in the market by never reporting information that may make them sell. If they aren’t willing to do that, they best find some other means to support themselves. That may be a little harsh, and then maybe not as they typically provide dis-information, like the article above, to the consumers of their “news.”
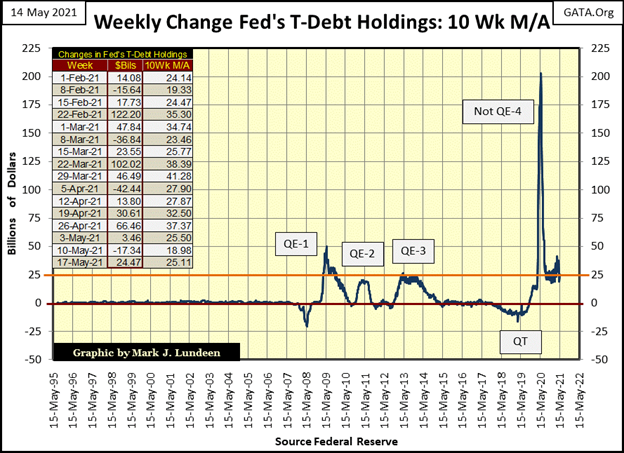
The real reason CPI has been biting into consumer’s wages and income for the past year can be seen in the chart below. The Federal Reserve is over issuing dollars as it has never done before. And that big “liquidity” spike seen below; the Not QE#4 was the FOMC’s reaction to the spike in bond yields seen in March 2020. I believe if the deflation in the corporate bond market seen in March 2020 had been allowed to continue, it would have resulted in waves of bankruptcy up and down Wall Street.
Uggh – what an ugly world we investors have to deal with daily! This is going to end badly for all of us. Want to learn something about history? There are many selfish people in the world, people who don’t care about anybody, or anything else but themselves. And the best and brightest of them always make it to the top, where they scheme and plot together to have their way with the rest of us.
That’s 5000 years of human history in a nutshell.
I’m glad I’m a Christian, because of things like this; the pretention of total ignorance of the grotesque monetary inflation going on by reporters in the media. Or the presumed ignorance of the pending detonation in the interest-rate swap market, by those in positions of public trust, such as market “regulators” and academics. I just trust in the Lord to take care of business, and leave it at that when I go to sleep at night.
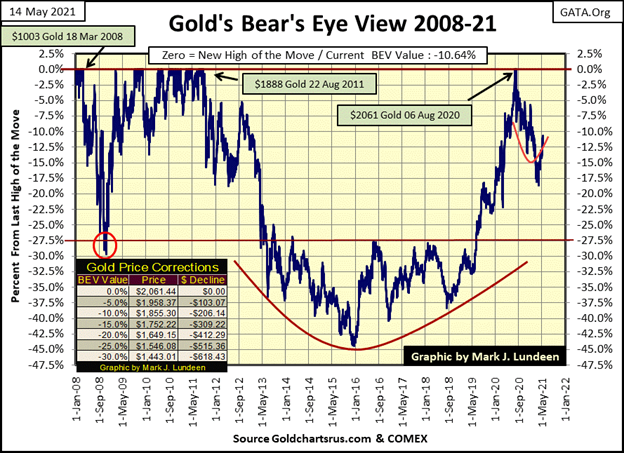
Let’s look at gold’s BEV chart below. Gold made an attempt to break above its BEV -10% line this week, closing Friday with a BEV of -10.64%.
I notice that I, and I assume others also suffer from what I call the Battered-Bull Syndrome; when a market I’m in is rebounding off of a correction bottom. This was especially so off of gold’s -45% bottom seen in December 2015. Gold’s BEV -27.5% red line ($1360) seemed like an impenetrable ceiling, even though I knew this chart pattern of a bowl was a classic bullish pattern, in my heart-of-hearts (aka my guts), I wasn’t sure if gold could break above that red line. But it did, and hasn’t looked back since June 2019.
It’s the same with gold today, now knocking at the door of its BEV -10% line. Like a battered bull I keep looking at gold’s BEV -20% line, but its wrong to act on my fears as this chart is damn bullish. New all-time highs for gold this summer? Why not?
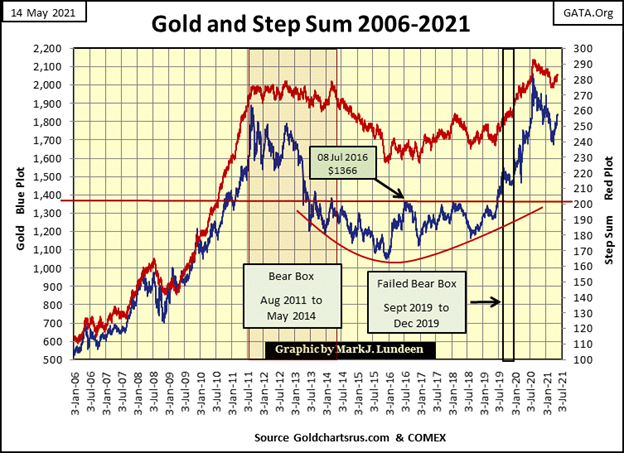
Gold and its step sum plot below is another pretty chart for us to gaze at. When gold takes out its last all-time high from last August, we may see some down field running as when gold advanced off its October 2008 bottom. After the past decade seen below, it really is time for a change.
This week in the step sum chart for the Dow Jones below, the Dow Jones saw a little retracement. Am I worried? Not if Alfred below isn’t.
A note on Alfred E. Newman seen below. Everyone of my generation, the baby boomers know Alfred as the face of Mad Magazine. Parents of the 1950s & 60s hated it when their children read Mad Magazine! For my younger readers who maybe don’t anything about Alfred, here’s a little video to get them up to date.

Moving on to gold’s step sum table below, things are looking up for the bulls. Gold closed above $1800 on May 6th, and hasn’t looked back yet. Will gold break above its BEV -10% line ($1855) next week? I wouldn’t be surprised if it did.
One thing to note is gold’s low daily volatility, currently just under 0.80%. When gold really takes off, when even the financial media is forced to comment bullishly about gold and silver, you’ll see its daily volatility spike far above 1.00% in the table below.
So, things really haven’t started to get exciting yet for gold and silver, but they will, and at much higher prices. If you’re thinking of buying gold and silver bullion, now is the time to do so.
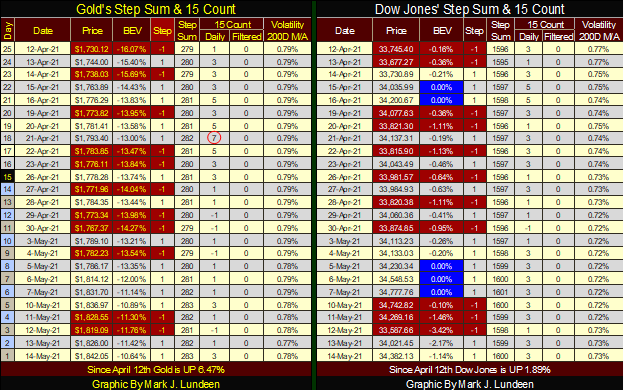
On the Dow Jones side of the table, things look good too. But unlike gold, where an increase in daily volatility to 1.00% is expected to bring big advances in the price of gold, a volatility spike to 1.00% for the Dow Jones is very bearish, proof positive that its time to get the hell out of Dodge City because Mr Bear is just getting started.
But with daily volatility for the Dow Jones closing the week at 0.73%; we’re not at that point just yet. So run bulls run, wild and free while you still can!
—
(Featured image by davidviwes90 via Pixabay)
DISCLAIMER: This article was written by a third party contributor and does not reflect the opinion of Born2Invest, its management, staff or its associates. Please review our disclaimer for more information.
This article may include forward-looking statements. These forward-looking statements generally are identified by the words “believe,” “project,” “estimate,” “become,” “plan,” “will,” and similar expressions. These forward-looking statements involve known and unknown risks as well as uncertainties, including those discussed in the following cautionary statements and elsewhere in this article and on this site. Although the Company may believe that its expectations are based on reasonable assumptions, the actual results that the Company may achieve may differ materially from any forward-looking statements, which reflect the opinions of the management of the Company only as of the date hereof. Additionally, please make sure to read these important disclosures.


Youth Cannabis Use in Colorado Is Falling — But the Full Story Is More Complex
The 2026 Colorado survey shows teen cannabis use fell to 10 percent in 2025, down from 21 percent in 2015....


Morocco’s Growth Holds at 4.6% as Agriculture Offsets Economic Pressures
Morocco’s economy grew 4.6% in Q1 2026, driven by a strong agricultural rebound offsetting declines in industry. Services expanded moderately...


Abivax Shares Surge as New Trial Data Eases Safety Concerns Over Ulcerative Colitis Drug
Abivax shares surged nearly 36% after positive updated trial results for its ulcerative colitis drug obefazimod reassured investors following earlier...


El Dorado Raises $9M to Expand Cross-Border Fintech Platform
El Dorado, a Latin American fintech improving cross-border financial services, raised a $9 million Series A led by Paradigm with...


Bitcoin Stalls Near $60K as Strategy Moves, ETFs Outflow, and EU MiCA Rules Take Effect
Bitcoin hovers near $60,000 with ETF outflows, while Strategy boosts reserves, sells BTC, and raises dividends to reassure investors. Ethereum...
 |
|
 |  |
 |
|
-

 Biotech7 days ago
Gilead HSV Plan Could Transform Market Outlook
-
 Crypto2 weeks ago
Crypto Market Stays Stable as Bitcoin and Ethereum See Mild Declines
-

 Impact Investing2 days ago
Italy Approves First Hydrogen-Powered Train for National Rail Network
-

 Fintech1 week ago
Mollie Expands Across EEA With €350M Investment to Strengthen European Payments Network