Featured
The Ongoing Drama Between Russia/Ukraine/U.S. is Rattling Markets
Will Russia invade? Will inflation prove to be just transitory? So far no. Will oil prices top $100? Will gold break through $1,900 and head for record highs? This week we look at the nature of corrections and bear markets. So far the stock markets have fallen into correction territory. But will it become a bear market? We examine the potential.

Rising inflation. Does the Fed overreact? Does stagflation set in? Geopolitical divisions (Russia/Ukraine/U.S., U.S./China). Deepening domestic political divisions. COVID is still around; does another deadly variant emerge or, worse, another pandemic from a different source? In an overleveraged world; will there be a debt collapse? Do cryptos have the ability to destabilize global financial markets? Climate change will wreak havoc globally as oceans rise, cities sink, and droughts intensify. Growth stocks out; value stocks in. Will gold rise from the dead?
These questions and more are constantly on our mind, given their potential impact on global markets. Are we seeing the early stages of a more prolonged stock market drop? The general definition is that a correction occurs when the market falls 10% or more and a bear market starts when it is down 20% or more. We throw in one more definition. A super bear market starts when a market falls 30% or more. Since 1900 we note for the Dow Jones Industrials (DJI) that it has experienced 38 corrections over 10%, of which 24 were in bear market territory over 20% and 15 were super bears over 30%. That works out to at least one correction every 3.2 years or 38 months, a bear market every 5.1 years, and a super bear market every 8.1 years.
The most recent decline fell into correction territory as the DJI was down just over 10% at the recent low. It is the first correction since the March 2020 pandemic crash. On average, correction/bear markets have averaged just over 30% in declines since 1900. However, that includes the Great Depression market when the DJI lost 89% from 1929–1932. Of the 15 super bear markets, nine of them happened before 1950. Still, that leaves six super bears since 1950: 1968, 1973–1974, 1987, 2002, 2007–2009, and 2020. 1987 and 2020 were swift, short, and deep. Of the 38 corrections since 1900, 22 of them occurred after 1950. There have been seven corrections since 2000, of which one was a bear market and three were super bears.
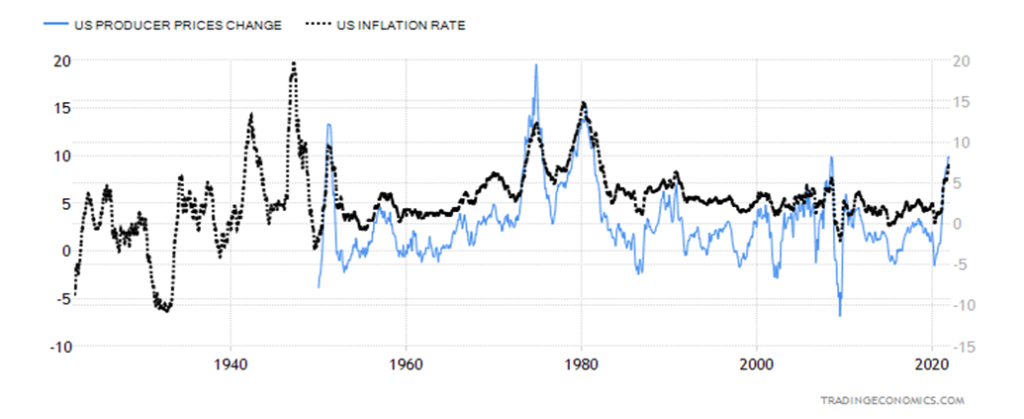
Inflation is a topic on the minds of everyone, especially consumers and central banks. In the U.S. they reported this past week the January Producer Price Index (PPI). It was up 9.7% year-over-year (y-o-y) which was
above the consensus 9.1%. The core PPI was up 8.3% y-o-y, also above the consensus 7.9%. Canada followed
with the CPI the next day, which came in at 5.1% y-o-y above the consensus 4.8%. Core was up 4.3%, just above the expected 4.2%.
U.S. Inflation CPI, PPI Year-Over-Year % Change 1930–2022
Canada Inflation, CPI and Core 1997–2022
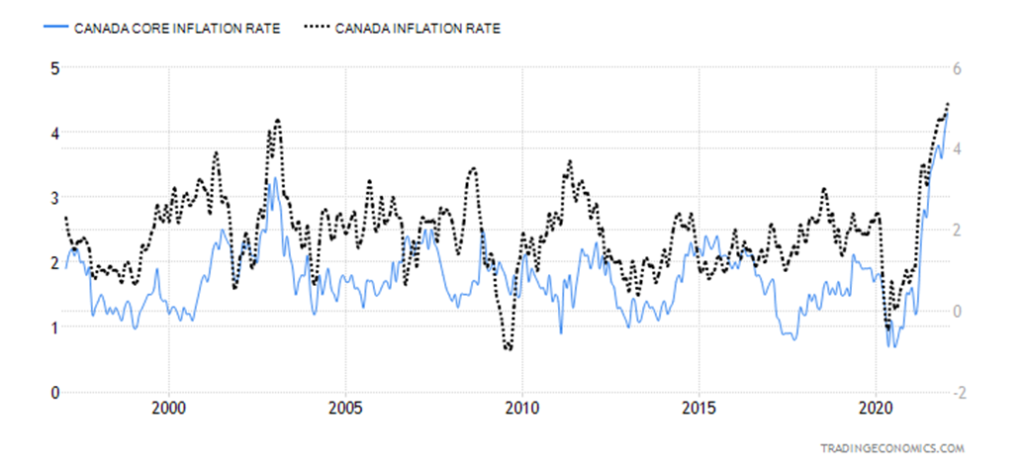
U.S. inflation is now at the highest level since 1982. Canada’s inflation rate is the highest since 1989–1991. Speculation continues that the Fed could hike rates at least five times in 2022, with some speculating seven hikes. What effect would that have on an already shaky market? A rise in interest rates, even a small hike in interest rates, could destabilize a market that has become quite used to ultra-low interest rates. Ultra-low interest rates and generous amounts of QE (liquidity) for the financial system have been the prime drivers for the bull-market that got underway in 2009.
The Bank of Canada (BofC) is also talking hikes soon. A hike in rates could make wage hikes mostly moot and make mortgages and other loans more expensive, thus putting a damper on consumer demand for cars, houses, etc., and it could stop the recovery in its tracks. If another variant of COVID emerged, that would completely throw the markets for a loop. That cannot be ruled out nor could the emergence of another “bug” that sparks a different pandemic.
The Fed has a history of moving too late and then overstaying its welcome. They react rather than proact. Other problems lurk on the horizon. The debt-ceiling debate never gets resolved. It just keeps being punted down the road. But it will have to be dealt with again before the end of the year. And it is coming up in an election year, in a deeply divided country and a gridlocked Congress and Senate. The Fed—caught between a rock and hard place.
There is just too much debt. So, a hike in interest rates could spark an exodus in the corporate bond market. Global debt (governments, corporations, consumers) is now estimated to be close to $300 trillion. The U.S. has the largest debt at $86.5 trillion, representing almost 29% of all global debt. The U.S. total debt to GDP stands at 359%. Japan has the highest national (Federal government) debt in the world, estimated to be 266% of GDP. Its total debt to GDP stands at around 571%, making Japan one of the most indebted countries in the world on a per capita basis. No wonder 32 years after it topped Japan’s Nikkei Dow stock index (TKN), it remains down almost 30% from its all-time high seen in January 1990.
Speaking of Japan, the collapse of the Nikkei Dow back in 1990 caught many by surprise. At the time, Japan was the toast of the world and talk was that the Japanese economy was about to overtake the U.S. economy. Six of the top ten banks in the world were Japanese banks, led by Sumitomo Bank. Today only Credit Agricole of France remains in the world’s top ten that were there in 1990. Going back further to 1970, seven of the world’s largest banks were from the U.S. Today, only Bank of America remains from that list. Today, four of the top ten banks in the world are Chinese, led by Industrial & Commercial Bank of China with assets estimated at $3.5 trillion. In 1990 they were worried that Japan was overtaking the U.S. Today it is China. Many expect the center of the banking world will eventually shift to Shanghai from New York and London. But in 1990 the talk was that the center of the financial world would shift to Tokyo.
Inflation is insidious. Is it transitory as was initially declared? The U.S. CPI hit 5% in May 2021. As we have noted, 5% plus inflation has preceded most every recession going back to 1948. Reaching 5% inflation has guaranteed a recession every time. In the 1970s inflation, the 5% level was breeched in March/April 1973. The official recession was underway by November/December 1973. Inflation bottomed in May 2020 at the height of the pandemic crisis. So, the rise in inflation has been proceeding now for about two years.
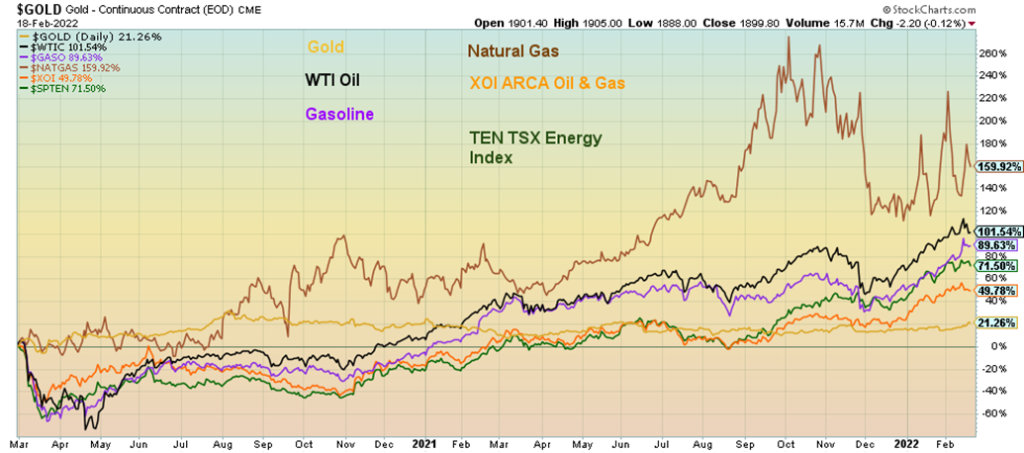
One of the biggest contributors to inflation is oil prices which, for consumers, translates into high gasoline prices. Energy has been a major leader. The performance chart below shows that since March 2020 gold is up 21.3%, WTI oil up 101.5%, gasoline up 89.6%, natural gas (NG) up 159.9%, the ARCA Oil & Gas Index (XOI) up 49.8%, and the TSX Energy Index (TEN) up 71.5%. For the record gas prices at the pump are up in the U.S. 76.1% since the low in April 2020. In Canada it is similar up just over 80% also since April 2020.
Is inflation transitory? We are now about one year (nine months) into inflation 5% or higher. In 1973 it took 20 months for the first round of inflation to peak at the time at over 12%. The 1974–1975 recession took the steam out of inflation at least temporarily. Following the inflation peak in December 1973, inflation fell for the next year but the low was only 5% in December 1976. Then another sharp rise got underway, spurred on again by sharply rising oil prices sparked by the Iranian hostage crisis and the Russian invasion of Afghanistan in 1979. Inflation didn’t peak until March 1980 at 14.6%. So, at this point to call inflation transitory seems a bit premature. The rise in energy prices coupled with supply disruptions has fed into rising car and food prices.
It is widely expected the Fed could now hike the Fed rate 50 bp in March. But all this is coming against the backdrop of signs that the economy is weakening (despite the sharp jump in January retail sales) and the threat of war on the European continent. Just the threat of war has sent energy prices soaring and destabilized the stock market. The only safe haven has been gold, which has jumped almost 7% since a low on January 28, 2022. Bonds, normally considered safe havens, have seen yields rise as the U.S. 10-year treasury note has risen to 1.97% from 1.78% with a high of 2.05% since January 28, 2022. Will gold prove to be the ultimate safe haven? In the face of a slowing economy will the Fed blink? Rock and hard place.
We end this with a quote that seems to speak to the times:
“The Era of Procrastination is coming to a close. We are entering a period of consequences.”
—Winston Churchill, British statesman and aristocrat, prime minister of the United Kingdom 1940–1945, 1951-1955, Nobel prize winning writer and historian, painter; 1874–1965
Chart of the Week
We were intrigued by this chart shown recently in BMG Group Inc.’s (www.bmg-group.com) recent issue of the BullionBuzz, February 16, 2022. Gold does tend to outperform in periods of significant market pullbacks. Our table below puts the above chart into tabular perspective. When it says gold tends to outperform it doesn’t necessarily mean gold stocks. Gold stocks are highly leveraged to the price of gold, however, and in times of market stress and pullbacks they tend to perform no better than the market although occasionally they have done well.
Performance During Pullbacks
| S&P 500 | U.S. 10 Year Treasury Note | Gold | VIX | XAU/HUI * | |
| Black Monday 8/87–11/87 | (28.4)% | 1.9% | 4.2% | NA | (42.7)% |
| LTCM/Russia 7/98–10/98 | (22.5)% | 23.9% | 5.1% | 182% | (14.1)% |
| Dot.Com 1/00-2/01 | (10.4)% | 4.4% | 0.5% | 26% | (13.6)% |
| 9/11 9/01 | (13.9)% | 2.2% | 8.5% | 38% | 18.6% |
| 2002 Recession 3/02-7/02 | (33.9)% | 14.0% | 8.7% | 145% | 15.5% |
| Great Recession 10/07–3/09 | (57.7)% | 17.4% | 38.7% | 257% | (30.4)% |
| Sov Debt Crisis1 4/10–6/10 | (17.1)% | 5.9% | 12.6% | 216% | 19.5% |
| Sov Debt Crisis2 5/11–10/11 | (21.6)% | 8.1% | 29.0% | 229% | (4.9)% |
| 2018 Pullback 10/18–12/18 | (20.2)% | 3.7% | 8.1% | 219% | (0.1)% |
| 2020 Pandemic 2/20–3/20 | (35.4)% | 6.8% | 2.9% | 539% | (45.3)% |
HUI only available 1996 onward
Note that, consistently, even as the stock market pulled back into a corrective or bear market, both gold and bonds improved. It is the rush to safe havens. Volatility consistently rises as we are seeing currently. The gold stocks are mixed and, on some occasions, went up with gold and on other occasions fell along with the stock market. Sometimes the fall in the gold stocks can be deeper than the stock market.
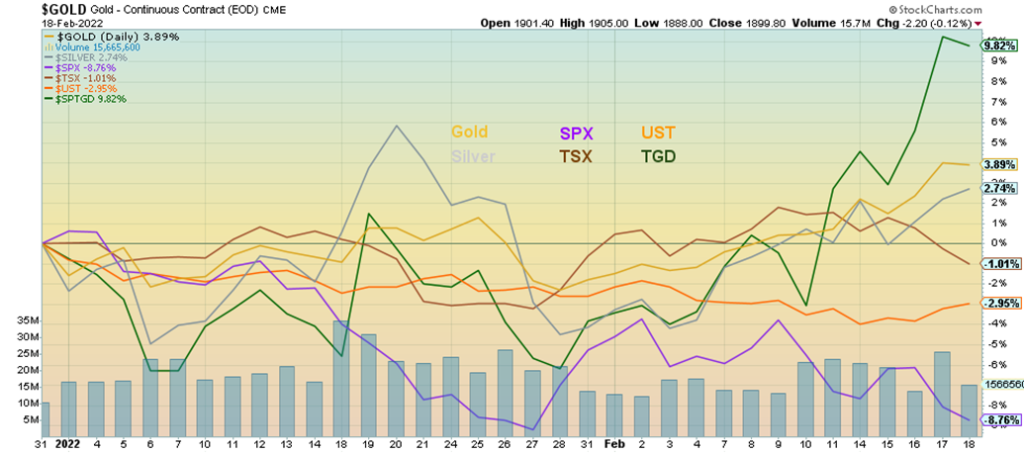
Since the beginning of the year, gold is up 3.9%, silver +2.7%, S&P 500 down 8.8%, TSX Composite -1.0%, 10-year US treasury note (UST) down 3.0% and the TSX Gold Index +9.8%.
Gold is known as a safe haven asset. Gold has been money since 650 BC when gold coins first appeared. It has been shown to provide protection during both inflationary and deflationary periods. It is a hedge against currency devaluation. It is known as a global store of value. Central banks continue to hold hoards of gold, estimated today at 35,567.8 metric tonnes, the highest level since the 1960s. The Basel III regulations recognize gold as having zero risk for bank reserve purposes. That puts gold on the same level as cash and currencies. Gold not only holds its value during periods of financial uncertainty but also during periods of geopolitical or even domestic political uncertainty. Gold has no liability, unlike stocks and bonds. Finally, gold is a portfolio diversifier and is negatively correlated to stocks and bonds.
During this growing period of both financial and geopolitical uncertainty, gold is more likely to hold its value and rise even as the rest of the market wobbles.
MARKETS AND TRENDS
| % Gains (Losses) Trends | ||||||||
| Close Dec 31/21 | Close Feb 18/22 | Week | YTD | Daily (Short Term) | Weekly (Intermediate) | Monthly (Long Term) | ||
| Stock Market Indices | ||||||||
| S&P 500 | 4,766.18 | 4,348.87 | (1.6)% | (8.8)% | down | down (weak) | up | |
| Dow Jones Industrials | 36,333.30 | 34,079.18 | (1.9)% | (6.2)% | down | down | up | |
| Dow Jones Transports | 16,478.26 | 14,970.97 | (0.2)% | (9.2)% | down | down (weak) | up | |
| NASDAQ | 15,644.97 | 13,548.07 | (1.8)% | (13.4)% | down | down | up | |
| S&P/TSX Composite | 21,222.84 | 21,008.20 | (2.5)% | (1.0)% | down (weak) | up | up | |
| S&P/TSX Venture (CDNX) | 939.18 | 852.15 | (1.9)% | (9.3)% | down | down | up | |
| S&P 600 | 1,401.71 | 1,297.92 | (0.3)% | (7.4)% | down | down | up | |
| MSCI World Index | 2,354.17 | 2,283.76 | (1.9)% | (3.0)% | down | down | up | |
| NYSE Bitcoin Index | 47,907.71 | 39,984.02 | (8.6)% | (16.5)% | down | down (weak) | up | |
| Gold Mining Stock Indices | ||||||||
| Gold Bugs Index (HUI) | 258.87 | 282.68 | 6.5% | 9.2% | up | up | up (weak) | |
| TSX Gold Index (TGD) | 292.16 | 320.84 | 6.9% | 9.8% | up | up | up (weak) | |
| Fixed Income Yields/Spreads | ||||||||
| U.S. 10-Year Treasury Bond yield | 1.52% | 1.93% | 0.5% | 27.0% | ||||
| Cdn. 10-Year Bond CGB yield | 1.43% | 1.88% | 1.6% | 31.5% | ||||
| Recession Watch Spreads | ||||||||
| U.S. 2-year 10-year Treasury spread | 0.79% | 0.46% | 9.5% | (41.8)% | ||||
| Cdn 2-year 10-year CGB spread | 0.48% | 0.39% | 18.2% | (18.8)% | ||||
| Currencies | ||||||||
| US$ Index | 95.59 | 96.02 | flat | 0.5 | neutral | up | up (weak) | |
| Canadian $ | .7905 | 0.7847 | flat | (0.7)% | down (weak) | down | up | |
| Euro | 113.74 | 113.26 | (0.2)% | (0.4)% | neutral | down | down (weak) | |
| Swiss Franc | 109.77 | 108.54 | 0.4% | (1.1)% | neutral | down | up (weak) | |
| British Pound | 135.45 | 135.99 | 0.4% | 0.4% | up | down (weak) | up | |
| Japanese Yen | 86.85 | 86.90 | 0.2% | 0.1% | neutral | down | down | |
| Precious Metals | ||||||||
| Gold | 1,828.60 | 1,899.80 | 3.1% | 3.9% | up | up | up | |
| Silver | 23.35 | 23.99 | 2.7% | 2.7% | up | down (weak) | up (weak) | |
| Platinum | 966.20 | 1,076.80 | 5.7% | 11.5% | up | up (weak) | up (weak) | |
| Base Metals | ||||||||
| Palladium | 1,912.10 | 2,337.90 | 6.6% | 22.3% | up | neutral | up (weak) | |
| Copper | 4.46 | 4.52 | 0.3% | 1.3% | up | up | up | |
| Energy | ||||||||
| WTI Oil | 75.21 | 90.21 (new highs) | (3.1)% | 19.9% | up | up | up | |
| Natural Gas | 3.73 | 4.38 | 11.2% | 17.4% | up (weak) | neutral | up | |
New highs/lows refer to new 52-week highs/lows and, in some cases, all-time highs.
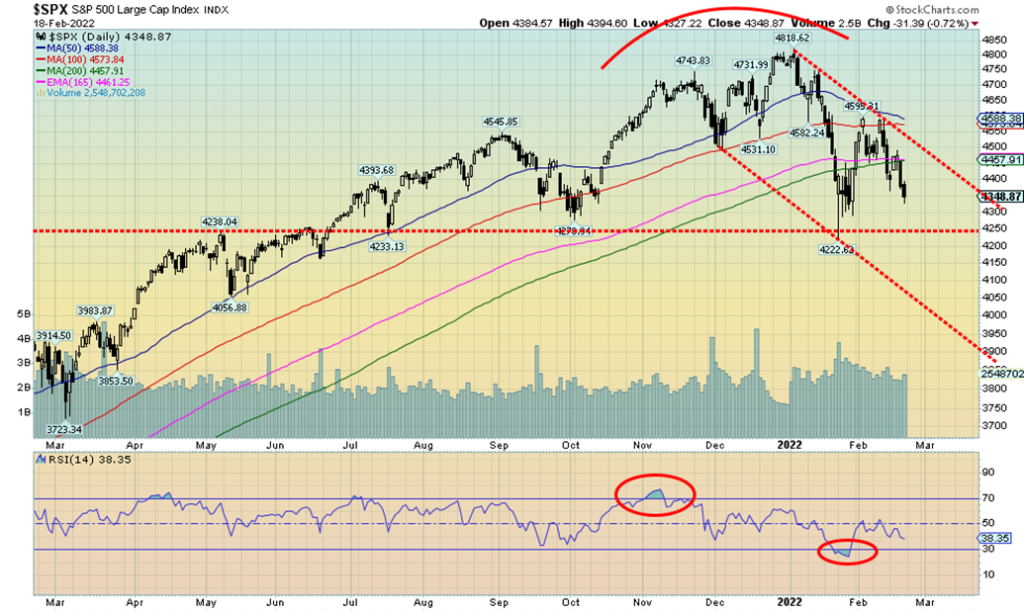
Will Russia invade? Will the Fed hike rates? Inflation is raging. The stock market is having a bit of a heart attack. Despite it all, the S&P 500 has held in remarkably well, off only about 10% from the highs in January. But that is technically peeking into correction territory as the worries mount. Our line in the sand still appears to be around 4,250. A breakdown under that level could spell bigger trouble. We are below the 200-day MA in what some what would call bear territory. Both the short term (daily) and intermediate (weekly) trends have turned down, leaving only the long-term (monthly) trend still up. It’ll take more downside to turn it down.
This past week the S&P 500 fell 1.6%, the Dow Jones Industrials (DJI) was down 1.9%, the Dow Jones Transportations (DJT) was off 0.2%, while the NASDAQ dropped 1.8%. The S&P 600 small cap index is hinting some bullishness, down only 0.3% this past week. The S&P 500 Equal Weight Index fell 1.3%. In Canada, the TSX Composite dropped 2.5% and the TSX Venture Exchange (CDNX) fell 1.9%.
In the EU, the London FTSE was down 1.9%, the Paris CAC 40 off 1.2%, and the German DAX dropped 2.5%. In Asia, China’s Shanghai Index (SSEC) was a winner, up 0.8% while the Tokyo Nikkei Dow (TKN) dropped 2.1%. The MSCI World Index fell 1.9%. Oh yes, the cryptos. Bitcoin turned back to the downside, off 8.6% and now down 16.5% on the year. Red ink all around.
It has been noted that, based on January’s action alone, the US stock markets are off to their worst start in 100 years. Could the stock market go from bad to worse? Given the fear element of war and facing rising interest rates and inflation, a market that continues to fall would not be a surprise. Note how on the rebound rally the
S&P 500 stalled at the 100-day MA and just below the 50-day MA. By the end of the week the market was back under the 200-day MA and headed lower. The most noted fear was the ongoing Russia/U.S./Ukraine conflict. The stock market ebbs and flows depending on whether the invasion is on or on hold. But fear of rising interest rates and high inflation also has market participants worried. Not even some somewhat okay economic numbers this past week were able to help the market.
With the stock markets falling and some pressure still on the bond market pushing prices lower (yields that move inversely to prices rising), it may surprise some that gold has been the best performer. That is, setting aside oil which has been the clear winner in 2022 along with natural gas (NG). Gold and precious metals are rising; the stock market, bonds, and Bitcoin are falling. Gold is mostly negatively correlated to stocks and bonds. Gold (which is real asset) is reacting positively to the negative news while stocks and bonds (liabilities) and even Bitcoin (virtual?) are falling.
That line in the sand we have at 4,250 looks ominous. A breakdown under that level could take the S&P 500 down to 3,850/3,900. At that point the S&P 500 would be down just over 20% from the high in bear market territory. All the major indices are in alignment pointed down. Elliott Wave International (www.elliottwave.com) suggests we are starting a third wave to the downside with potential targets down to 3,700–3,800. That’s only a bit further than our target zone. Only a move back over 4,600 could potentially change this negative scenario.
With breadth making new lows, it is confirming and leading the market down. Only 45% of the stocks are trading above their 200-day MA and only 34% are trading above their 50-day MA. The S&P 500 Bullish Percent Index is at 48 which is neutral so the market isn’t oversold sufficiently yet. The CBOE put/call ratio is at 73. We need to see sustained over 80 to suggest that we could be making a low. The VIX futures are in backwardation, suggesting that there is a lot of immediate buying supporting a near-term bearish position. Backwardation means the cash VIX or front month futures VIX is higher than the VIX further out along the curve.
There will be bounces along the way but the trend is turning solidly down. Buying the dip is not proving to be a winning strategy right now. Our expectations now are that we might not see our first good low until mid-March or so. The question is, from what level? The indicators are bearish but they are not oversold and sentiment isn’t rock bottom just yet.
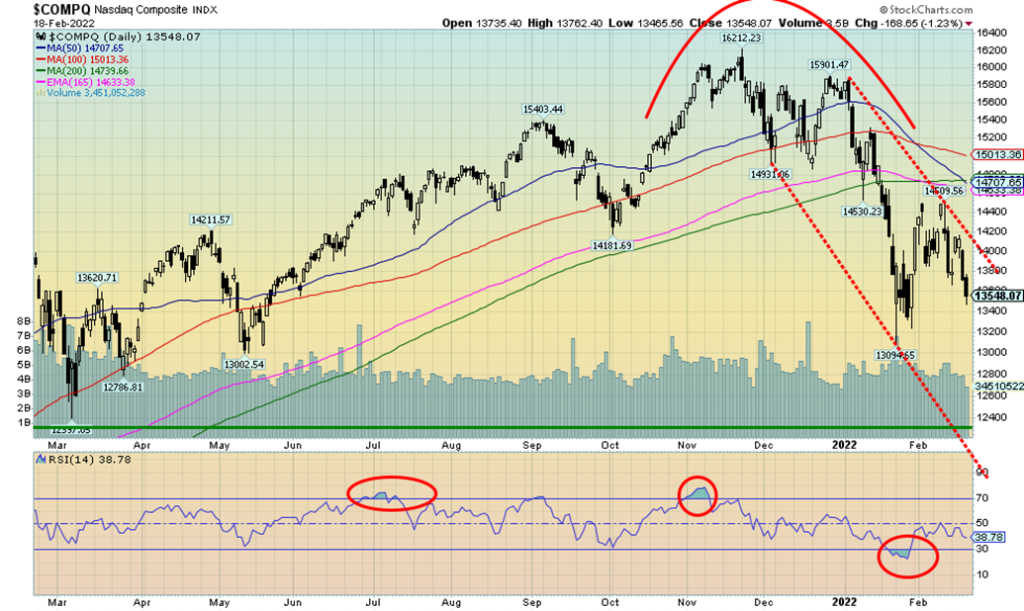
The NASDAQ continues its downward move, losing 1.8% this past week. On the year the NASDAQ is down 13.4% into correction territory. It has been off as much as nearly 20% at the recent low. There is nothing in this chart that suggests to us that this should be bought. The FAANGs continued their downward move. Meta (Facebook) was down 6.1%, Apple -0.7%, Amazon -0.5%, Netflix a gainer +0.1%, Google -2.7%, Microsoft -2.4%, Tesla -0.4%, Twitter -4.3%, Baidu -1.8%, Alibaba -2.7%, and Nvidia -1.3%. Even the great value stock fell this past week with Berkshire Hathaway off 1.4%. Still, we’d be looking at value over growth. The failure of the NASDAQ just under the 200-day MA was a bad sign. Odds are high that we could soon see new lows and the NASDAQ could enter an official bear market, down 20%+. Only a move regaining above 15,000 might turn this market around. If wave one was the low at 13,095 and wave two the rebound to 14,059, then this could be third wave down. It potentially projects down to at least 11,600. The first wave down from the high fell in what looks like an ABC pattern. So, this one should be a five-wave decline to new lows.
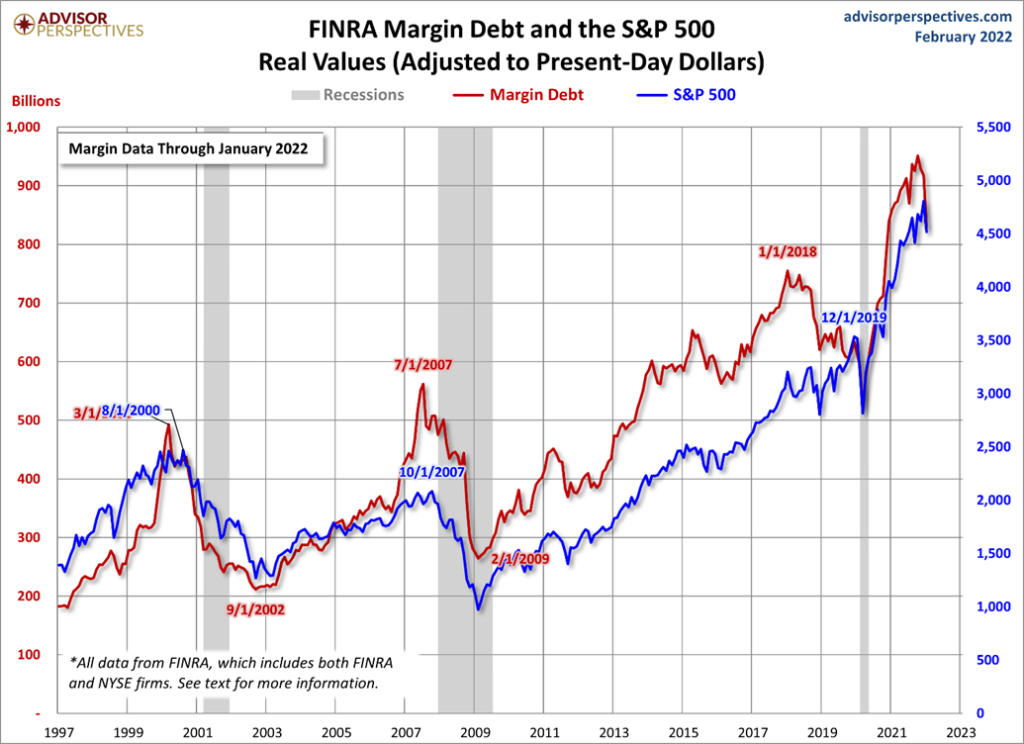
The January margin debt numbers are out. Margin debt fell 8.8% in January. If one looks at the chart, you’ll note that when margin debt begins to fall it often coincides with the stock market starting to fall. As well, a recession follows not long afterwards. You can see that in the 1990s dot.com/high-tech bull and again before the peak in the market in October 2007 and the onslaught of the financial crash of 2008 and the Great Recession of 2007–2009. Once again, it largely showed up for the 2020 pandemic crash although the peak in margin debt actually occurred in January 2018. Margin debt peaked with the stock market that year and, although the S&P 500 made higher highs into February 2020, margin debt peaked at a much lower level. Now, margin debt is falling in January, also possibly coinciding with the peak in the stock market in early January 2022. The question is raised that, given what happened in earlier declines of margin debt, is the stock market poised for a steeper correction?
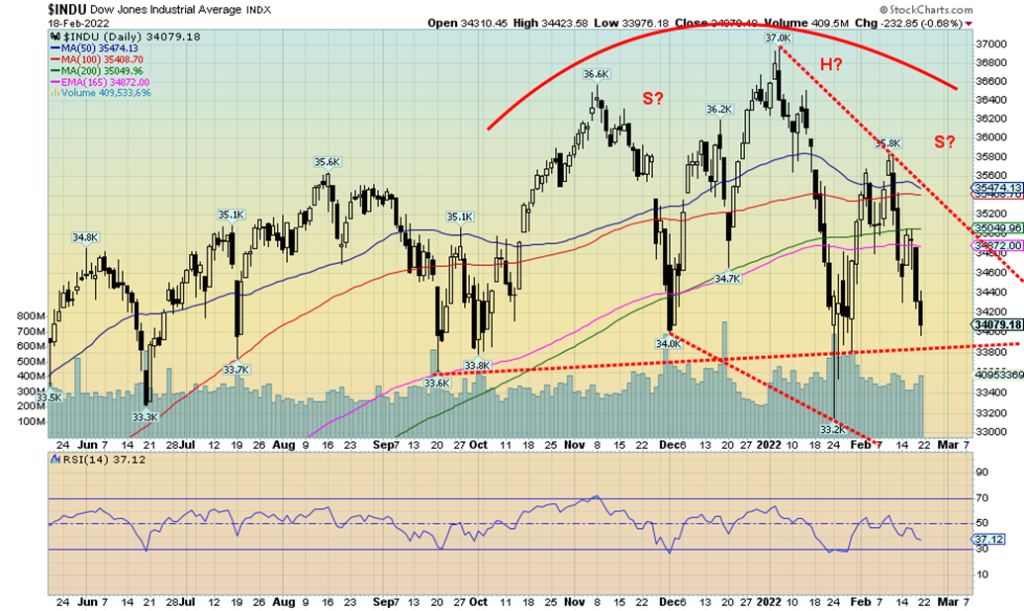
Is the Dow Jones Industrials (DJI) forming a head and shoulders top? It is a very awkward-looking one with a sharply sloping downward neckline. We drew another one that might make sense and this one breaks down under 33,800 and could project down to at least 30,000. In closing under 34,250 this past week the DJI hinted that there is more weakness to come. The neckline we drew is just below. To end any thoughts of it, we’d need to regain above 35,800 and especially above 36,600 the left shoulder high. Irrespective of this, the DJI pattern looks quite negative and our expectation is that we are going to continue to work our way lower.
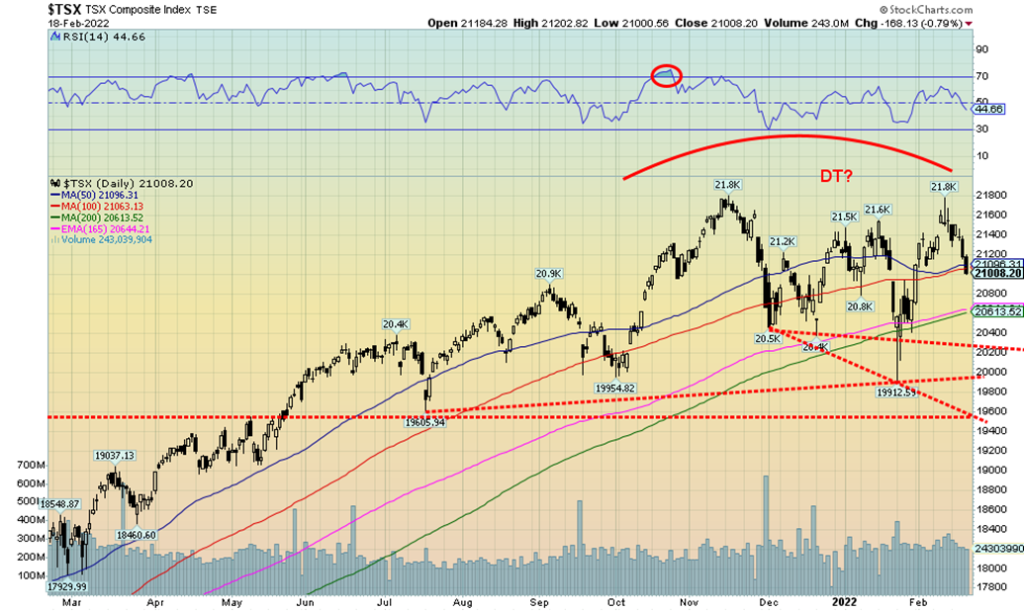
The TSX Composite joined the U.S. indices in falling this past week, losing 2.5%. The junior TSX Venture Exchange (CDNX) fell 1.9%. Of the 14 sub-indices, five saw gains on the week while nine fell. Leading the way up were Golds (TGD), up 6.9%. Metals & Mining (TGM) was up 2.4% and Materials gained 2.7%. Making new 52-week highs was Telecommunications (TTS), up 0.5%. We note that Golds (TGD) have been a strong performer in 2022, up 9.8% but Metals & Mining (TGM) have been even better, up 11.6%. Leading the way to the downside was Health Care (THC), down 8.1% followed by Information Technology (TKK), down 7.3%. On the year, Health Care has lost 8.9% while Information Technology has fallen 22.5%. Both Financials (TFS) and Energy (TEN) fell about 3.0%. The two are the largest component of the TSX Composite. The TSX continues to make what appears to us a potential double top. The trouble is, it is an awkward one with down-sloping necklines. The best one is for a breakdown under 20,200, a move that could project down to 18,300. Major long-term support is around 19,600. To the upside, the TSX needs to make new highs to end thoughts of a double top.
U.S. 10-year Treasury Bond/Canadian 10-year Government Bond (CGB)
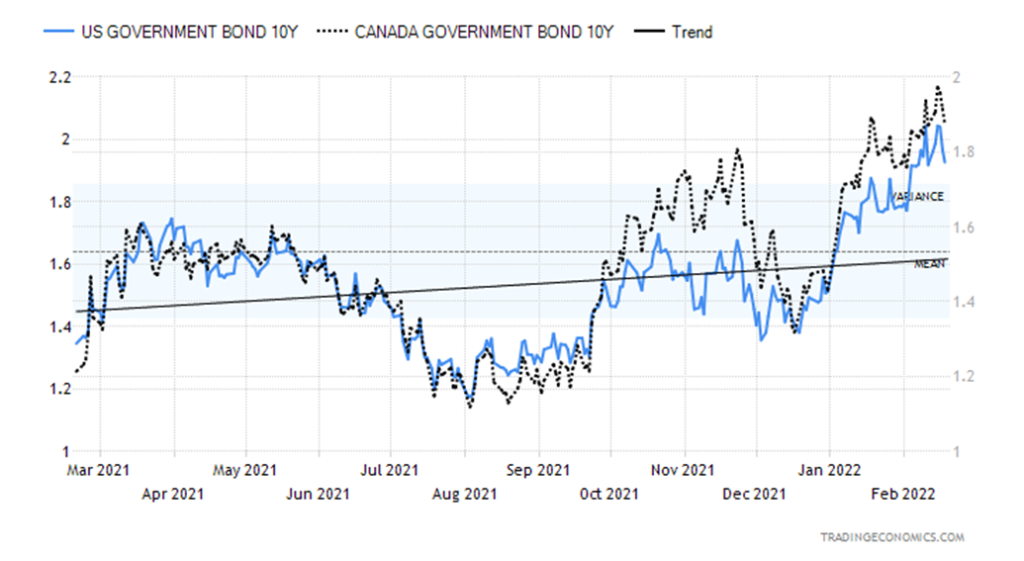
Bond yields held steady this past week with only minor movements while the 2–10 spreads slipped back. The U.S. 10-year treasury note rose 1 bp or 0.5%, the Canada 10-year Government of Canada bond (CGB) was up 3 bp. The U.S. 2–10 spread rose to 0.46% from 0.42% while the Canada 2–10 spread was up to 0.39% from 0.33%. For the moment bonds are in a holding pattern, down from the recent highs. Bonds are being volleyed to and fro with upward pressure coming from sharply rising inflation and fear of Fed discount rate hikes, and held lower on fears of a Russian invasion. Besides the PPI numbers discussed earlier, other numbers of importance out this past week included retail sales for January that unexpectedly jumped 3.8% when they only expected a 1.5% gain. That is odd given weak consumer sentiment. Year-over-year retail sales were up 13% which was actually below consensus of 15%. The number is not adjusted for inflation or population growth. Helping push sales higher as well is higher prices. Gasoline sales actually fell from the month before.
Industrial production for January gained 1.4% vs. an expected 0.3%, and capacity utilization was 77.6% vs. an expected 76.7%. Housing starts for January were 1,700 thousand vs. an expected 1,680 thousand, building permits 1,885 thousand vs. expected 1,790 thousand. Existing home sales were about as expected at 1,618 thousand. Despite stronger than expected numbers, it didn’t move the stock market much. And bonds waffled. Credit spreads continue to widen but they are not yet at any levels to get to concerned about. So far, it’s incremental, not raging. The 10-year is meeting some resistance here at 2%, but our expectation is we could break through. Under 1.88% the 10-year looks lower and under 1.77% the yield rally may be over and bonds are headed lower in yield (higher in price as prices move inversely to yields). Still, bonds remain a safe haven so if hostilities did break out then bond yields could fall.
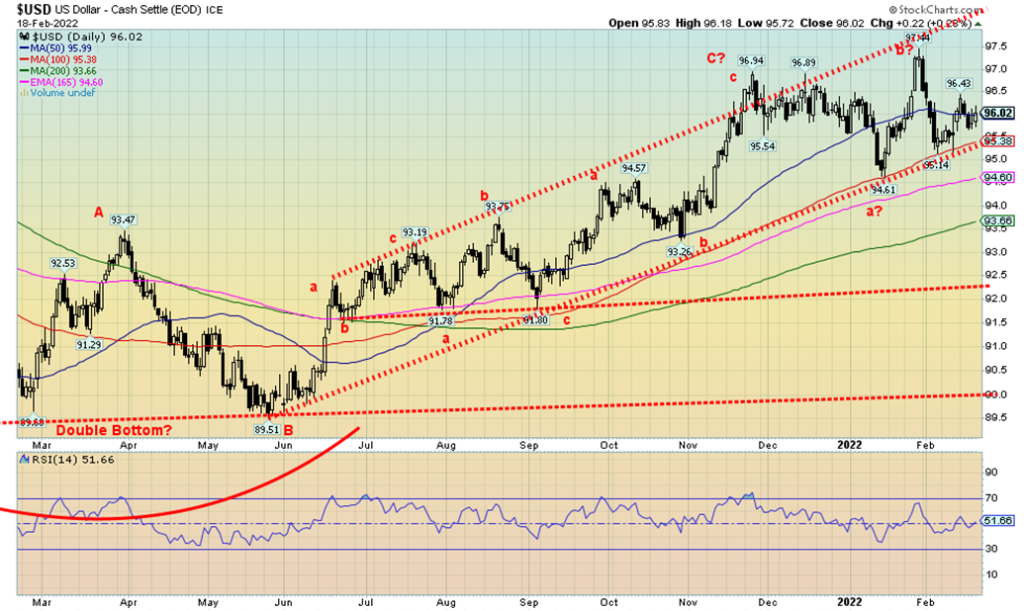
The US$ Index was essentially flat this past week, down 5 bp. The US$ Index is taking on the shape of a possible topping pattern with the spike to 97.44. We are now forming what might be a right shoulder of a possible head and shoulders pattern. The break is busted if we take out the left shoulder high of 96.94. But a break under 95.40 and especially under 95 might seal the deal that the US$ Index is going lower. With such a small movement in the US$ Index, it was no surprise to discover the other currencies barely budged as well. The euro was down about 0.2%, the Swiss franc up about 0.4% (a safe haven currency in the EU in the event of war), the pound sterling gained 0.4%, and the Japanese yen was up 0.2%. The Canadian dollar was also flat on the week.
The US$ Index has been trading around the 50-day MA for the past week. It appears poised to move lower. But given the Russian tensions, it could act as a safe haven for funds fleeing the EU. Taking out 96.50 to the upside would signal another advance towards 97. Once over 97 the highs might become the next target. Overall, the pattern appears bearish but we need confirmation with a breakdown under 95.40.
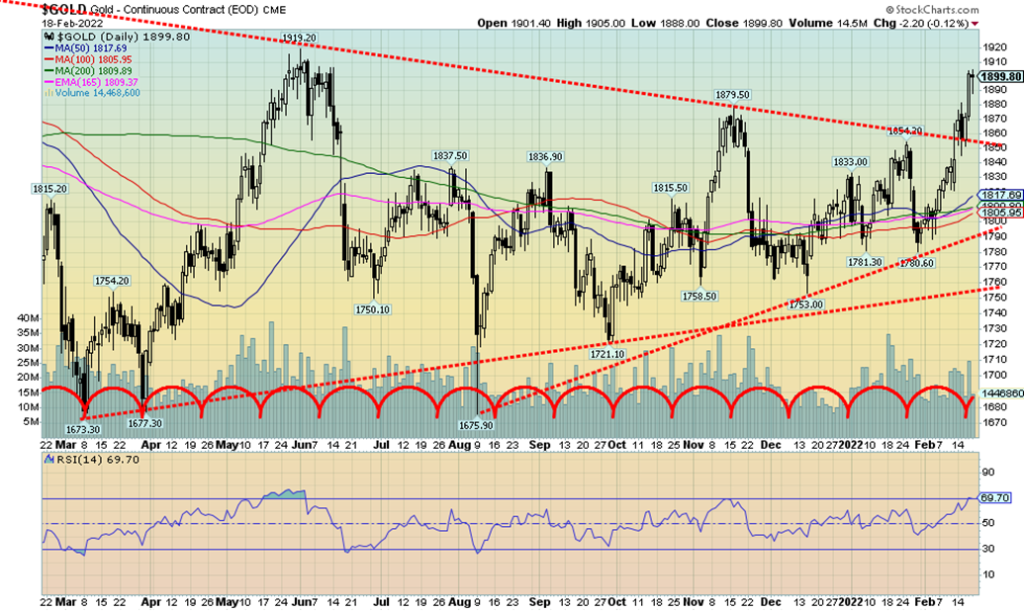
Gold is on the rise. It is a safe haven. Given the ongoing drama between Russia/Ukraine/U.S., gold has been a strong performer. Outside of oil prices, gold (and gold stocks) have outperformed the stock indices and even bonds in 2022. But like oil prices gold is responding to the ongoing drama in Ukraine on whether Russia will invade or not. The U.S. says they will; Russia says they won’t. But does the outbreak of hostilities in the Donetsk region where car bombs went off near the Donetsk region’s headquarters and shelling was going on between the two sides spark a Russian response under “right to protect”? The Donetsk region is the Ukraine’s most populous Oblast and is largely Russian speaking (75%) even as it is ethnically Ukrainian (59%). Former president Yanukovych received heavy support from the region along with the Luhansk Oblast (69% Russian speaking). The region is known as the Donbas. Both Oblasts are a part of the breakaway Donetsk People’s Republic and the Luhansk People’s Republic. Evacuation orders have been given to the civilian population to leave to Russia which borders the two breakaway republics. The region is the industrial heartland of Ukraine. If it looks like they will talk, gold pulls back. If it looks like they’ll invade, gold goes up. This is the third consecutive week of gains.
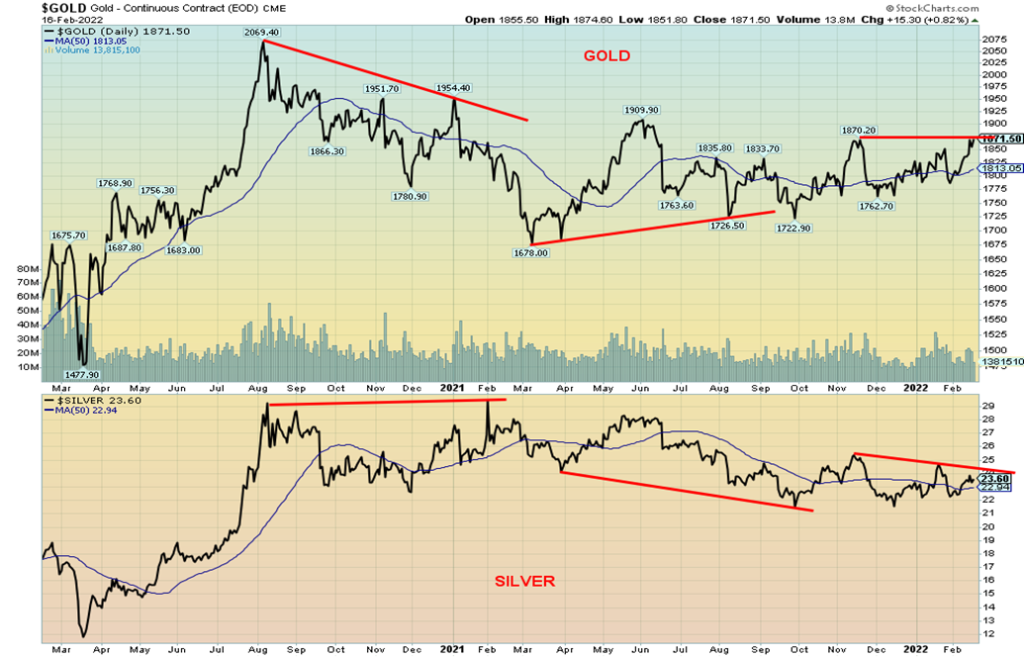
Gold has now ploughed through the highs of November 2021 and January 2022. We are approaching the next key resistance zone that ranges from $1,900 to $1,920 (May high was $1,919.20) and even up to $1,930. This is one of the last key areas to break through that could suggest that gold is on its way to $2,000 and new highs. Gold has broken the downtrend line from the August 2020 high. The subsequent triangle projects gold to rise to at least $2,250/$2,300. Some are projecting even higher. Gold is a hedge against inflation/deflation and
times of geopolitical and financial uncertainty. Right now, we have that in spades, all supporting gold’s rise. We are approaching overbought levels but then we can remain overbought for some time if this is a strong bull market.
This past week gold rose 3.1%, silver was up 2.7%, platinum gained 5.7%, and for the near precious metals, palladium was up 6.6% and copper gained 0.3%. The gold stock indices had nice gains with the TSX Gold Index (TGD) up 6.9% and the Gold Bugs Index (HUI) up 6.5%. Gold stocks are leading. Silver is lagging (examined below).
If gold successfully breaks out over $1,920/$1,930, then the odds increase that gold could make a new all-time high. Until then the zone remains a potential failure zone. Concern would rise if gold retreated back under $1,850. A breakdown could be underway under $1,790 and under $1,750 gold could challenge the March/August lows near $1,675. The cycles remain positive and the trend has turned firmly to the upside. We remain positive that gold prices are headed higher but remain wary until we break solidly through the $1,920/$1,930 zone. And that silver also starts printing higher highs.
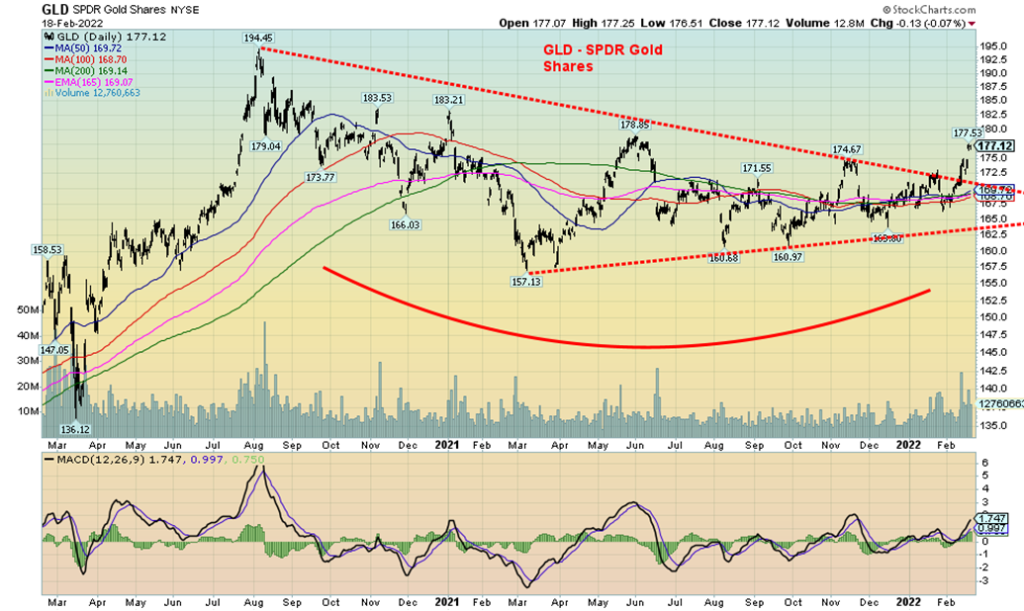
Here’s looking at gold from a slightly different perspective, even if it is the same thing. The SPDR Gold Shares (GLD-NYSE) is a proxy for gold through an ETF. GLD represents a share of gold bullion, unlike most ETFs which represent gold stocks. The GLD tracks the prices of gold/10. GLD does have vaulted gold in its custody, making the GLD one of the top ten holders of gold in the world. However, the GLD does not represent actually owning any gold. Investors own a proxy. GLD made a low in March 2021 as did gold but the secondary low in August 2021 saw gold make a clear double bottom just above the March low but the GLD made a distinct higher low. That offered some strength to the GLD proxy. The GLD has now broken out of its downtrend line from the August 2020 top. GLD is up 12.7% from its March 2021 low vs. gold up 13.5%. The MACD is just now starting to turn up, suggesting that we could have further to go here. The huge triangle pattern has a potential target of least 207 which would be new highs.
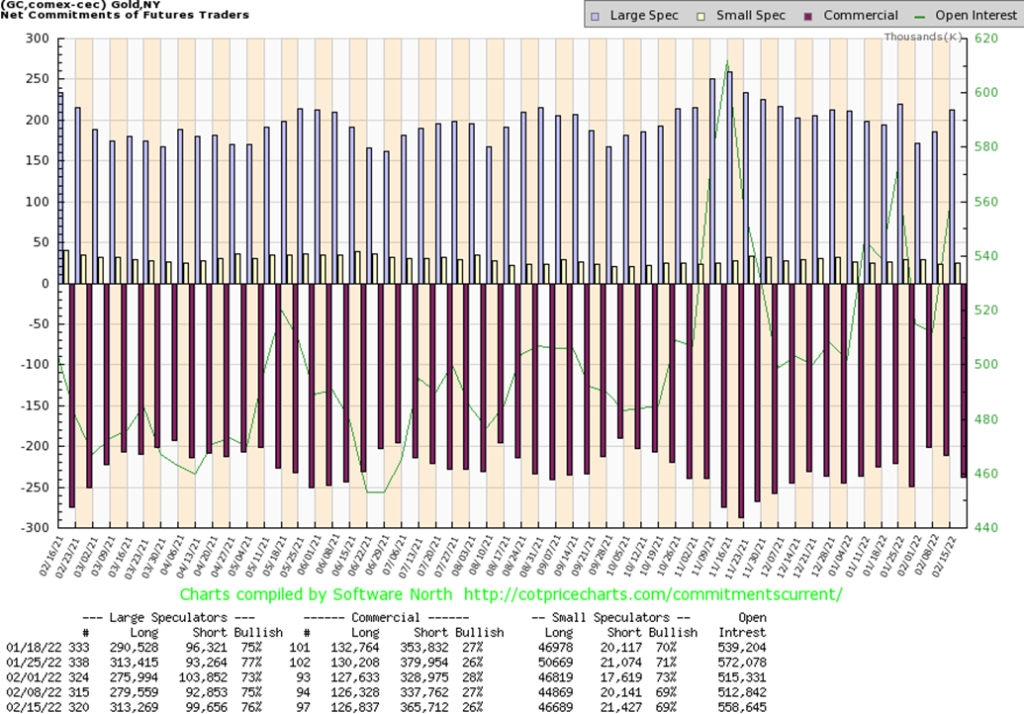
The gold commercial COT (bullion companies and banks) slipped this past week to 26% from 27%. Not a surprise really as the commercials seem to add to shorts every time gold goes up, and then they cover on the subsequent plunge. This past week their long open interest position was relatively flat, but short open interest jumped roughly 28,000 contracts. Also, not a surprise that the large speculators (hedge funds, managed futures, etc.) added to longs as their COT rose to 76% from 75%. Large speculators long open interest rose roughly about 34,000 contracts even as short open interest rose about 7,000 contracts. Overall open interest rose roughly 46,000 contracts on a week that gold was up. That’s all good so we won’t get too concerned about the rise in gold’s commercial COT just yet.
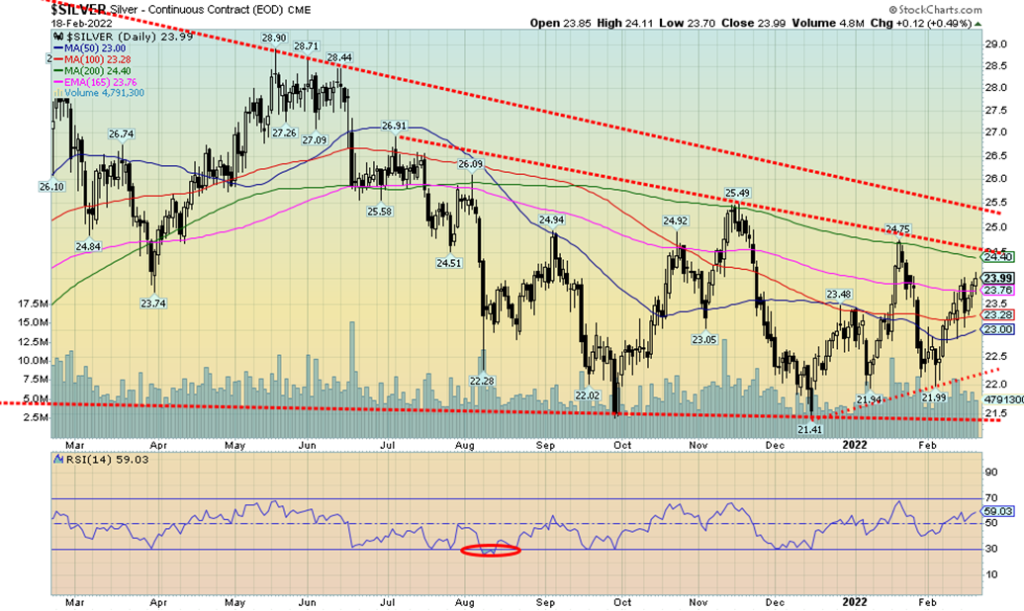
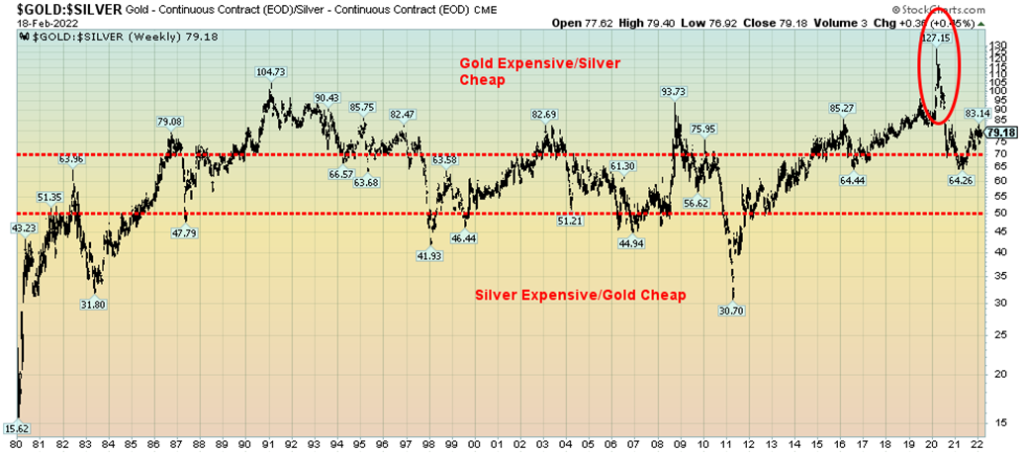
Silver is lagging and that has us a little concerned. While gold prices have ploughed through November 2021 and January 2022 highs, silver has not. Don’t even think about the highs seen in May 2021. This divergence between gold and silver with gold making new highs and silver lagging considerably is a concern. We’ve seen these divergences in the past. In 2021 silver made new lows while gold did not. The markets moved higher. In 2020 silver made a new high (in February 2021) but gold did not. That led the market to move to the downside. (See chart on next page.) In a bull market, silver should be leading to the upside. It isn’t. Silver did gain 2.7% this past week but gold was up 3.1%. Could it be that the market is focused only on gold as a safe haven? While ignoring gold’s poor cousin silver? The gold/silver ratio is stuck at an ungainly 79.18, maintaining the advantage of gold over silver (see chart on next page). By numerous measurements gold is expensive vis-à-vis silver. Since 2013 that has been the prevailing position as gold has consistently outperformed silver over time.
Silver has resistance up to around $24.40/$24.50. A break over that level could send silver to the next resistance zone near $25.50. Once over that level silver starts to brighten. To the downside $23 appears to be forming support. But a break under that level could send silver down to $22.75. A break under that level would have us looking at the December low of $21.41 and wondering whether there would be more downside below that level.
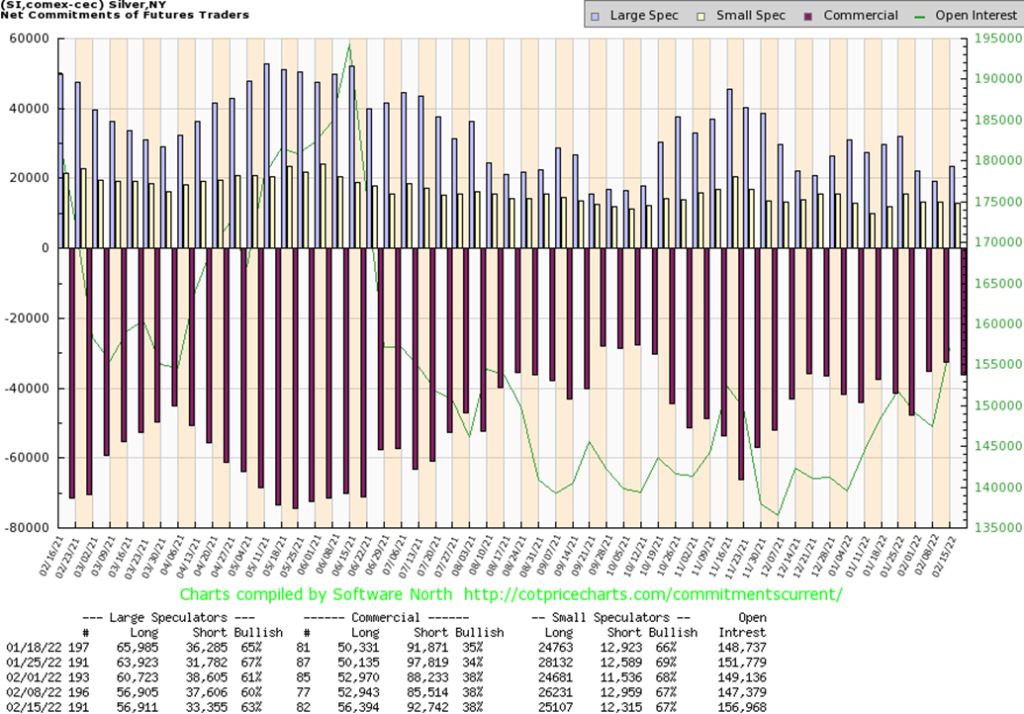
The silver commercial COT remained steady this past week at 38%. However, both long and short interest rose. Long open interest rose just under 4,000 contracts while short open interest was up about 7,000 contracts. The large speculators COT rose to 63% from 60% as the large speculators cut their short open interest position by just over 3,000 contracts. Overall open interest rose over 9,000 contracts on the week, a week that saw silver prices rise. Despite the slippage with short open interest, the silver COT remains positive although not as positive as we would like. But it hasn’t turned bearish, either.
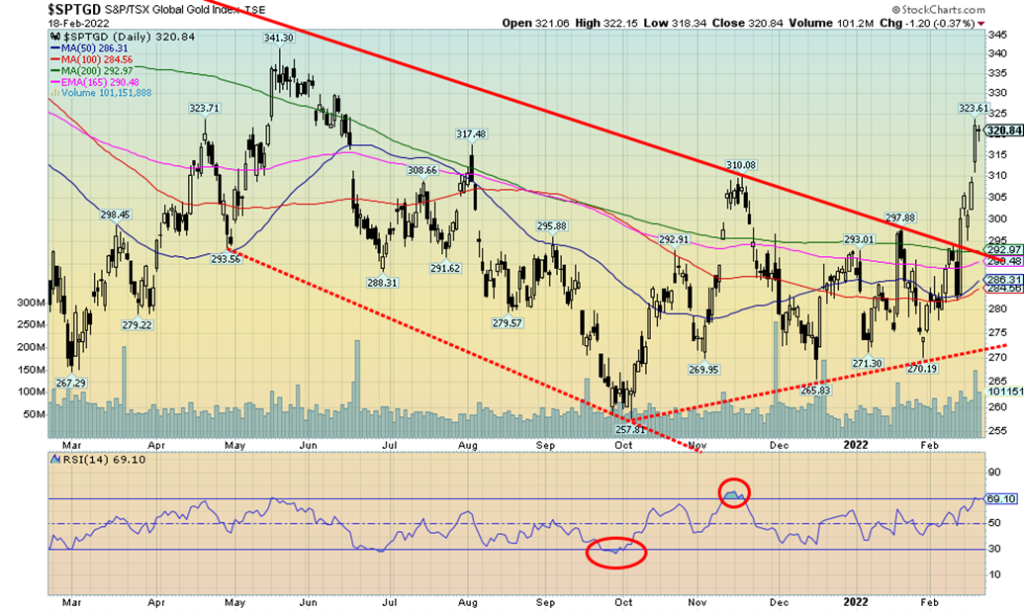
It was another stellar week for the gold stocks as the TSX Gold Index (TGD) gained 6.9% and the Gold Bugs Index (HUI) was up 6.5%. In a hurry, the TGD is now up 18.7% from the early January low. We have also broken out above a downtrend line coming from the August 2020 top at 416.84. Nonetheless, the TGD is still down 23% from that high. But it is key that we took out a number of recent highs and broke the downtrend line. The next one visible on the charts is to break out over 341 the high in May 2021. The gold stocks appear to be leading both the price of gold and silver. We view that as positive. In strong bull markets the gold stocks (along with silver) should lead. In bear markets it is the opposite. They lead down. The TGD did form what appears as a symmetrical triangle. It has objectives up to 345/350. If there is a concern, it is that the market has moved very fast in a short period. That quickly leads to overbought conditions, thus giving rise for a pullback. If one occurs, it could at its steepest test the break line near 290/292. Interim support would be at 310. The Gold Miners Bullish Percent Index (BPGDM) is only at 46.67, suggesting it has room to move higher. The Gold Miners New Highs-New Lows Index is quite neutral so it too has considerable room to move higher before it becomes overbought.
We remain bullish for the gold stocks and we continue to expect them to lead gold higher. However, periodic, even sharp pullbacks would help keep the market healthy. The TGD is up 9.8% thus far in 2022, the second best performing TSX sub-index behind the TSX Metals & Mining Index (TGM), up 11.6%.
Russia is going invade! Well, maybe not. Then again, maybe they will. Up go oil prices, hitting a 52-week high at $95.82. Then into the picture comes Iran. Yes, Iran, the world’s fourth largest oil reserves and ninth largest oil producer; the world’s second largest natural gas (NG) reserves and third largest producer. It appears they might sign the new nuclear deal. Down go oil prices, at one point falling about 9% from the recent high. Then President Biden said Russia is going to invade and up went oil prices again.
If your head is spinning from the volatility and confusion over what is going on, then you should try saying Russia is going to invade and Iran is going to sign, all in the same breath. It was an outside reversal week for oil
prices as they put in a fresh 52-week high, then reversed and made a lower low than the previous week and closed down 3.1%. Natural gas (NG) went in the opposite direction, gaining 11.2% but closed down 8.6% from the high of the week with the hint that Iran might sign. An outside reversal week for oil; a possible key reversal week? When WTI oil broke under $89/$90, the expectation was that we could go down and test stronger support at $80/$82.
Instead, we closed back over $90, suggesting that we could instead be poised to move higher again. Geopolitical risk. That is what is really moving oil prices. If Russia invaded and sanctions were tightened, Europe could find its oil and gas supply cut. There is insufficient capacity to come anywhere near replacing what would be lost. If Iran signs, then oil could be flowing from there by Q3, thus lessening the needs elsewhere. However, we point out that Iran’s signing is not a done deal. While the number of rigs operating in the U.S. keeps rising, the U.S.’s reserves are at their lowest level since the early 2000s and they need replenishing.
Neither Iran nor Russia is going to cooperate, so the odds are that the volatility could continue. Not helping were clashes in the Donetsk region between breakaway rebels and Ukrainian forces. Two car bombs went off near the offices of the Donetsk provisional government. Many are still expecting oil to reach over $100. We continue to have a target up around $108.
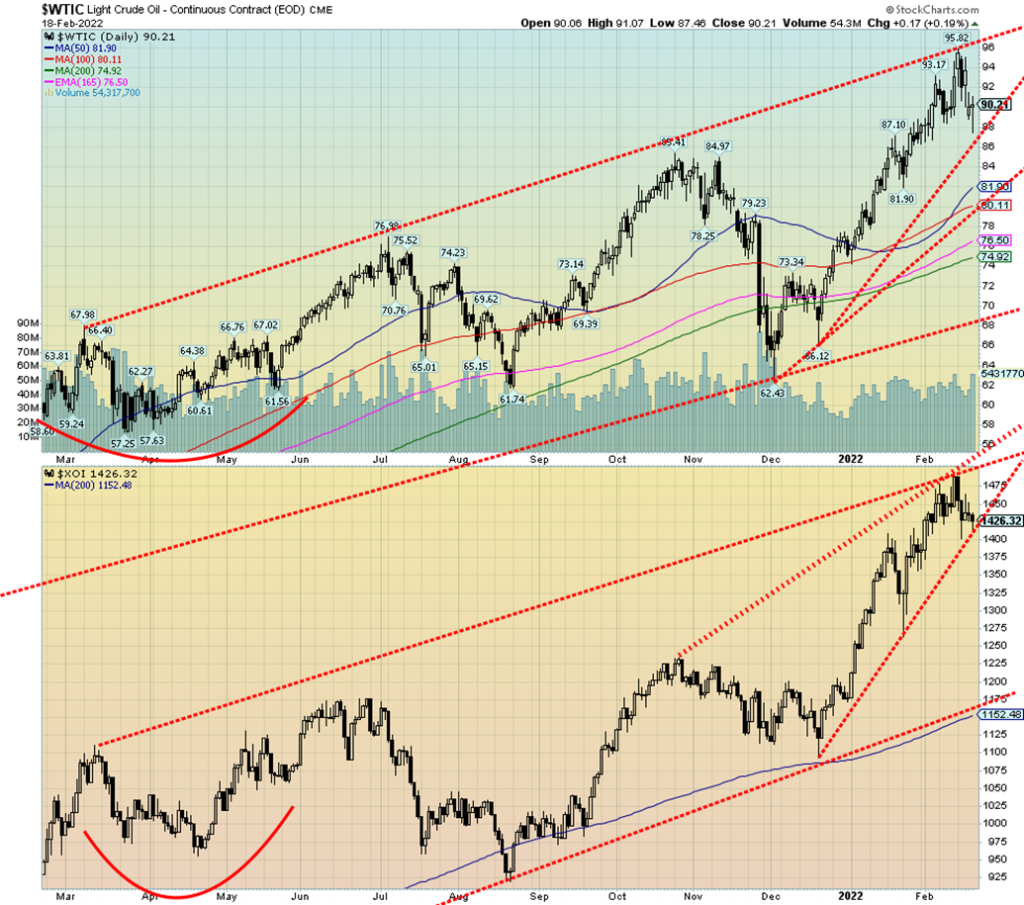
Once again, our focus has to be on the $89/$90 support zone for oil. The support could now trend down to $88. But below $88 we’d most likely test $80/$82. The commercial COT for oil has been slowly rising, suggesting the oil companies and banks continue to believe that oil prices will rise further. Bears are a lonely group. But the pullbacks like we saw this week keep WTI oil from becoming too overbought and keep everyone guessing.
The energy stocks didn’t fare well this past week, falling in sympathy with oil and with the broader stock market. The ARCA Oil & Gas Index (XOI) fell 4.2% this past week while the TSX Energy Index (TEN) was down about 3.0%. The XOI is at trendline support, but a break of 1,425 and especially under 1,400 could send the index lower towards better support at 1,300.
We remain bullish on oil, subject to these sharp pullbacks to ease overbought conditions. If this truly was a reversal week then we’d need to see more downside this coming week to confirm. If instead we go higher, then the bull is alive as is $100+ oil. What will Russia do? What will Iran do?
__
(Featured image by Alex343 via Pixabay)
DISCLAIMER: This article was written by a third party contributor and does not reflect the opinion of Born2Invest, its management, staff or its associates. Please review our disclaimer for more information.
This article may include forward-looking statements. These forward-looking statements generally are identified by the words “believe,” “project,” “estimate,” “become,” “plan,” “will,” and similar expressions. These forward-looking statements involve known and unknown risks as well as uncertainties, including those discussed in the following cautionary statements and elsewhere in this article and on this site. Although the Company may believe that its expectations are based on reasonable assumptions, the actual results that the Company may achieve may differ materially from any forward-looking statements, which reflect the opinions of the management of the Company only as of the date hereof. Additionally, please make sure to read these important disclosures.
David Chapman is not a registered advisory service and is not an exempt market dealer (EMD) nor a licensed financial advisor. He does not and cannot give individualised market advice. David Chapman has worked in the financial industry for over 40 years including large financial corporations, banks, and investment dealers. The information in this newsletter is intended only for informational and educational purposes. It should not be construed as an offer, a solicitation of an offer or sale of any security. Every effort is made to provide accurate and complete information. However, we cannot guarantee that there will be no errors. We make no claims, promises or guarantees about the accuracy, completeness, or adequacy of the contents of this commentary and expressly disclaim liability for errors and omissions in the contents of this commentary. David Chapman will always use his best efforts to ensure the accuracy and timeliness of all information. The reader assumes all risk when trading in securities and David Chapman advises consulting a licensed professional financial advisor or portfolio manager such as Enriched Investing Incorporated before proceeding with any trade or idea presented in this newsletter. David Chapman may own shares in companies mentioned in this newsletter. Before making an investment, prospective investors should review each security’s offering documents which summarize the objectives, fees, expenses and associated risks. David Chapman shares his ideas and opinions for informational and educational purposes only and expects the reader to perform due diligence before considering a position in any security. That includes consulting with your own licensed professional financial advisor such as Enriched Investing Incorporated. Performance is not guaranteed, values change frequently, and past performance may not be repeated.


Youth Cannabis Use in Colorado Is Falling — But the Full Story Is More Complex
The 2026 Colorado survey shows teen cannabis use fell to 10 percent in 2025, down from 21 percent in 2015....


Morocco’s Growth Holds at 4.6% as Agriculture Offsets Economic Pressures
Morocco’s economy grew 4.6% in Q1 2026, driven by a strong agricultural rebound offsetting declines in industry. Services expanded moderately...


Abivax Shares Surge as New Trial Data Eases Safety Concerns Over Ulcerative Colitis Drug
Abivax shares surged nearly 36% after positive updated trial results for its ulcerative colitis drug obefazimod reassured investors following earlier...


El Dorado Raises $9M to Expand Cross-Border Fintech Platform
El Dorado, a Latin American fintech improving cross-border financial services, raised a $9 million Series A led by Paradigm with...


Bitcoin Stalls Near $60K as Strategy Moves, ETFs Outflow, and EU MiCA Rules Take Effect
Bitcoin hovers near $60,000 with ETF outflows, while Strategy boosts reserves, sells BTC, and raises dividends to reassure investors. Ethereum...
 |
|
 |  |
 |
|
-

 Biotech2 weeks ago
Bavarian Biotech Sector Expands with Record Funding and Startup Growth in 2025
-

 Africa2 days ago
BOAD Approves Major Funding Boost to Drive West African Development
-

 Business1 week ago
Markets Diverge as Oil Falls, Rates Hold, and Inflation Persists
-

 Impact Investing6 days ago
Coastal Cities Lead as Heat Strains Italy’s Urban Livability