Featured
The past 10 years have been a market anomaly
The gold market advanced from September 30 from 254 to 260 at the end of the week. There are only six steps, but for a sum of steps, it is a good move during a twenty-five-day sample. More importantly, since September 30, the price of gold has continued its upward step, advancing by $ 42.72 in the last twenty-five days of trading, closing at the end of the week above its BEV -20% line.

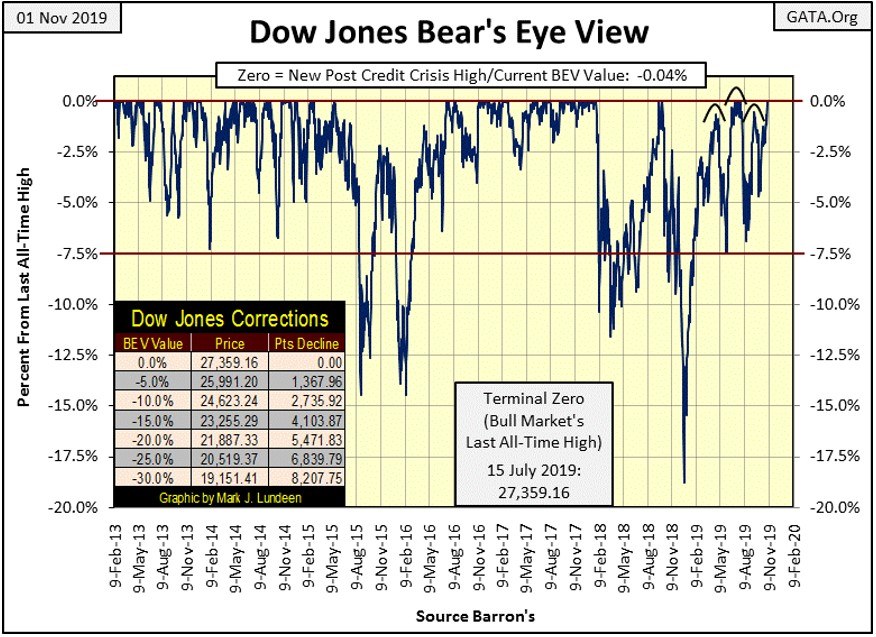
What a tease the Dow Jones has become to the bulls; it closed the week only 0.04% from its last all-time high of last July, only eleven points short of making market history.
It’s important to note the Federal Reserve cut its Fed Funds rate 0.25% this week, and still, the tired old bulls couldn’t get the Dow Jones into the new all-time high territory. Well maybe next week, and then again maybe not.
As seen below, the Dow Jones with its 52Wk High line (Green Line) hasn’t done much since January 2018. It did rise up to new all-time highs in October of last year and again in July of this, making four new 52Wk Highs (all-time highs) on each occasion. But unlike before January 2018, the bulls on both attempts failed to push the green 52Wk High line up by much.
Since January 2018 (two years) the Dow Jones has advanced by only 2.75% as of the close of this week. So, should the Dow Jones see a few new all-time highs in the weeks to come, exactly what would that promise hold for the bulls?
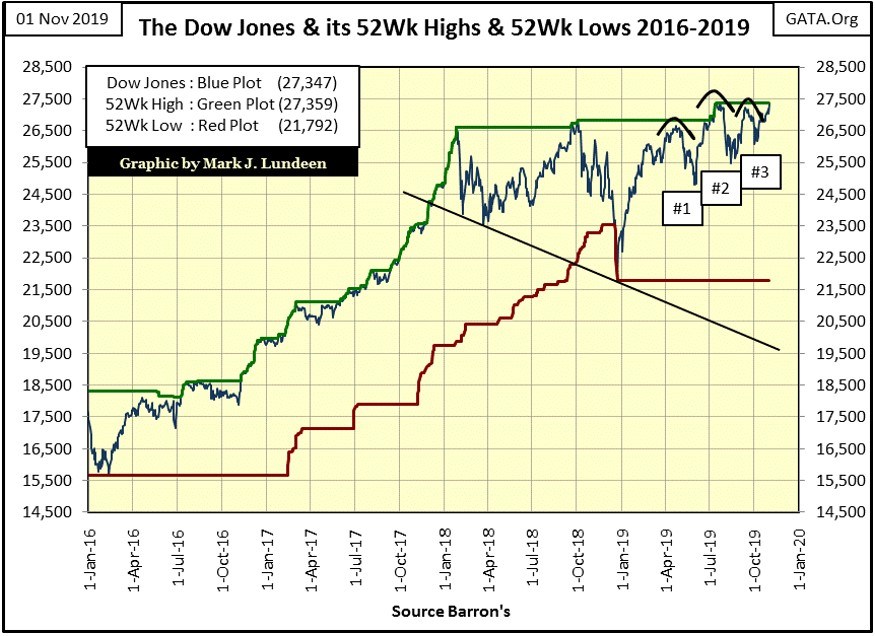
As I said in my last article, this is actually a very bullish chart formation, a two-year basing pattern that suggests the Dow Jones is on the verge of something big. We got the big 18% correction from last December followed by three ascending bottoms. And now the Dow Jones is once again at the threshold of breaking into record territory; what more could someone like me ask for?
Well, first of all, we should note the Dow Jones is at the tail-end of a ten year / 21,000 point advance, with every point of this advance propelled by the horrendous monetary inflation (QE1-3) seen in the chart below.
That doesn’t bother the MSM’s “market experts”, but I’m not a market expert. So I’m not inclined to commit myself to say whether the Dow Jones is on the verge of breaking up above 30,000 when I know damn well it could just as easily break down into its most significant market deflation seen since the 1930s.
Potentially, in November 2019 and beyond, the Dow Jones in 2020 could fulfill either market scenario.
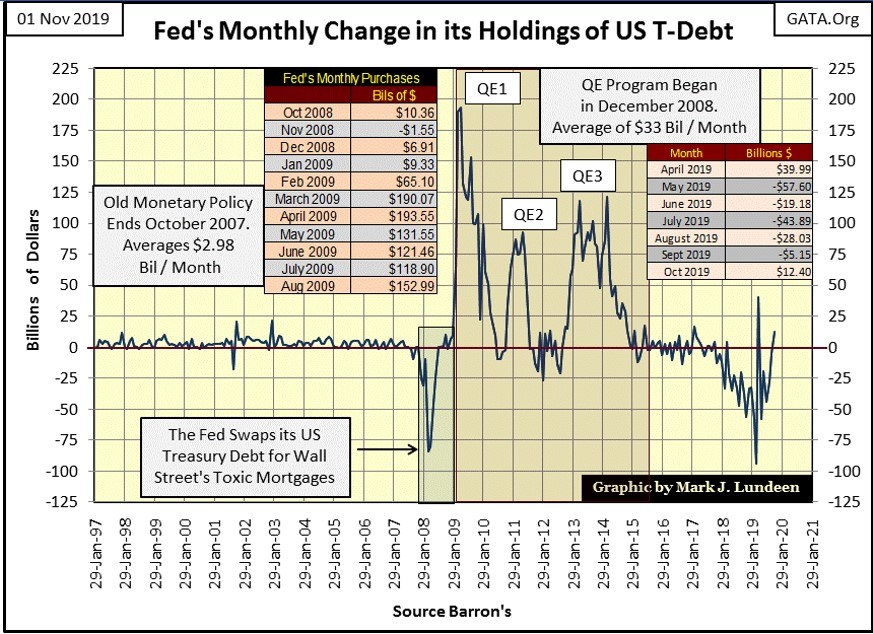
Look what the Federal Reserve did in October 2019; it monetized $12.40 billion in Treasury Debt. That’s no way for the Federal Reserve to “Quantitatively Tighten” its bloated balance sheet.
That, plus it has been “injecting” tens of billions of dollars of monetary inflation into the over-night repo market to keep the banking system alive. Let’s call that what it actually is – a morphine drip to prevent the banking system from doing something everyone will regret.
Is it a coincidence in the chart above the Federal Reserve began its program of quantitative tightening (QT) in January 2018, just as the Dow Jones terminated its post-November 2016 presidential-election advance?
No it’s not.
Now it appears the Federal Reserve is terminating its QT and beginning another round of QE. So I can’t rule out seeing the Dow Jones far above its 30,000 lines in the coming year should the Federal Reserve continue “injecting liquidity” into the financial system.
But the Federal Reserve is also “injecting” massive amounts of monetary inflation into the overnight repo market. It wouldn’t do that if it didn’t have to, and that means the banks are once again in trouble.
If the banking system’s solvency issues become public, as they did in 2008, and deflation becomes the drum markets begin marching to, we can kiss goodbye any hope of a market advance for the next few years.
So what is it to be in 2020 – inflation or deflation dictating market trends for the year to come? I don’t know, so I’m out of the general stock market.
But this week saw some nice gains in major market indexes. In the table below, showing their daily BEV values, some saw multiple BEV Zeros, aka new all-time highs. But once again, the Dow Jones refused to join the party; it hasn’t seen a BEV Zero since mid-July of last summer.
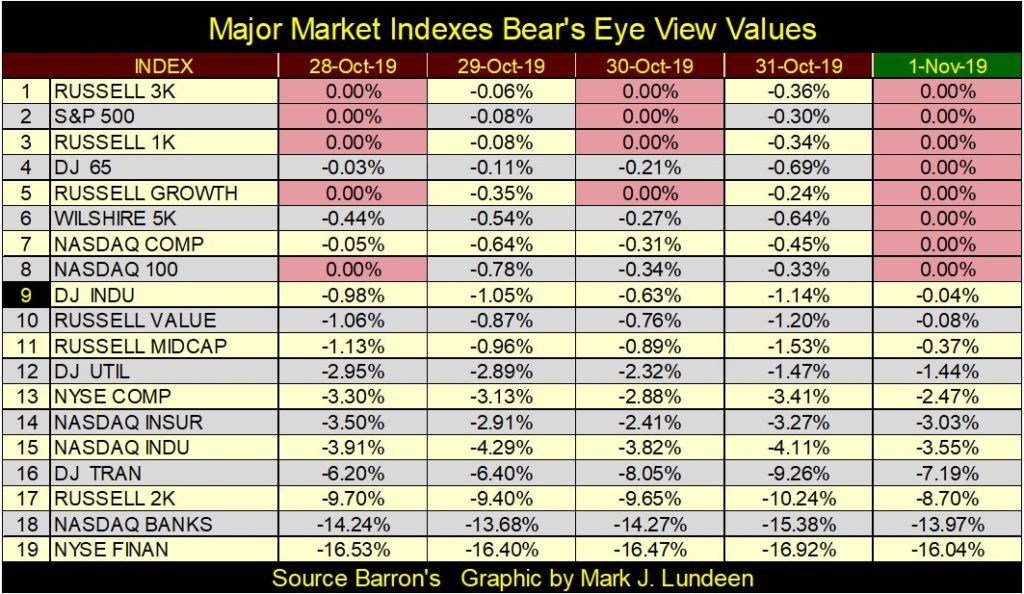
At the bottom of the table (#18 & 19), we find the NASDAQ Banks and the NYSE Financial Indexes down double-digit percentages from their last all-time highs.
The NYSE Financial Index hasn’t seen a BEV Zero since June 2007, over twelve years ago. So the Dow Jones may be soaring high above its lows of March 2009, but not so the major financial companies tracked by the NYSE Financial Indexes.
After a decade, and trillions of dollars of “liquidity injections” from the Federal Reserve, these financial companies still haven’t recovered from the trauma of the sub-prime bear market of 2007-09 (chart below).
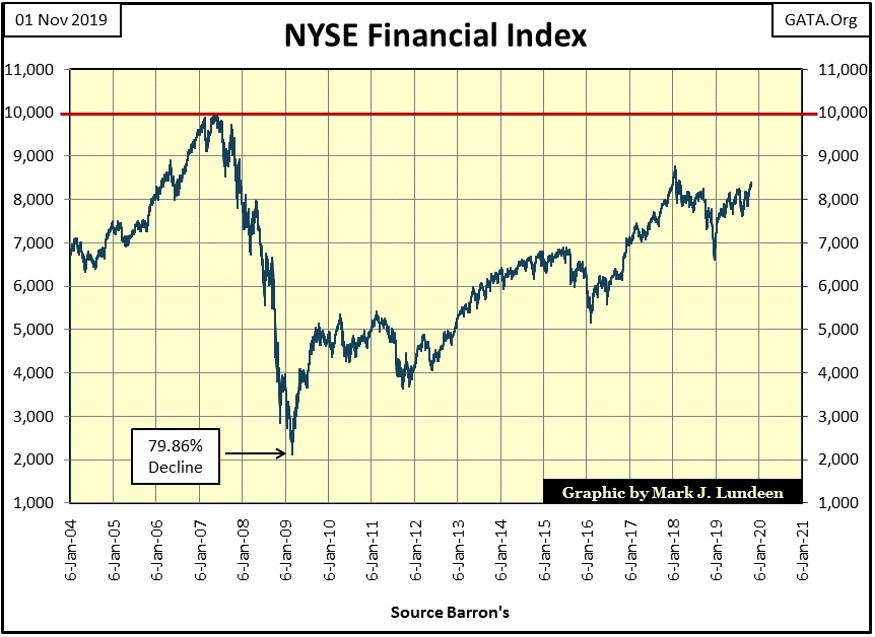
The NASDAQ Banking index saw its last BEV Zero (all-time high) in June 2018. But seeing a banking index ending the week back with the perennial bad boys comprising the NYSE Financial index isn’t a reassuring fact of life as 2019 draws to a close.
Let’s compare the Dow Jones of the Roaring 1920s with that of its post-sub-prime mortgage crisis advance in their frequency distribution tables for their BEV values below. For the 1920s, its 20 September 1921 market bottom (-46.58% bear-market bottom) is very much like the 09 March 2009 -53.78% bottom.
So, in each table, we’re looking at the Dow Jones advance off a major market bottom. This makes the early BEV Zeros new highs-of-the-advance until the Dow Jones actually broke above their all-time highs of the previous bull market tops.
During the 1920s advance, as is the case for the post 09 March 2009 advance, neither saw a daily market decline of over 20% during their market corrections: (-20% Rows). But the 1920s advance saw 92 days with market corrections between -15% & -19.999%, while our advance has seen only 11 such days.
Looking at their 0% rows (BEV Zeros = new all-time highs), the 1920s saw the Dow Jones at this lofty level for 14.32% of the total days of its advance, while our advance saw only 13.79% of its total days closing at a BEV Zero.
But their -0.000001% rows (daily closings just short a BEV Zero down to -4.999% from one) are telling. By 03 September 1929, the day the 1920s’ advance saw its terminal BEV Zero (or Terminal Zero / TZ), 53.15% of the daily closings of the 1920s advance were within 5% of a BEV Zero.
Add that to the 0% (BEV Zero) row and we see that during the 2382 days of the Roaring 1920s bull market, the Dow Jones was at or within 5% of a new all-time high for 67.47% of its daily closings.
That’s bullish but not as bullish as our advance! When adding the daily BEV values given in our 0% & -0.000001% rows in the table below, we discover that 78.02% of the daily closing since 09 March 2009 have been at or within 5% of a new all-time high.
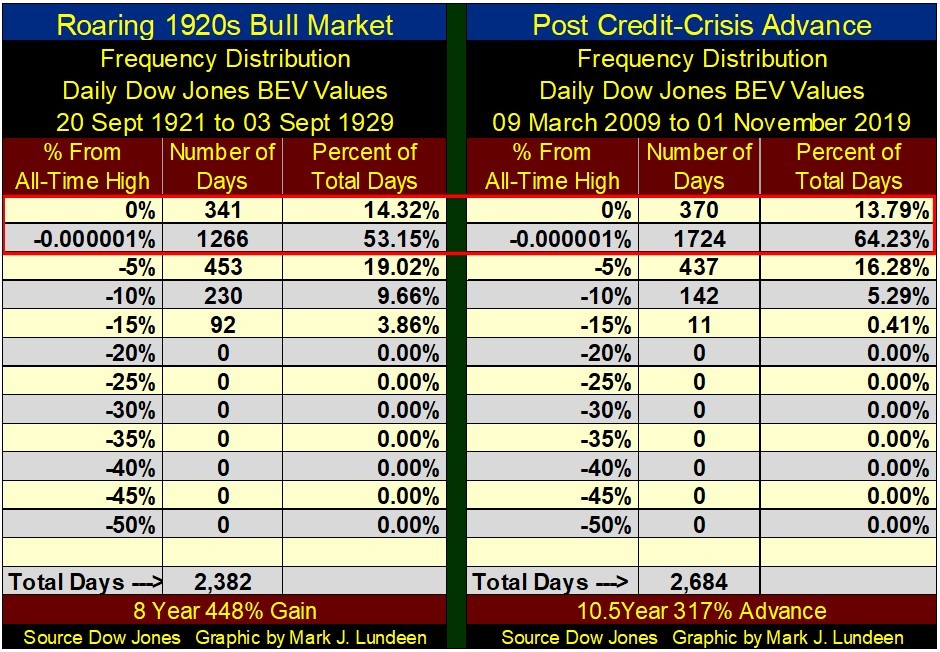
Still for all of that, during the Roaring 1920s bull market the Dow Jones advanced by 448%, while our advance has seen the Dow Jones advanced by only 317%. After Doctor Bernanke’s three QEs, that seems a bit odd to me.
To compare our current Dow Jones advance to a more realistic model of stock market performance, below I’ve compared it to the Dow Jones from 02 January 1900 to the end of December 1999 – the 20th century.
Within the Red Box (the BEV Zero & the -0.000001% rows) the Dow Jones closed at a BEV Zero or within 5% of one in only 26.65% of the last century’s daily closings.
So, the current market advance is an anomaly, and by definition, anomalies can’t continue forever.
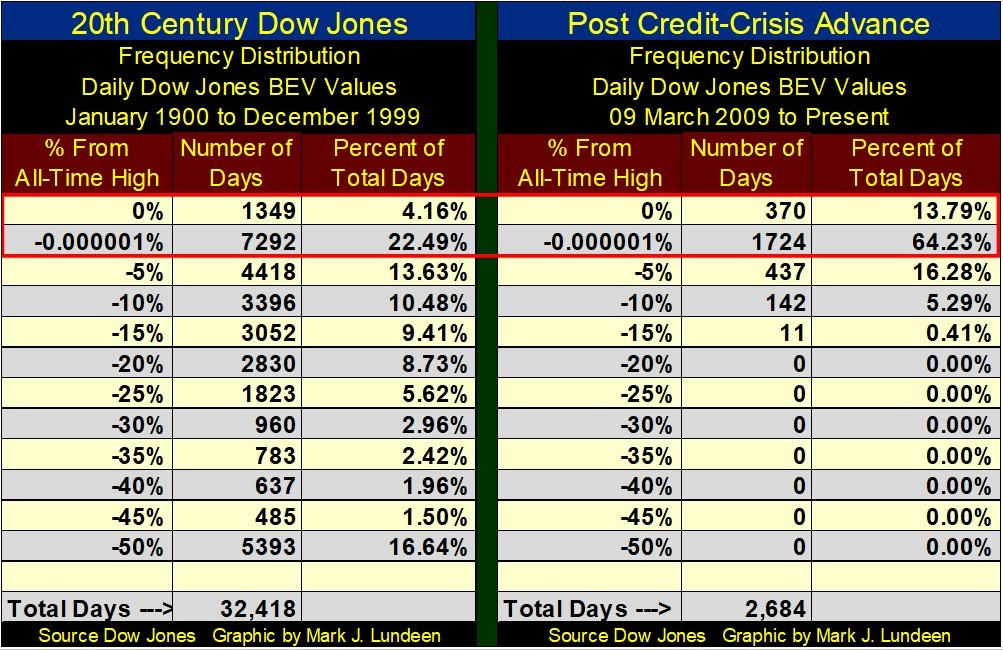
Greg Hunter interviewed Mike Pento last week. After listening to what Mr. Pinto had to say about the stock and bond markets and pending problems in the banking system, one has to wonder how much longer the drug-store cowboys at the FOMC can keep this up? That plus how much longer will the Dow Jones’ current BEV frequency distribution table above continue seeing 0 days in its BEV -50% row.
Michael Pento also has some very positive things to say about gold. In today’s market, a market pregnant with tens-of-trillions of dollars of counter-party failure, how could he not give that gold and silver are pure assets, free from even the possibility of counterparty failure?
Gold at week’s end closed above its BEV -20% line; that’s good. Look at the two significant corrections in gold in 2019, which I circled in the chart below. Correction #1 spans from last winter to early summer and was deeper than our current correction (#2) which began in early September.
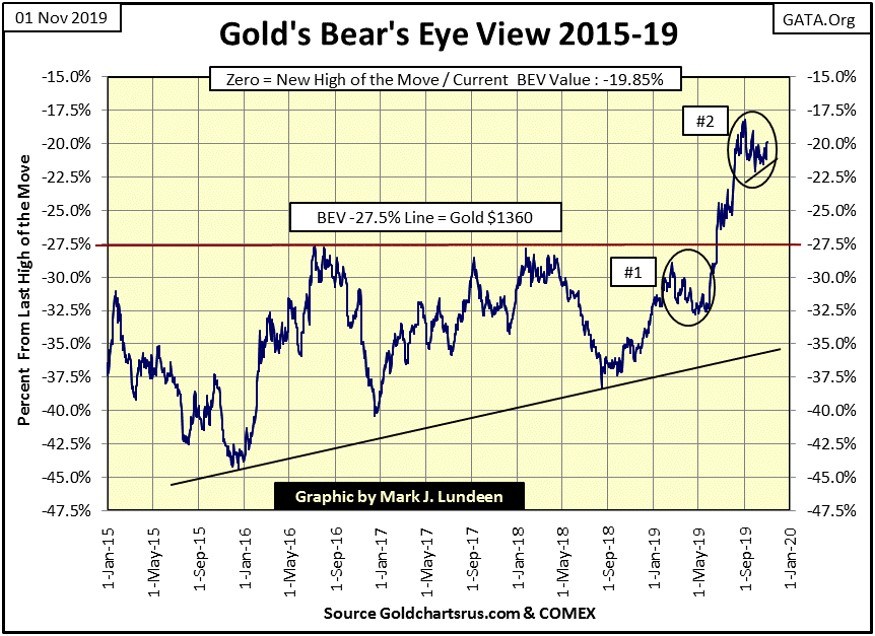
If one looks at these charts long enough, one gets a feel for things to come. These feelings can be wrong, but one gets them none the less. Seeing gold break above its BEV -20% line at the end of this week tells me gold’s current correction (#2) is almost completed, that in the weeks to come gold will once again resume the advance it began from its December 2015 bottom.
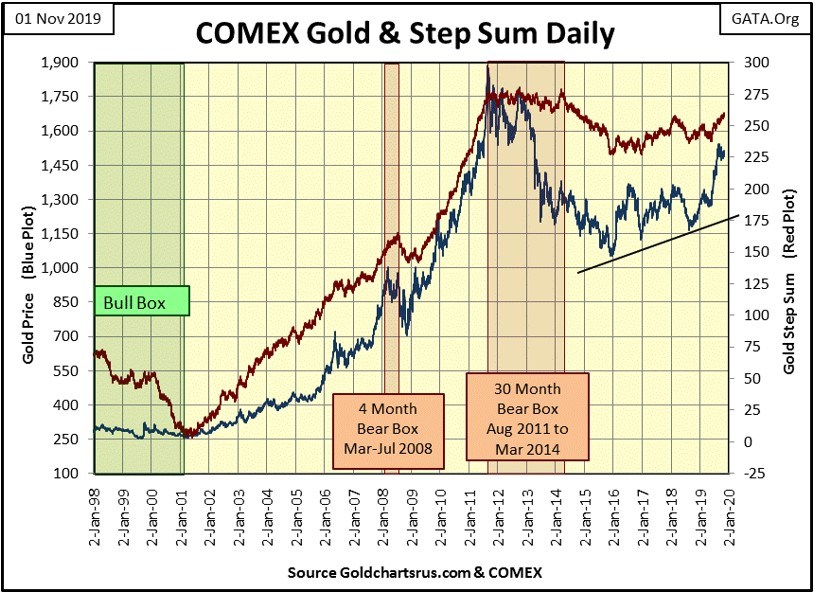
Moving on to gold and its step sum chart below, we see the bear box gold that began in mid-August is still in place. Remarkably, after three months the bears have failed to claw back much of gold’s gains of the year.
The thing about a step-sum BEAR box is that usually, it’s the bears that ultimately are proven right. So since this correction began about three months ago in August, why hasn’t the price of gold declined below $1450? That’s plenty of time for the bears to have taken gold below $1400 – if they could.
Seeing gold’s step sum (market sentiment) continue to rise as the price of gold itself (market reality) stalls for a few months suggests that maybe this time the bulls are right to be bullish, that this bear box is going to FAIL. That would be okay with me.
The Dow Jones and its step sum are seen below. Technically the Dow Jones is poised for higher prices, so why has the Dow Jones’ step sum stalled, flat-lined since September 9th when it broke above 1540?
Now in early November, market sentiment as measured by the Dow Jones’ step sum isn’t all that excited about the prospects of the Dow Jones going on to new all-time highs.
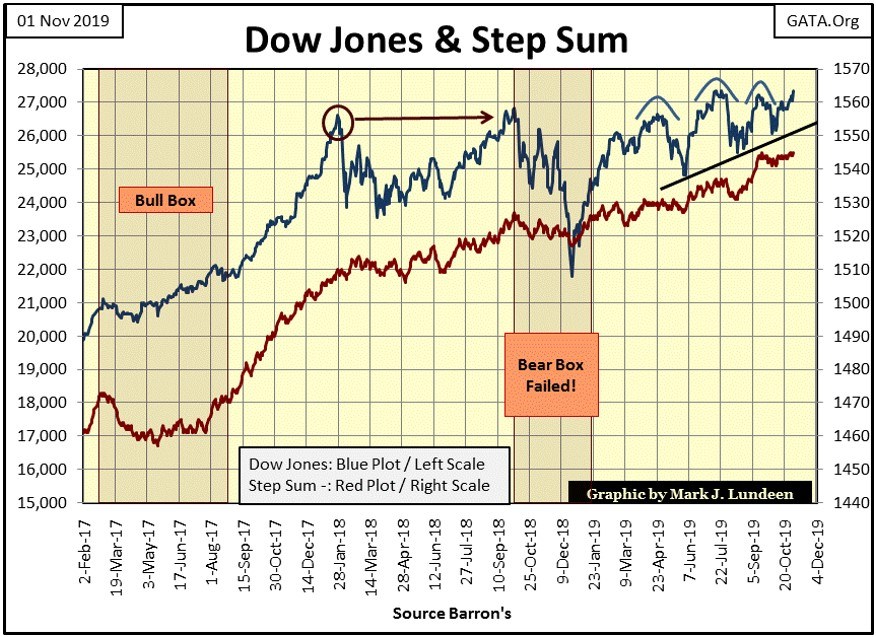
If I shortened the time-line of the chart above to show only 2019, I could identify a step sum BULL box from September to today. And the thing about a step sum BULL box; typically it’s the bulls that are proven correct. But like bear boxes, bull boxes can fail too.
Moving on to gold and the Dow Jones step sum tables below, we see how gold’s step sum has advanced since September 30th from 254 to 260 at the end of the week. That’s only six steps, but for a step sum that’s a nice move during a twenty-five-day sample. More importantly, since September 30th the price of gold has followed its step sum up, advancing by $42.72 in the last twenty-five trading days.
Looking at gold’s 15 Count, we see values from +3 to -3. Seeing a 15 count between +3 and -3 is only market noise from which a price series, like gold or the Dow Jones, could be advancing or declining. When we see a 15 count at a +5 or more, it’s a short term signal the market is overbought, so we should expect a correction in the price series.
We see what happened with gold’s 15 counts below, where on October 9th gold saw a +5, and in the following days, the price of gold retrenched. The higher the 15 count goes (+7 to +15), the stronger the signal is that the market is going to see a short-term correction.
The same can be said with negative 15 count values, but with opposite market reactions for counts of -5 to -15.
Volatility for gold is subdued, increasing from 0.58% to 0.59% this week. I’m looking forward to when gold’s volatility breaks above 1%. That will indicate money is flowing from the stock and bond markets into gold and silver. Give it time and we’ll see this happen.
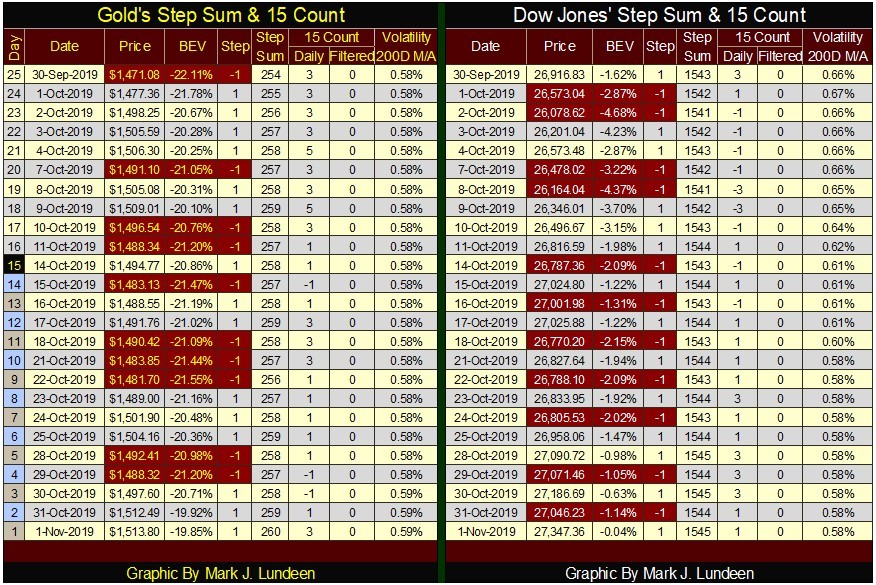
Not much to say about the Dow Jones’ step sum table except to note the Dow Jones is at the cusp of a new all-time high, as its volatility has contracted by 0.08% since September 30th.
That its 15 counts for the past twenty-five days has remained between +3 & -3 tells us the Dow Jones hasn’t been overbought or oversold in the past month, a big point in favor for the bulls.
Keep in mind I’m someone who has chosen to focus on the dark clouds in front of the market’s silver lining. But not one of my valid bear market considerations is going to matter until the day comes when they do.
Want a little inside knowledge on what’s really going on in the markets, and what you should do about it? Here’s a quote from Proverbs:
“The prudent sees danger and hides himself, but the simple go on and suffer for it.” Proverbs 27:12 (ESV),
And the Mogambo Guru Version of the above Biblical quote:
“The prudent sees danger and hides himself in his steel-reinforced concrete bunker and locks the door, whilst surrounding himself with gold, and silver, and commodities, and victuals, and many powerful armaments with which to protect the gold and silver and commodities and victuals, and he shall have multitudes of cases of both brewed and sugary beverages with which to slake his thirst, but the simple go on and suffer for it.” – Mogambo Version (MV) shall henceforth be known as Proverbs 27:12 (MV)
I don’t know about investing in a steel-reinforced bunker to protect one’s, precious metals and victuals. But one thing everyone should do is to begin transferring one’s wealth currently trading in the stock market, and transfer it toward gold and silver bullion and precious metals mining shares.
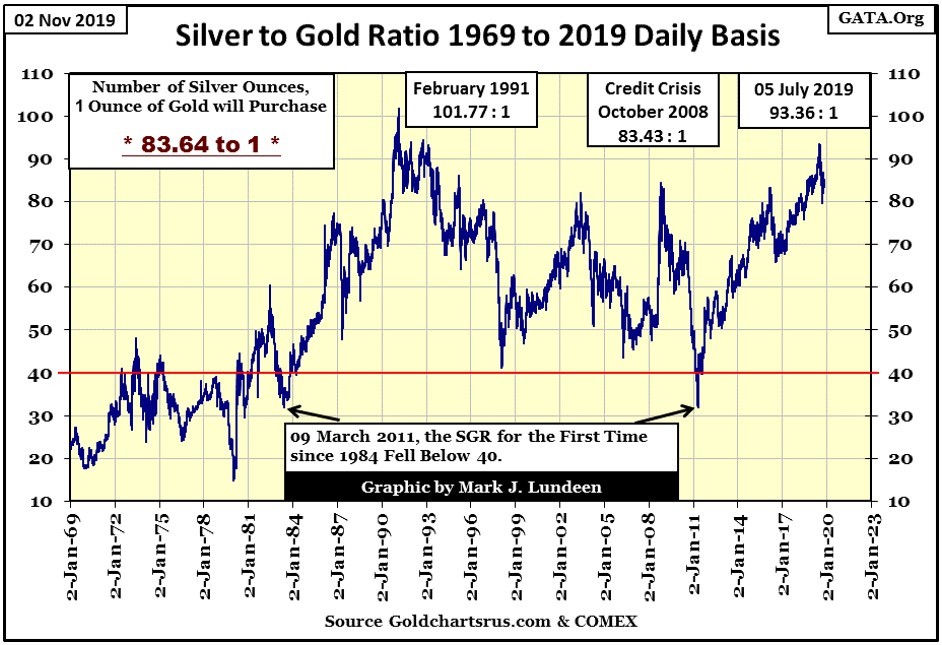
Seeing the Silver to Gold Ratio close the week at 83.64 tells us not only is silver a compelling investment, but also as 2020 draws near the bull market in gold and silver continues to be stalled. But for someone who is still buying, especially buying silver, that’s not a bad situation for the market to be in.
But this is an extremely difficult market for exploration companies. Can’t argue with that, but that’s what makes it possible to buy them this cheap as purchasers today have little to no competitive bidding for them. Buying these exploration plays at current discounted market prices is something that won’t be possible when gold and silver finally break out of their present period of base building.
That is something that has always happened before when the precious metals markets have transitioned from bear to bull market; what now trades for pennies will then costs dollars.
That’s why I still like an exploration play like Eskay Mining as speculation (Toronto Ventures Exchange Symbol: ESK). It’s high-risk speculation that actually has the proportional high-gain potential for anyone willing to take a chance with a small portion (5% or less) of their funds targeted for precious metals mining.
Three years ago SSR Mining entered a joint venture with Eskay Mining which SSR Mining committed spending $12 million Canadian over a three year period to earn a 51% interest in less than ten percent of the Eskay’s 130,000 acres project. The target is what the company styles the Search for Eskay-Creek Mine #2.
Eskay-Creek Mine #1 was one of the richest mines in the world. Operated by Barrick Gold, Eskay-Creek Mine #1 from 1995 to 2008 produced ore-bearing a stunning 1.5 OUNCES of Gold and 70 OUNCES of Silver per ton for thirteen years. Geologists specializing in this geological region believe there is more of this high-grade ore to be found.
Eskay-Creek Mine #1 was a precious metals ore body of legend; fabulously rich deposit geologists suspect was only part of a much larger geological formation which formed deep in the Pacific Ocean when dinosaurs roamed the Earth during our Jurassic era.
In the following hundred and eighty million years or so, the ore body was lifted up high into the Canadian Rockies. In the process, the formation’s paydirt was broken up, with its fragments drifting to parts unknown in Canada’s Golden Triangle.
Eskay Mining’s previous work, along with SSRM’s drilling program indicates the search for Eskay-Creek Mine #2 is viable but difficult. After two seasons and $8 million spent on exploration, SSRM elected to drop its option even after producing the best drill results to date on the property. SSRM’s decision hurt Eskay as many investors presume the target is too difficult even with a prize valued at perhaps $3 Billion. As a result, all lands were returned to Eskay in full.
In the past year, Eskay Mining’s management has remained active by recruiting additional members to its superb team of geologists to extend its search for Eskay-Creek Mine #2. In the following press release, Eskay Mining’s CEO; Mac Balkam announced geologists from the Colorado School of Mines are joining with the company to study the geophysical data the company has, to locate additional Eskay Creek type deposits suspected to be present on Eskay Mining’s property.
The caliber of personal Eskay Mining has obtained to further its exploration program is outstanding and will promote interest in the company, if not with investors in general, then with mining professionals.
It’s not only Eskay Mining searching for additional shards of the original deep ocean ore body that became Eskay-Creek Mine #1. Canadian junior Skeena Resources (TSX.V: SKE), recently acquired rights to Barrack Gold’s Eskay-Creek Mine #1 itself seeking the same.
So why not speculate in Skeena instead of Eskay Mining? Because Eskay Mining has a HUGE land package that potentially contains many other ore bodies that could also become company builders. Currently, Eskay Mining’s land package is in good standing until 2029, meaning they are not under pressure to complete work just to keep their claims in good standing.
Keep in mind British Columbia’s Golden Triangle is a mining district that currently has many large deposits of various types of orebodies in development or in actual production. The chances Eskay Mining’s properties will host similar deposits are excellent. Looking at the map below, Eskay Mining’s property (Green) borders the old Eskay-Creek Mine #1 (Big Yellow Star).
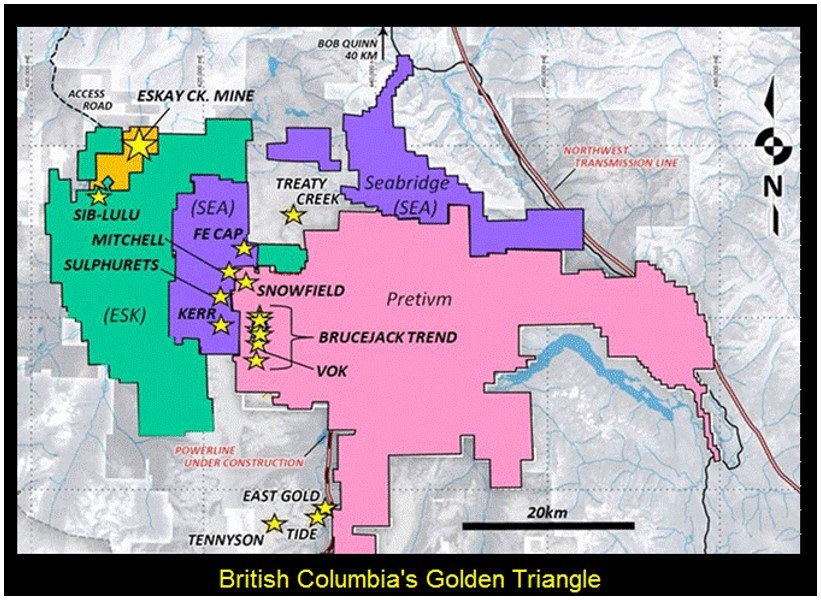
Eskay Mining also borders Seabridge Gold (SA-NYSE) which is advancing the world’s largest undeveloped copper/gold mine. As well, Pretium Resources (PVG-NYSE) borders Eskay with their very high-grade Valley of the Kings (VOK above) mine, in production for two years.
No guarantees the company will find any ore bodies of sufficient size or grade to mine, and that’s what makes buying Eskay Mining a SPECULATION. But the company’s management is competent, as well as being the company’s largest shareholders by buying its shares in the open market. I like that!
—
(Featured image by Pixabay via Pexels)
DISCLAIMER: This article expresses my own ideas and opinions. Any information I have shared are from sources that I believe to be reliable and accurate. I did not receive any financial compensation for writing this post, nor do I own any shares in any company I’ve mentioned. I encourage any reader to do their own diligent research first before making any investment decisions.

-

 Africa1 week ago
BLS Secures 500 Million Dirhams to Drive Morocco’s Next-Gen Logistics Expansion
-

 Fintech2 weeks ago
Ripple Targets Banking License to Boost RLUSD Stablecoin Amid U.S. Regulatory Shift
-

 Impact Investing3 days ago
Sustainable Investments Surge in Q2 2025 Amid Green and Tech Rebound
-

 Biotech1 week ago
Biotech Booster: €196.4M Fund to Accelerate Dutch Innovation


