Featured
The Stock Market Continues to Show Numerous Negative Divergences
Inflation continues as Canada reports its CPI and PPI. Transitory? Or becoming more a permanent fixture. Gradually, then suddenly. But long interest rates slipped this past week seemingly in defiance of the inflation numbers. We note the Baltic Dry Index (BDI) a measurement of global shipping. It’s falling, cut in half from its high. What does that mean for the global economy?

Gradually, then suddenly. That’s the phrase we think about when we see how inflation is unfolding and we view the devastation in British Columbia (B.C.) as a result of flooding from torrential downpours known as “atmospheric rivers.” Atmospheric rivers are not new, nor is inflation. But 2021 seems to have brought not only a sudden rise in prices but also a sudden sharp rise in extreme weather events.
As to gradually, then suddenly, well, that is a passage from Ernest Hemingway’s novel The Sun Also Rises, in which a character named Mike is asked how he went bankrupt. “Two ways,” he answers. “Gradually, then suddenly.”
There have been warnings for years about the potential effects of global warming that could bring a sharp increase in extreme weather events. The warnings are now the daily headlines. According to provisional reports, 2021 has been amongst the seven hottest on record. October 2021 is the fourth warmest recorded. Floods, wildfires, and freak storms are what some are calling a part of the “new normal.” Devastating floods in Europe, China, India, and elsewhere, and now in B.C. are drawing considerable attention. The world’s oceans have reached record highs while concentration of major greenhouse gases in the atmosphere has increased over the past year. Greenland had huge ice melts in August and the first rain reported at the ice sheet’s research station. Northern Canada and presumably northern Europe and Russia are experiencing the same. Permafrost slump – the result of melting permafrost where the land literally collapses into itself.
None of these events have not occurred in the past. Official weather records only go back to 1880, marking the start of modern global record-keeping. Before that, scientists used proxy data. One thing is certain, however, and that is the world did not have 7.9 billion people during previous periods of what might be termed as global warming.
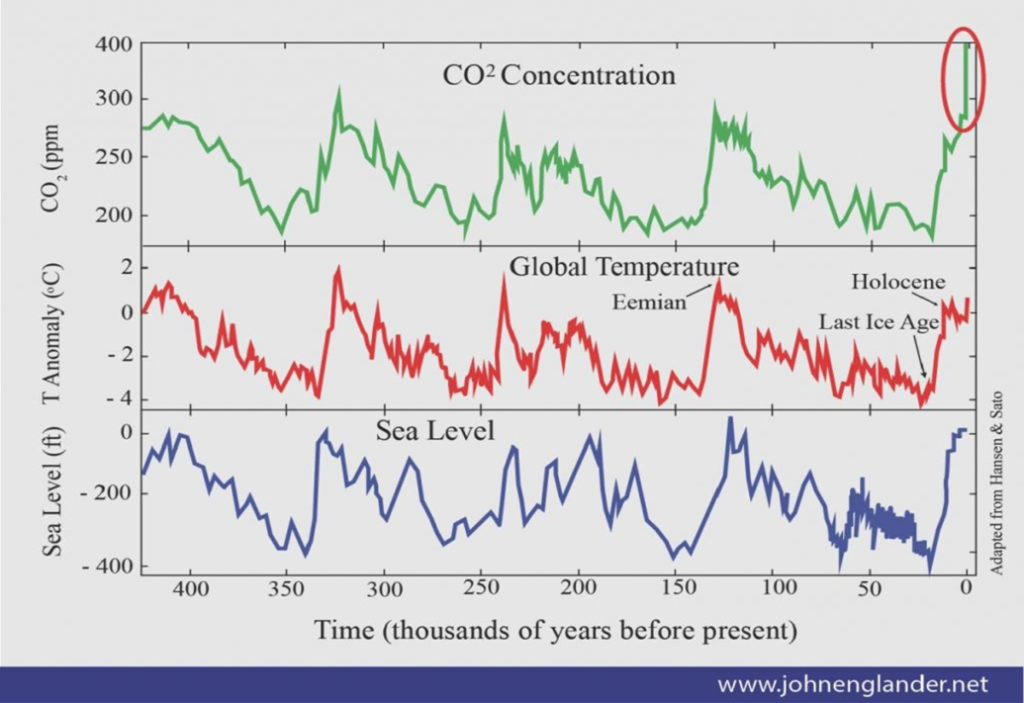
There are numerous historical charts available. This one from John Englander (www.johnenglander.net) was interesting because it shows CO2 concentrations, global temperature, and sea level all in one. John Englander is an oceanographer, consultant, and leading expert on sea level rise. As Englander notes, levels of CO2 are closely correlated with temperatures. From our technical analysis viewpoint, CO2 emissions have broken out from a normal range of 180–280 PPM (parts per million) seen over the past 400 thousand years. Englander correlates this with the rise in burning of fossil fuels, reduction of forest cover, and more. That also correlates with the rise of the industrial world. He notes that the last time the CO2 levels were near 1,000 PPM (currently around 400 PPM) some 55 million years ago, there were no polar ice sheets and sea levels were roughly 250 feet (75 m) higher than they are today. Today, that would bury many global cities underwater. Climate change normally occurs over hundreds of thousands of years and even abrupt changes take thousands of years. But what is key is that in previous periods of high concentrations of CO2 the global population was considerably less and 55 million years ago was long before human civilization.
Climate change is cyclical as are many things, including the stock market. But climate change occurs usually over a long period of time. The question is, is human activity accelerating the process? The last warming period the earth experienced was known as the Medieval Warming Period, roughly 950–1200 AD. But that was nothing like we are experiencing today as CO2 concentrations never reached the heights currently being seen. However, it is noteworthy because it was during this period that the Vikings inhabited Greenland and Mayan civilization collapsed, primarily due to years of drought caused by the warming period. The warming period was not necessarily global. Human population in 1000 AD was estimated at 310 million vs. 7.9 billion today. The Medieval Warming Period was followed by what was known as the Little Ice Age, roughly 1580–1880.
The U.S. alone has recorded 18 weather/climate disasters in 2021 with losses exceeding $1 billion year to date. The past average was seven. 2020 recorded 22 severe, billion-dollar-plus weather disasters. So far in the first nine months of 2021 the total is $104 billion, $4 billion more than all of 2020. The year is not yet over.
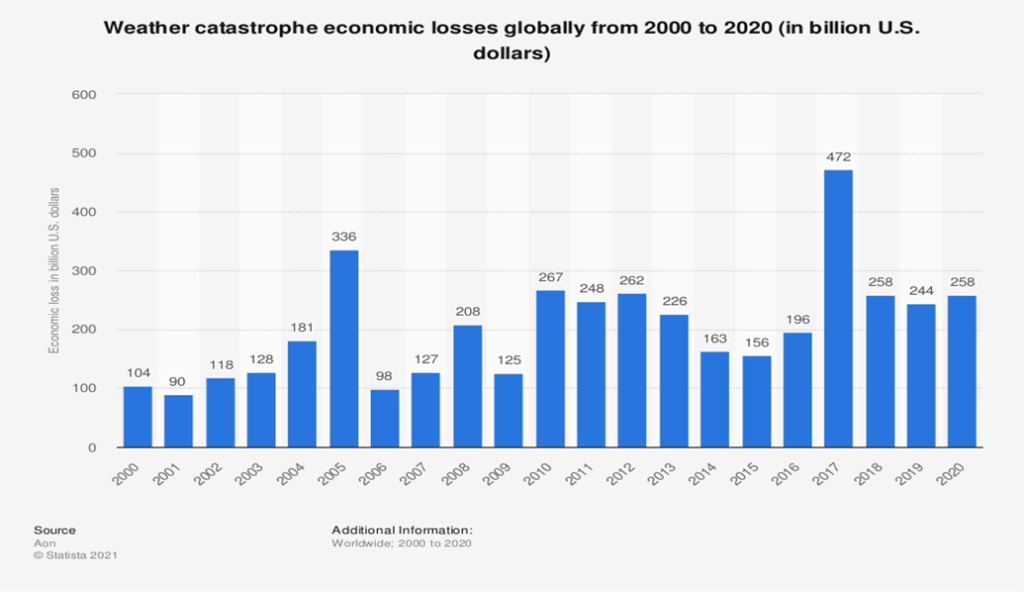
Our chart below shows the annual economic losses from weather catastrophes through to 2020 only. Total losses from 2000–2010 were $1,782 billion (average $162.0 billion/annually). From 2011–2020 the losses rose to $2,483 Billion, an increase of 39% with one fewer year so far. The average has been $248.3 billion. So far in 2021, natural disasters have cost the U.S. alone over $100 billion and hundreds of lives due to floods, hurricanes, freak storms, and wildfires.
Besides the actual costs of natural disasters, there is also the human cost as the refugee crisis grows. It is estimated that upwards of one billion people globally could be climate refugees by 2050. Even the flood disaster in B.C. has created thousands of temporary refugees. The question is, how many of them will still be displaced a year from now? Many homes will be condemned and insurance will not necessarily cover the costs of rebuilding. As well, insurance rates will rise, possibly sharply, due to the plethora of natural disasters that have already hit B.C. and elsewhere. An interesting example is the flooding of Sumus Prairie near Abbotsford B.C. Sumus Prairie was built on the Fraser River lowlands and was created by the draining of Sumus Lake in the early 20th century. What are the odds that Sumus Prairie will be rebuilt and the residents will be allowed to go back? The land has now been returned to Sumus Lake.
Can technology and innovation be the answer? What is obvious is that we have been ill-prepared for the disasters that have occurred. Not just here, but everywhere, with possible exceptions. Companies that find solutions could become valuable commodities. Solution companies can be found in renewable energy, automobile, construction, heating and cooling, biotech, and more. Electricity grids will need to be upgraded. Solutions, however, will require the use of many minerals. Minerals such as cobalt, lithium, graphite, manganese, nickel, copper, tellurium, uranium, silver, aluminum, and more will be in demand. Companies that search for and mine these minerals will benefit. But supply chains for many of these minerals are vulnerable. 70% of the world’s cobalt is found in the Democratic Republic of the Congo. 60% of rare earth metals come from China. Regions, where rare earths are mined, are also vulnerable to natural disasters of flooding, drought, and conflict. There are also issues of human rights and environmental abuses in some regions. But it will also prove important that new resources are found.
The climate disasters, coupled with the pandemic of the past two years, have played havoc with supply chains. The climate disaster in B.C. just adds to the woes as highways, rail lines, pipelines, and more have been severed. The Abbotsford region is a major agriculture zone that will see their agricultural products supply severely disrupted. While workarounds are underway, more traditional fixes could take weeks, even months. To upgrade will take even longer. The Port of Vancouver, the 47th busiest in the world and the busiest in Canada, is effectively shut down at least for the moment. Goods can’t get in or out, such as grains and fertilizers, electronics, and household goods, in all totaling roughly $240 billion/year.
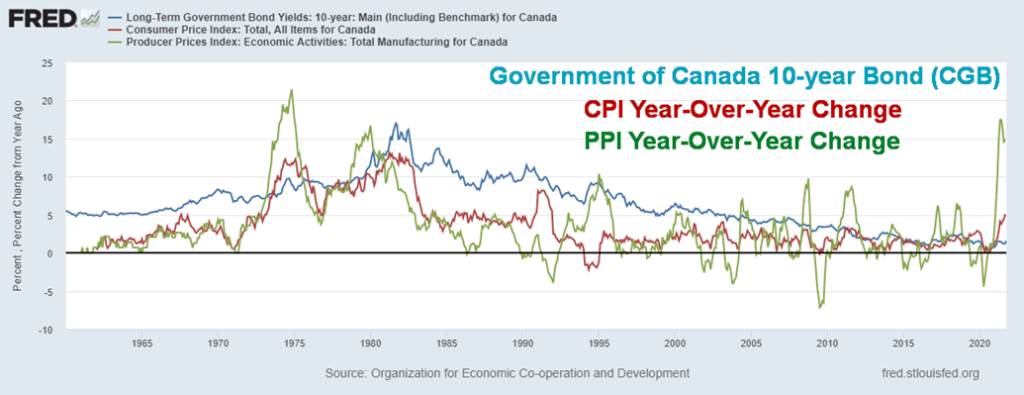
All of this feeds into the rising inflation. Canada just reported the highest inflation rate since 2003. Canada reported a rise of 4.7% in October, up from 4.4% the previous month but largely in line with expectations. Transportation and energy costs were the prime culprits, but shelter and food also contributed. The core inflation rate (ex food and energy) came in at 3.8%. The Government of Canada 10-year bond (CGB) is at 1.71%, giving us a negative spread to inflation of 2.99% and 2.09% to the core inflation rate. The spreads have never been so high. If one also looks at the producer price index (PPI), it came in at 16.7% in October. While that is slightly off the high seen in June 2021 at 17.4%, it remains not far from the all-time high of 21.5% seen in November 1974.
Inflation is becoming potentially more than transitory. As we noted—gradually, then suddenly. But what to do about it? Wage and price controls? That was tried unsuccessfully in the 1970s. Suppression causes dislocations and poor allocation of resources. It could cause shortages, rationing, and create illegal markets. It could also result in a recession. The government would be the one to set wage and price controls.
Hike interest rates? The Bank of Canada (BofC) and even the Bank of England (BOE) have signaled rate hikes in 2022, possibly sooner. The Federal Reserve has also signaled possible rate hikes in 2022. The market is starting to price in three. But, as we saw with Volker hiking interest rates sharply in 1979–1980, the result was a very steep recession, even as inflation was wrestled to the ground. The central banks are caught between a rock and hard place as are the politicians. Doing nothing, setting wage and price controls, or hiking interest rates—any of these could result in a recession, potentially a steep one. To prepare better for climate change could also be inflationary and add considerably to the already rising debt that has jumped sharply as a result of the pandemic. However, doing nothing and merely reacting when disaster strikes could also be inflationary and also add to the debt, possibly even more so. In the long run, doing nothing could potentially cost more than doing something. In both cases, the costs are estimated to be in the trillions. The costs alone for the B.C. flooding disaster probably start at $1 billion and may be considerably higher. Who pays?
Canada Government of Canada 10-year Bond (CGB, CPI, PPI) 1960–2021
Despite the fear of inflation, there are numerous sectors poised to benefit from rising inflation. At the top of the list one usually finds gold, followed by commodities. The housing market and stock market (REITS as an example) could also benefit, but if interest rates rise to painful levels to bring down the rate of inflation all could fall quickly. In the bond sector, TIPS (Treasury inflation-protected securities) are indexed to inflation. But once interest rates top, then one would want to switch to long bonds. Using short-term bonds/notes or treasury bills also protect but in a rising interest rate environment the price on these securities could also fall, just not as much as long-term bonds.
Central banks and politicians are caught between a rock and a hard place regarding both inflation and climate change. In other words, they are trapped. Add polarizing politics to the equation and it continues to be surprising that the stock market just keeps on going up—that is, until it doesn’t. The question is, what will prick it? Things end gradually, then suddenly.
Chart of the Week
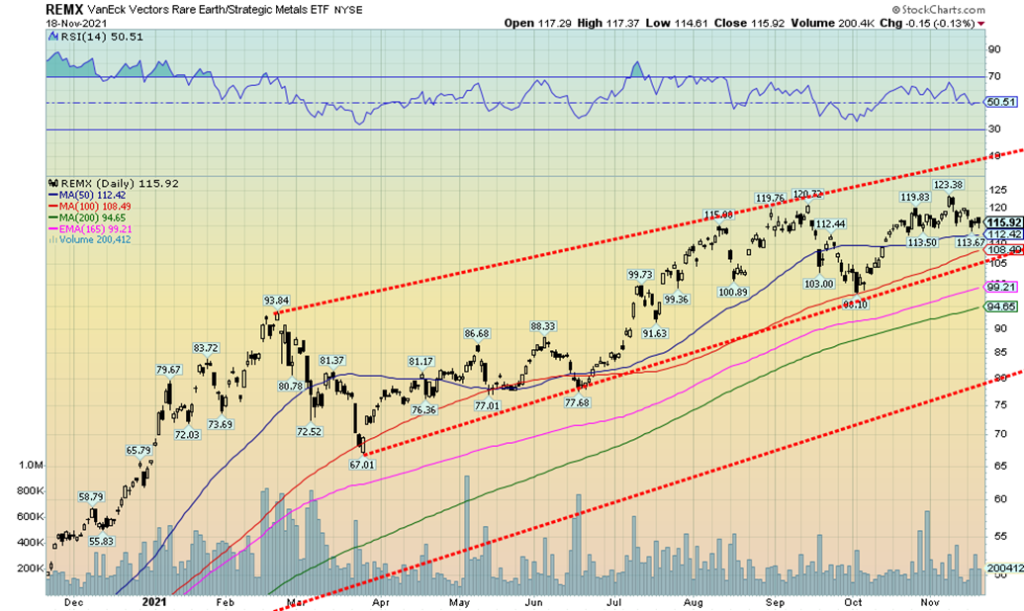
Given our thoughts on the need for numerous minerals to meet the demand for clean energy, we looked for an index that is oriented towards rare earths and strategic metals. There is one, the MVIS Global Rare Earth/Strategic Metals Index (MVREMX). The MVREMX tracks 20 components. Six are from China, five from Australia, two from both Canada and the U.S., and, one each from Great Britain, Netherlands, France, and Japan (https://www.mvis-indices.com/indices/hard-asset/mvis-global-rare-earth-strategic-metals).
The VanEck Vectors Rare Earth/Strategic Metals ETF (REMX/NASDAQ) seeks to replicate the price and yield performance of the MVREMX. At least 80% of the total assets are in companies contained in the index. There are 12.2 million shares outstanding with net assets under management of $1 billion. REMX currently has a yield of 0.46%. REMX is currently in a rising channel with no clear signs of a top. The most recent high in November was slightly higher than the September high. It could be a double top, but that’s difficult to say at this time as the second top normally is below the first top. REMX breaks down under $105 and definitely under $95. The last low was at $98.10 on October 4, 2021.
There are a number of rare earth companies in Canada. Many of them are small exploration companies trading on the CDNX. Canada has rare earth reserves of roughly 830,000 metric tonnes. There is only one operating rare earth mine we found in Canada: Nechalacho mine, 110 kilometers southeast of Yellowknife, North West Territories (NWT). Cheetah Resources operates the mine. Cheetah is a subsidiary of Vital Metals (VML/ASX, VTMXF/PINK) that trades on the Australian Securities Exchange.
MARKETS AND TRENDS
| % Gains (Losses) Trends | ||||||||
| Close Dec 31/20 | Close Nov 19/21 | Week | YTD | Daily (Short Term) | Weekly (Intermediate) | Monthly (Long Term) | ||
| Stock Market Indices | ||||||||
| S&P 500 | 3,756.07 | 4,697.96 | 0.3% | 25.1% | up | up | up | |
| Dow Jones Industrials | 30,606.48 | 35,601.98 | (1.4)% | 16.3% | up | up | up | |
| Dow Jones Transports | 12,506.93 | 16,517.46 | (1.5)% | 32.1% | up | up | up | |
| NASDAQ | 12,888.28 | 16,057.54 (new highs) | 1.2% | 24.6% | up | up | up | |
| S&P/TSX Composite | 17,433.36 | 21,555.03 (new highs) | (1.0)% | 23.6% | up | up | up | |
| S&P/TSX Venture (CDNX) | 875.36 | 993.33 | (3.0)% | 13.5% | up | up | up | |
| S&P 600 | 1,118.93 | 1,423.25 | (2.2)% | 27.2% | up | up | up | |
| MSCI World Index | 2,140.71 | 2,376.76 | (0.1)% | 11.0% | up | up | up | |
| NYSE Bitcoin Index | 28,775.36 | 58,040.09 | (8.1)% | 101.7 | up | up | up | |
| Gold Mining Stock Indices | ||||||||
| Gold Bugs Index (HUI) | 299.64 | 267.51 | (3.8)% | (10.7)% | up | neutral | up (weak) | |
| TSX Gold Index (TGD) | 315.29 | 298.94 | (2.3)% | (5.2)% | up | neutral | up (weak) | |
| Fixed Income Yields/Spreads | ||||||||
| U.S. 10-Year Treasury Bond yield | 0.91 | 1.54% | (1.9)% | 69.2% | ||||
| Cdn. 10-Year Bond CGB yield | 0.68 | 1.66% | (0.6)% | 144.1% | ||||
| Recession Watch Spreads | ||||||||
| U.S. 2-year 10-year Treasury spread | 0.79 | 1.03% | (1.9)% | 30.4% | ||||
| Cdn 2-year 10-year CGB spread | 0.48 | 0.69% | 1.5% | 43.7% | ||||
| Currencies | ||||||||
| US$ Index | 89.89 | 96.03 (new highs) | 0.9% | 6.8% | up | up | neutral | |
| Canadian $ | 0.7830 | 0.7899 | (0.8)% | 0.8% | down | down | up (weak) | |
| Euro | 122.39 | 112.89 | (1.4)% | (7.8)% | down | down | neutral | |
| Swiss Franc | 113.14 | 107.71 | (0.8)% | (4.8)% | down | down | up | |
| British Pound | 136.72 | 134.45 | 0.2% | (1.7)% | down | down | up | |
| Japanese Yen | 96.87 | 87.71 | (0.1)% | (9.5)% | down | down | down | |
| Precious Metals | ||||||||
| Gold | 1,895.10 | 1,851.60 | (0.9)% | (2.3)% | up | up | up | |
| Silver | 26.41 | 24.78 | (2.3)% | (6.2)% | up | neutral | up | |
| Platinum | 1,079.20 | 1,036.00 | (4.9)% | (4.0)% | up (weak) | down (weak) | up | |
| Base Metals | ||||||||
| Palladium | 2,453.80 | 2,073.20 | (2.1)% | (15.5)% | up | down | neutral | |
| Copper | 3.52 | 4.41 | (1.0)% | 25.2% | neutral | neutral | up | |
| Energy | ||||||||
| WTI Oil | 48.52 | 75.94 | (6.0)% | 56.5% | down | up | up | |
| Natural Gas | 2.54 | 5.07 | 5.9% | 99.6% | down | up | up | |
New highs/lows refer to new 52-week highs/lows and in some cases all-time highs.
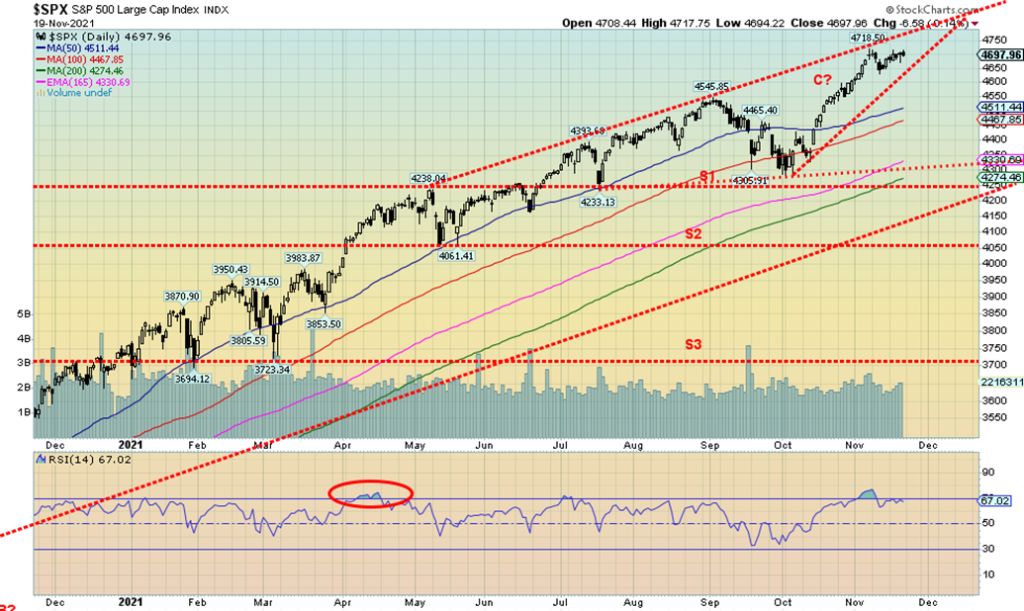
Up, up, and away. Or maybe not. The S&P 500 rose this past week with a gain of 0.3% and the NASDAQ soared to new all-time highs, up 1.2%. But others went in the opposite direction. The Dow Jones Industrials (DJI) was down 1.4% and the Dow Jones Transportations (DJT) dropped 1.5%. The trouble for the DJI was that only seven of the 30 components were up on the week, led by Home Depot up 9.7%. On the other side GE lost 7.1%, CSCO dropped 6.3% and XOM was off 4.9%. They were the biggest losers. Small caps also suffered with the S&P 600 down 2.2%. In an interesting divergence the S&P 500 Equal Weight Index was down 1.3%. Bitcoin tried to rally, failed, and closed below $60,000, off 8.1% on the week.
In Canada, the TSX Composite hit new all-time highs again but closed lower, off 1.0%. The TSX Venture Exchange (CDNX) was down 3.0%. In the EU, the London FTSE was down 1.8% but the Paris CAC 40 made new all-time highs, up 0.3%. So did the German DAX, gaining 0.4%. In Asia, China’s Shanghai Index was up 0.6% and the Tokyo Nikkei Dow (TKN) gained 0.5%. The MSCI World Index lost a small 0.1%.
We are now wondering if we are in the process of making at least another temporary high. The failure of any of the indices to make new highs even as the NASDAQ roared to new highs is a divergence. There are a number of other divergences as we note below. Breadth fell on the week as it was mostly negative. The NYSE advance-decline line fell 2.5% on the week even as the S&P 500 rose. The NYSE Composite was down 2.0% on the week.
The S&P 500 still appears to be forming an ascending wedge triangle. This triangle breaks down under 4,635 and potentially projects down to 4,300, a decline of 8.5% from current levels. Further support is seen down to 4,250 where a major breakdown could get underway. The top of the channel is currently up near 4,800 so we could still bounce to those levels despite growing negative divergences.
There are negatives growing in the background. The Fed is tapering. Consumer confidence is waning. There is the threat of interest rate hikes next year. There is uncertainty as to who the next Fed Chair will be. The market might like Lael Brainard who is considered more dovish than Jerome Powell. COVID is rampaging once again in Europe and they are shutting down again. That could spread to North America and the U.S. and Canada. Politics in the U.S. remains as fractured as ever, despite Congress passing the Biden administration’s $1 trillion infrastructure bill. The bill is badly needed because of the U.S.’s crumbling infrastructure. We have seen the results of inadequate infrastructure in the ongoing disaster in B.C. with bridges crumbling, resulting in closed highways and rail lines and resulting in disrupted supply chains and growing bottlenecks. There were some positive economic numbers this past week but could that be the peak (discussed further below under the US$ Index). But, as we note below, some things are not looking that rosy.
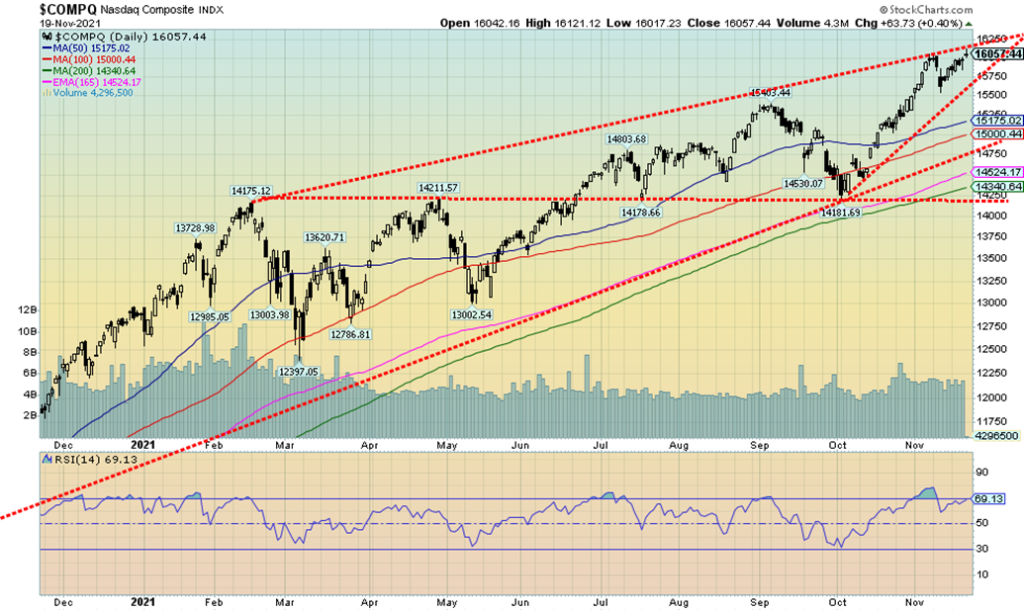
The NASDAQ moved once again to new all-time highs this past week. The NASDAQ was diverging with the other indices. While the S&P 500 did rise and was close to new highs, it has not yet made those new all-time highs. Both the DJI and the DJT were down on the week, a divergence. The NASDAQ gained 1.2% on the week. The NASDAQ 100 Index also made new all-time highs. But that was it. Helping the NASDAQ to new all-time highs were record highs for some of the FAANGs. Making new all-time highs and propelling the NASDAQ to new highs was Apple, up 7.1%. Netflix made new all-time highs but reversed and closed lower, off 0.6%. Google did make new highs, up 0.2% as did Microsoft, up 1.9%. So did Nvidia, up a healthy 8.5%. But others did not fare as well. Meta (Facebook) was up 1.3%, Amazon gained 4.3%, and Tesla leaped 10.0%. But Twitter lost 7.3% and the Chinese FAANGs were down with Baidu off 11.1% and Alibaba down 15.8%. As for the NASDAQ, it does appear as if we have reached the top of a potential channel. But then we also appeared to have broken out of the channel, suggesting higher prices ahead. Nonetheless, the trend remains firmly to the upside despite growing divergences that we note below. These divergences are warning signs, not necessarily the end of the rally. The NASDAQ breaks a possible ascending wedge triangle at around 15,750 and breaks further under 15,500. Major support lies down to 14,750 and 14,250. Under 14,250 a more serious bear market could get underway.
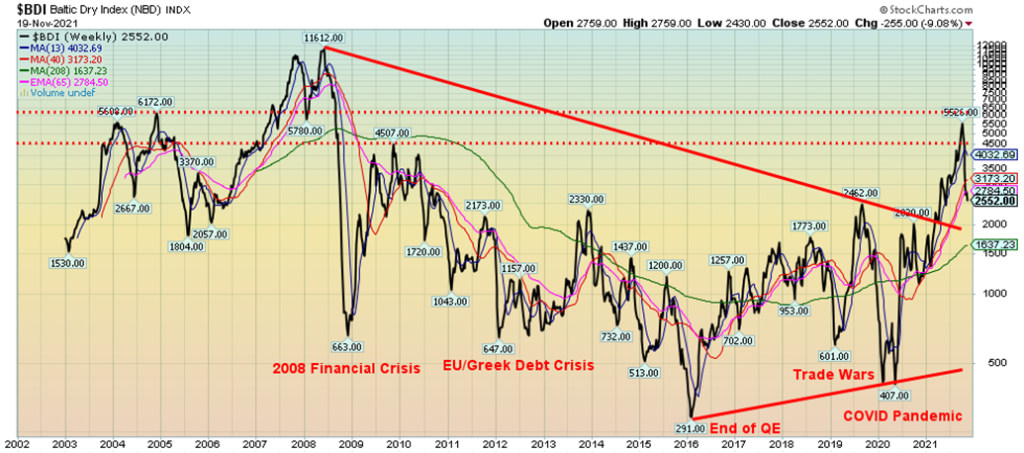
We have noted the Baltic Dry Index (BDI) in the past. The BDI is a measurement of the cost of shipping dry goods of raw materials, notably coal and steel. The BDI Index is a multiple of shipping rates across more than 20 routes. It provides a broad perspective. But it is falling, not rising. Over the past few weeks, the BDI has fallen 51% from a high in early October. Not a good sign. The BDI can be considered a measurement of supply and demand. So, a rising BDI is good but a falling BDI is bad. The BDI was rising earlier because of the shortages in the supply chain and positive economic news especially in the U.S. Note how the BDI’s lows correspond with economic crisis. But is the party now over? The 4-year MA is at 1,637 and with the current reading at 2,552 we should watch that level carefully. Under 1,100 could be signaling another recession. We’d need to regain above 4,500 to suggest things were really getting better again.
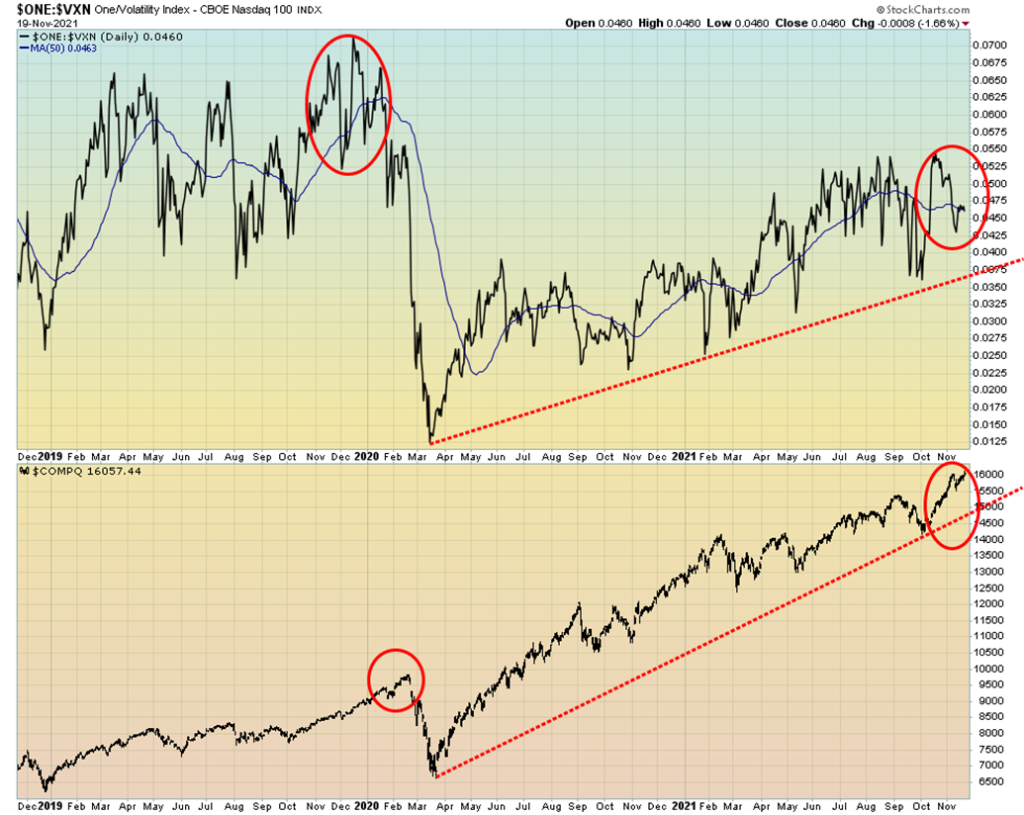
We have a look at a number of divergences. This one is the NASDAQ vs. the VIX Volatility Index for the NASDAQ. This VIX has been inverted so that both the NASDAQ and the VIX would move in the same direction. Only they are not. The VIX is falling, even as the NASDAQ moved higher to record levels this past week. A divergence worth noting. We saw the same divergence in late 2019/early 2020 prior to the March 2020 pandemic panic.
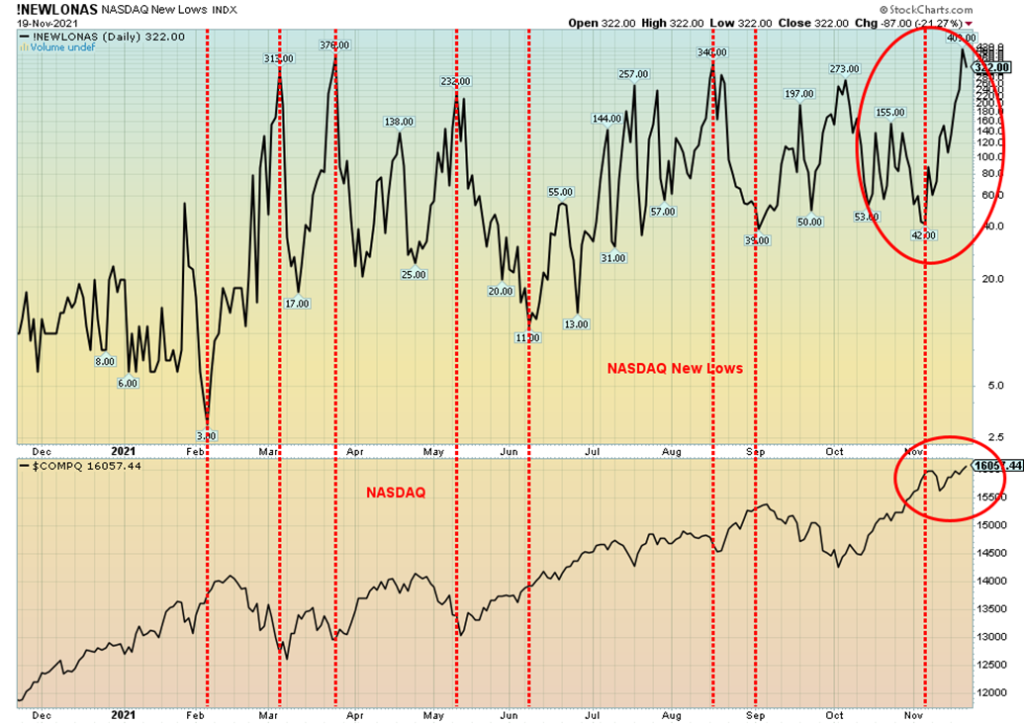
Another divergence. If things are great, then why is the NASDAQ making new highs even as the number of new lows on the NASDAQ has jumped to its highest level in months? What that is telling us is that the rally for the NASDAQ is largely concentrated in a few high-profile stocks, even as the rest of the market appears to be rolling over.
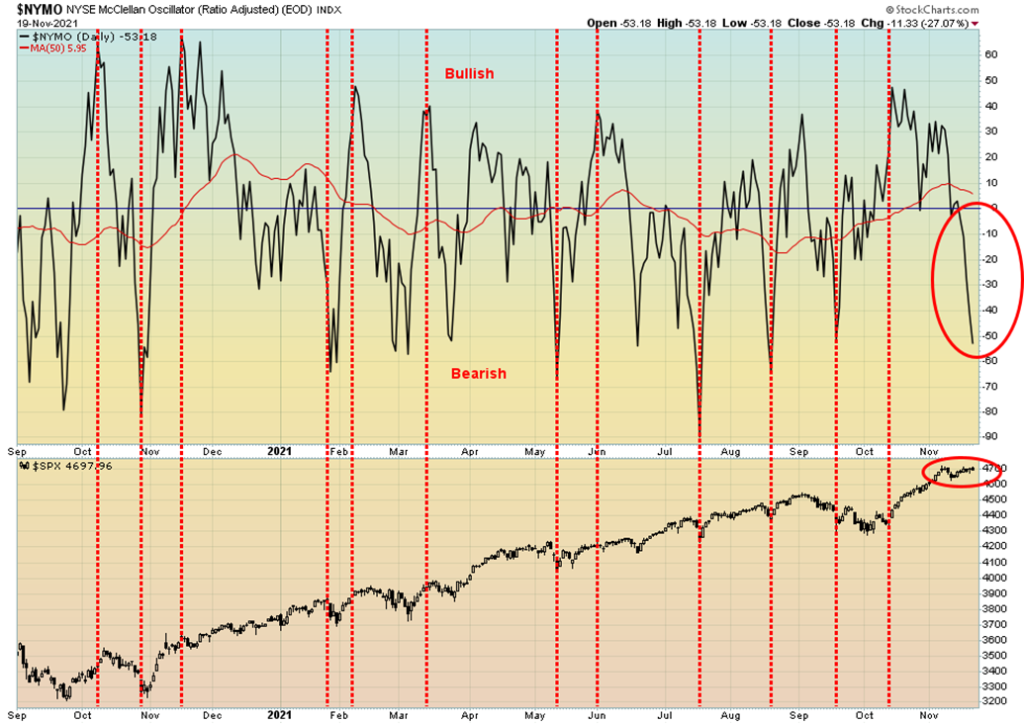
Here is another divergence as the NYSE McClellan Oscillator (ratio-adjusted) plunges to new lows even as the S&P 500 tries to rise to new highs. The reason this is happening is that market breadth has been negative for most of the past couple of weeks. Junk bonds have also seen prices slide. All of this is potentially negative for the stock market that appears to be trying to rise once again to record levels. Another divergence to note.
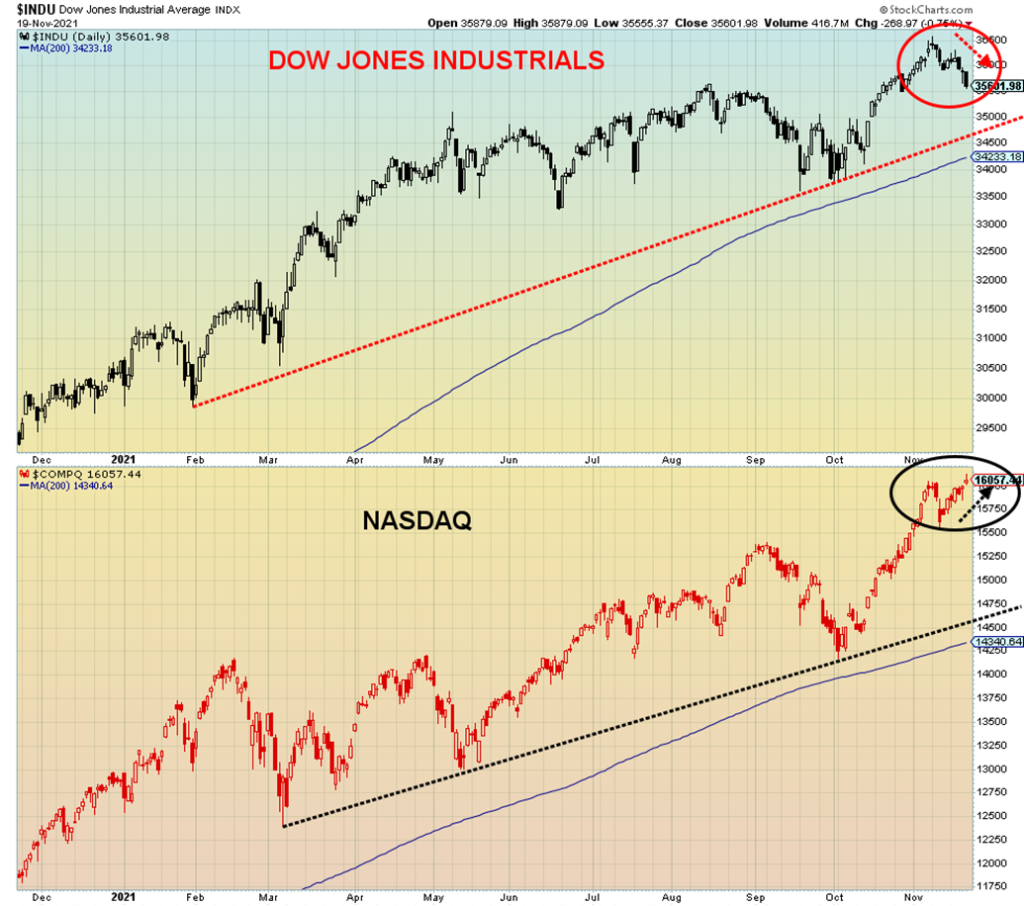
This chart highlights the divergence between the DJI and the NASDAQ. The DJI has turned down and closed lower on the week while the NASDAQ closed higher at a record high this past week. We look for divergences like this at potentially important tops and bottoms. Naturally, this divergence is not yet confirmed. The DJI breaks down under 34,500 but the NASDAQ gives only small sell signals under 15,500.
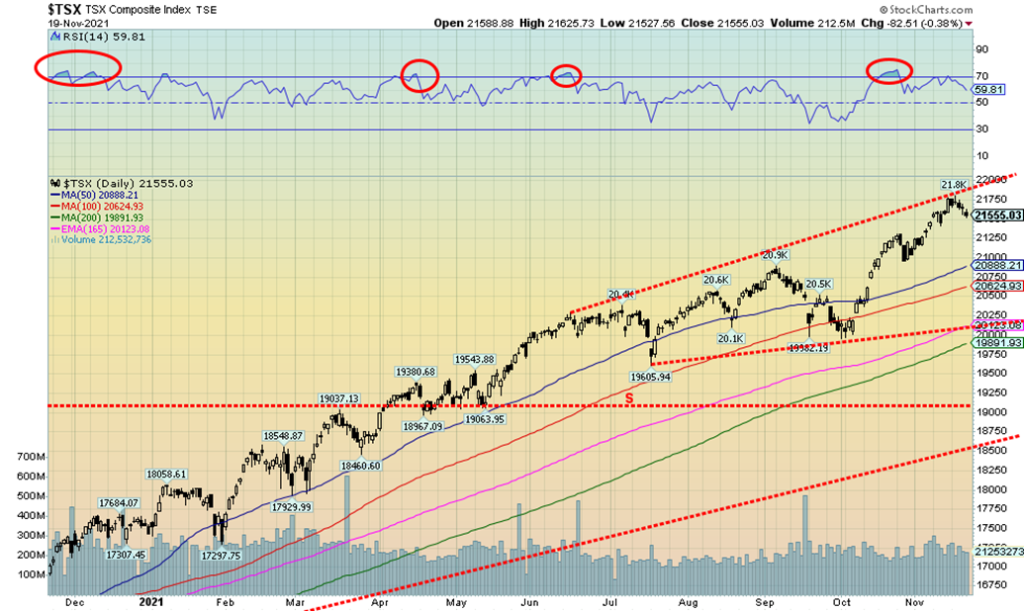
The TSX Composite can’t seem to stop from making new all-time highs. Yes, this week it happened again. But then the TSX turned around and closed lower on the week, off about 1.0%. That is considered a reversal but not a key reversal. It may indicate a short-term pullback only but not necessarily a breakdown. The TSX Venture Exchange (CDNX) also fell down almost 3.0% on the week. Of the 14 sub-indices, only two saw gains on the week. Technology (TKK) was up about 0.2% and Utilities (TUT) gained 0.4%. Two indices made new highs but then closed lower. They were Consumer Staples (TCS), down 0.9% and Financials (TFS), off 1.0%. The big loser on the week was Health Care (THC) -10.6%. Other significant losers were Metals & Mining -3.6%, Golds -2.3%, Energy (TEN) -2.9%, and Materials (TMT) -2.2%. Despite the pullback for the TSX no sell signals were seen. We do not get a sell signal until under 21,000 and a more significant sell signal under 20,100. The MACD did cross over to the downside this past week so it is giving us at least a short-term sell signal. But the more important weekly (intermediate) MACD remains in bull mode as a fresh buy signal was issued during the week of November 1. We have turned down slightly but the top of the channel is now up around 22,000.
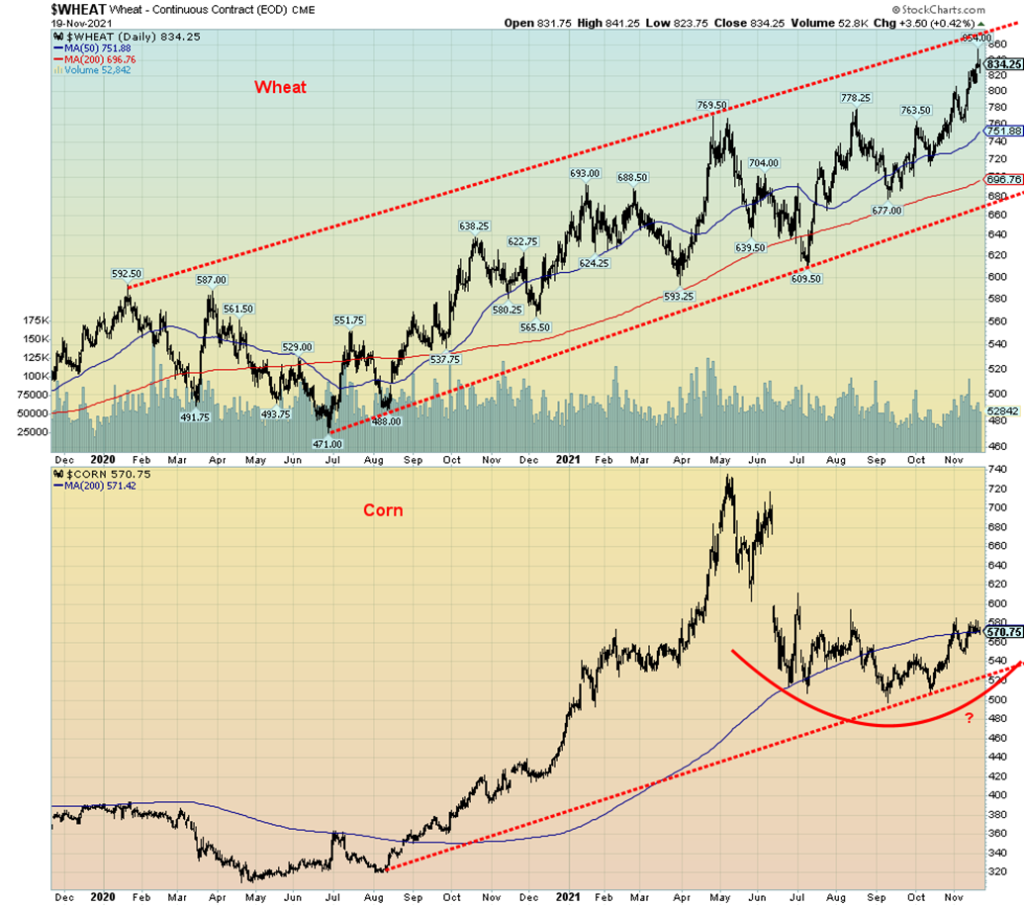
We thought it interesting to show a chart here of wheat and corn, two key foodstuffs, as an indication of why prices have jumped so much in the past year. Wheat is up 69% from lows seen in 2020 while corn is up 88% and was even higher earlier. Other important foodstuffs such as soybeans up 43% and canola up 124% add to the inflationary woes. All these commodities are up since lows in 2020. Supply disruptions and bottlenecks are contributing to the woes. And, no doubt, they may become exacerbated by the blockages currently in B.C. as highways, rail lines, and the port of Vancouver are effectively shut down for days, weeks, and even months. Farmers cannot get their goods to the port of Vancouver. Storage may become a problem. Shipping east is more complicated. And long storage could result in the deterioration and destruction of the goods. All of this feeds into higher inflation.
U.S. 10-year Treasury Bond/Canadian 10-year Government Bond (CGB)
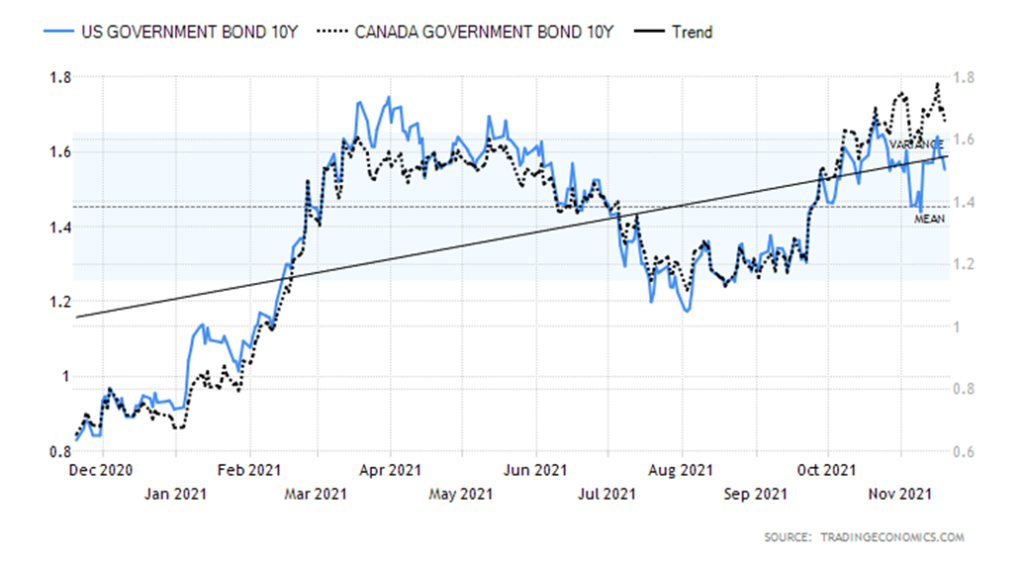
Persistent inflation, the economy appearing stronger than expected, and expectations of interest rate hikes in 2022. So why did the U.S. 10-year treasury note fall in yield rather than rise as would be expected? Yes, the 10-year slipped this past week to 1.54% down from 1.57%. The Canadian 10-year Government of Canada bond (CGB) was off to 1.66% from 1.67%. That’s not much, but it’s still down, not up as some might have expected. It’s possible Lael Brainard may be appointed as the new Fed Chair. Ms. Brainard is considered to be more dovish than the current chair Jerome Powell. As well, the Biden administration may wish to put its own stamp on the Fed although that is not a given as the Fed Chair remains one of the least political of all the appointments. Treasury Secretary Janet Yellen, herself a former Fed Chair, supports the reappointment of Jerome Powell. All of this took place against still high inflation bottlenecks, especially with what is going on in B.C. and a Fed tapering program and wide expectation of at least three interest rate hikes in 2022. Economic numbers remain at least somewhat robust. We note last week’s numbers under our discussion on the US$ Index. The failure so far of the 10-year to make new highs over the most recent high of 1.67% suggests to us those rates could fall further. The most recent high was at 1.63% and the high of this cycle was seen last March 2021 at 1.75%. 1.40% remains our line and a breakdown under that level could see the 10-year fall further toward 1.20%.
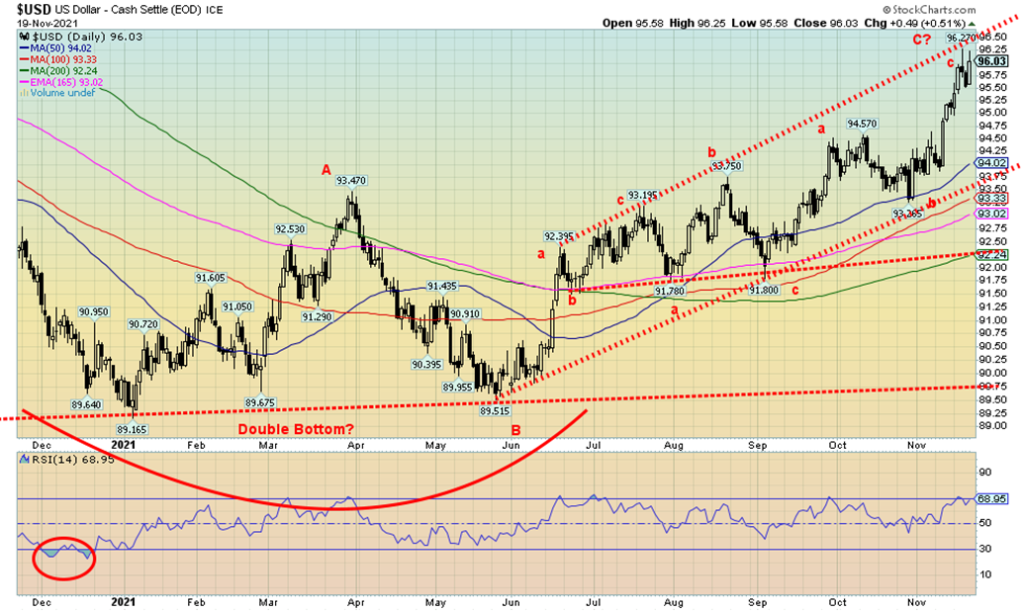
The US$ Index soared to new 52-week highs this past week as it gained 0.9%. The euro fell almost 1.4%, the Swiss franc was off 0.8%, but the pound sterling did gain 0.2%. The Japanese yen was largely unchanged, down a small 0.1%. The Canadian dollar did not fare well with falling oil prices and serious bottlenecks in B.C. as it fell 0.8%. COVID concerns in the EU helped spark a rush to the so-called safe haven of the U.S. dollar. Note the gain in the US$ Index was largely because of the decline for the euro. It also didn’t help when Fed governor Chris Wallace said the Fed could speed up its tapering. Things were strengthened further when initial jobless claims came in lower again at 268 thousand vs. 269 thousand the previous week. The Philly Fed (manufacturing index for the Philadelphia area) was much stronger than expected at 39 vs. 23.8 the previous month and an expectation of 24. Housing starts for October were 1.52 million vs. 1.53 million and an expectation of 1.58 million. Building permits for October were 1.65 million vs. 1.59 million and an expectation of 1.64 million. All helped the dollar. Earlier industrial production for October was also stronger at 1.6% vs. an expected 0.7% and negative 1.3% in September. Retail sales also surprised to the upside, up 16.3% on the year and a sharp 1.2% gain in October. The market had looked for 12% year over year and 1.0% in October. All of these numbers were pointing to a somewhat stronger economy. The bugaboo is the weak consumer confidence numbers seen previously. Will these be the best we see for the economic numbers?
Still, the US$ Index has only reached to the top of another channel so that may be it. We’d now need to break firmly over 96.25/96.50 to suggest even higher prices. We could be making a small double top, but that remains to be seen. Its neckline would be at 95.50. The US$ Index and the euro diverged this past week—the US$ Index hit a high, pulled back, and then, so far, has failed to make new highs even as the euro plunged to new lows on the ongoing COVID fears and shutdowns taking place across the EU. For the longer term, the US$ Index has support down to around 93.50 but a breakdown under 92.00 would spell the end of the dollar rally.
Despite the stronger US$ Index this past week, gold prices were not hit too hard. Gold did fall off 0.9% on the week but that came against the backdrop of fresh 52-week highs for the US$ Index. Silver fell about 2.3% and platinum was down 4.9%. The near precious metals also were down with palladium off 2.1% and copper down 1.0%. Commodities, including the precious metals, tend to move inversely to the US$ Index. The gold stocks were also hit with the TSX Gold Index (TGD) off 2.3% and the Gold Bugs Index (HUI) down 3.8%.
At the November 14–15 FOMC meetings they announced, as expected, the taper of $15/month until finished, roughly next June 2022. However, no interest rate hikes were announced, although the wide expectation is now for at least three in 2022. The FOMC also reiterated its stance that inflation is transitory as U.S. inflation has spiked to its highest level in over 30 years. Given the ongoing supply bottlenecks, now exacerbated by the flooding and destruction in B.C., inflation may become more than transitory. But, as we have noted, the Fed is between a rock and hard place. In other words, it is trapped as the taper, accompanied by higher interest rates, could threaten the already fragile economic recovery. The rise of yet another strain of COVID that is shutting down the EU could quickly spread into North America as well.
All of this could then be music to gold’s ears. We are also awaiting who might be appointed as Fed Chair. The appointment of Lael Brainard could be good for gold (and the stock market as well) as she is considered to be
more dovish. The combination of persistent higher inflation coupled with a Fed that remains dovish could swiftly propel gold prices higher. The key could be more economic numbers that are showing a weakening economy alongside continued supply disruptions that help keep inflation elevated.
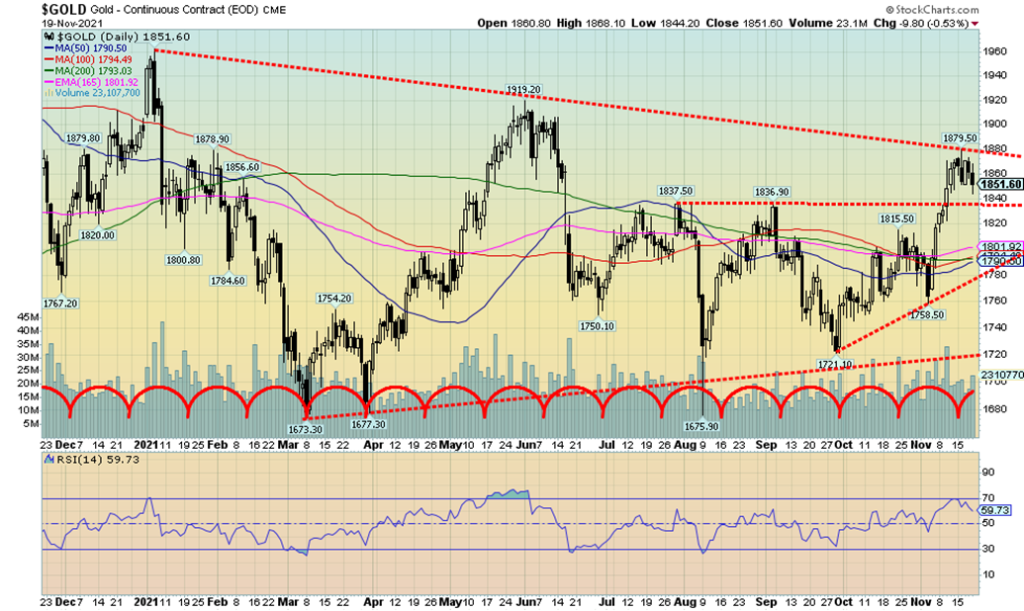
Gold ran into resistance at the $1,870/$1,880 zone as was largely expected. The high this past week was $1,879.50. Support is now down to $1,840. A break of that level would not be the end as further and stronger support is seen all the way down to $1,800. Only under $1,780/$1,790 would the rally be considered officially over. Under $1,760 and especially under $1,725 new lows are highly probable. What’s key is to break out over $1,880 while holding above $1,840. There would then be further resistance between $1,900/$1,920. But above $1,935 things would look more positive and targets up to $2,000 would be in the sightlines. We note that the RSI has fallen just under 60. A decline to around 50 would not be unusual and could set up the next buying opportunity.
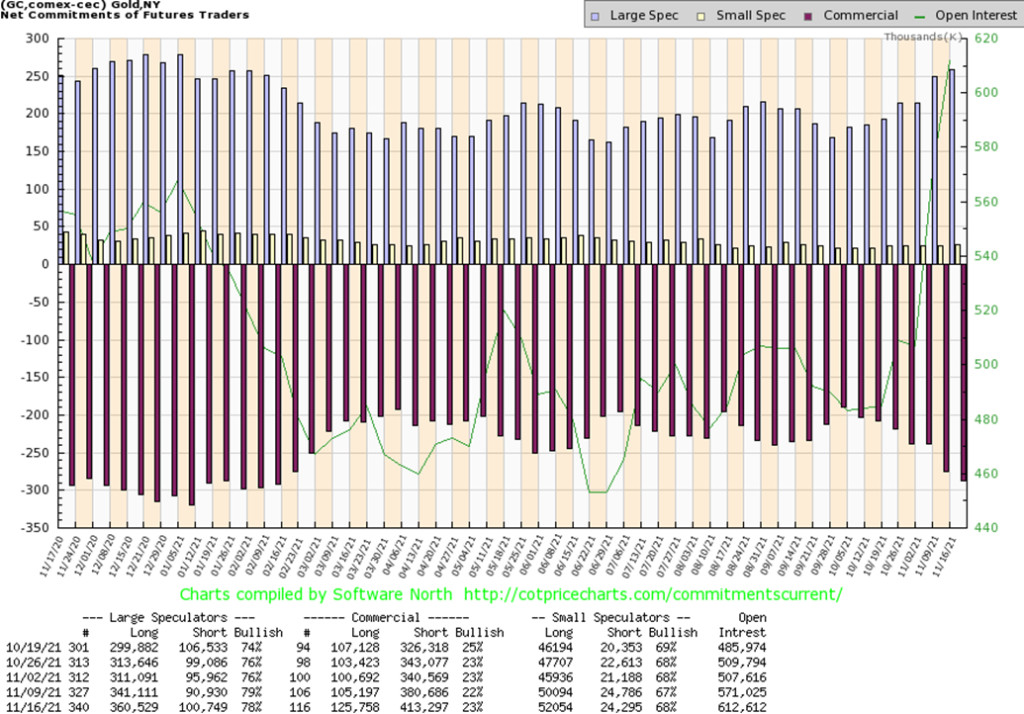
The gold commercial COT (bullion companies and banks) continues to appear somewhat bearish. That’s despite a slight improvement this past week to 23% from 22%. However, it was a mixed blessing. Long open interest did rise up over 20,000 contracts but short open interest jumped even more, up roughly 33,000 contracts. The large speculators COT (hedge funds, managed futures, etc.) did slip to 78% from 79%. However, it too was mixed as long open interest jumped over 19,000 contracts but short open interest was also up around 10,000 contracts. Total open interest rose over 51,000 contracts on a down week.
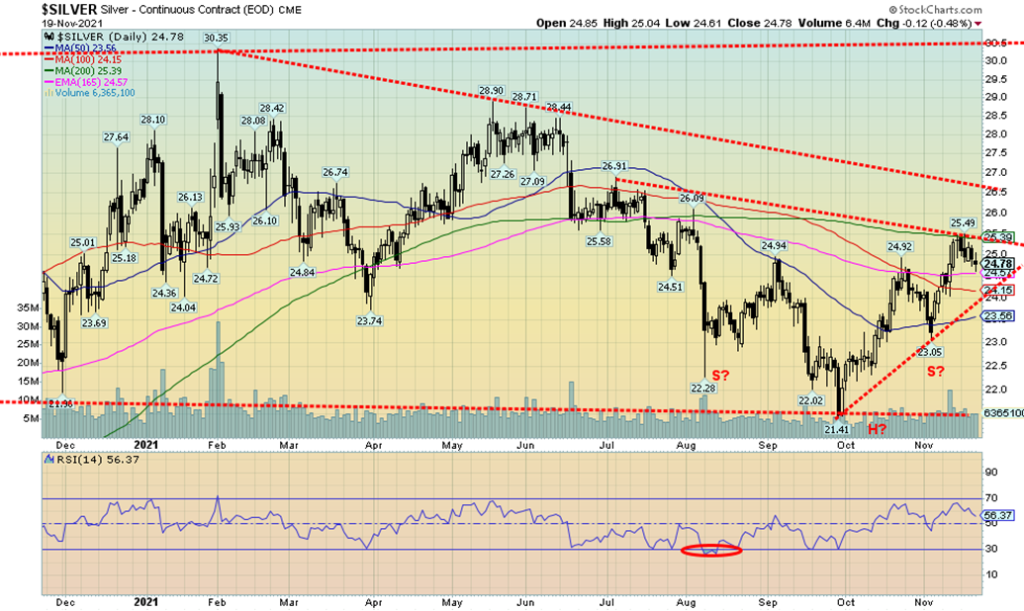
After rising almost 11% from an earlier November low at $23.05 silver gave back some of that, falling about 2.3% on the week. That was roughly 29% of the most recent rise. A 50% pullback is not out of the question. That would come in at $24.27. We note there is support down to about $24.15. The rally that got underway in late September at the $21.41 low remains intact. The danger starts first under $24.15 and then under the $23.05 low. Under $22.35 new lows are likely. We still have what appears to us a possible head and shoulders bottom pattern. We appear to be forming a secondary neckline at $25.40/$25.50. A firm breakout over $25.50 could then target up to at least $30. There is resistance at $26.50 but above that level there isn’t further resistance until around $28.75/$29.00. Above $28.25 new highs are possible above the January high of $30.35. The chart of silver continues to appear bullish but there remains considerable resistance above. And not to break down under key levels below. $23.05 would be a line in the sand.
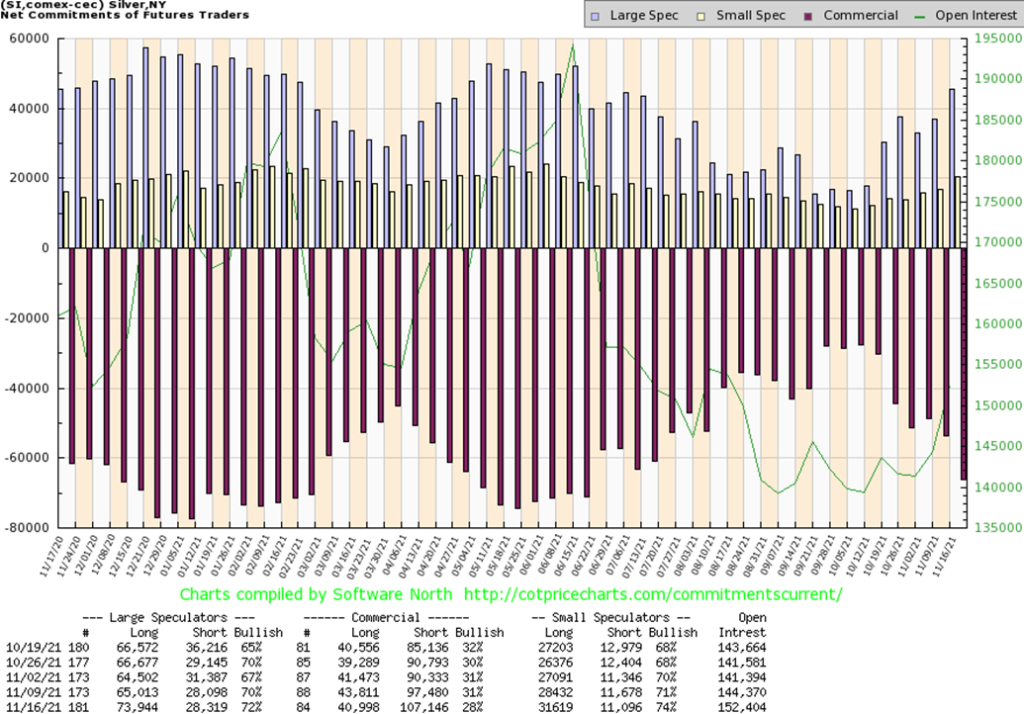
The silver commercial COT fell this past week to 28% from 31% the previous week. This is somewhat bearish. Short open interest rose almost 10,000 contracts while long open interest fell about 3,000 contracts. The large speculators COT jumped to 72% from 70% as they added almost 9,000 contracts to their long position as the short position remained largely unchanged. Overall, open interest rose this past week roughly 8,000 contracts during a down week. We have to view the report as at least somewhat bearish.
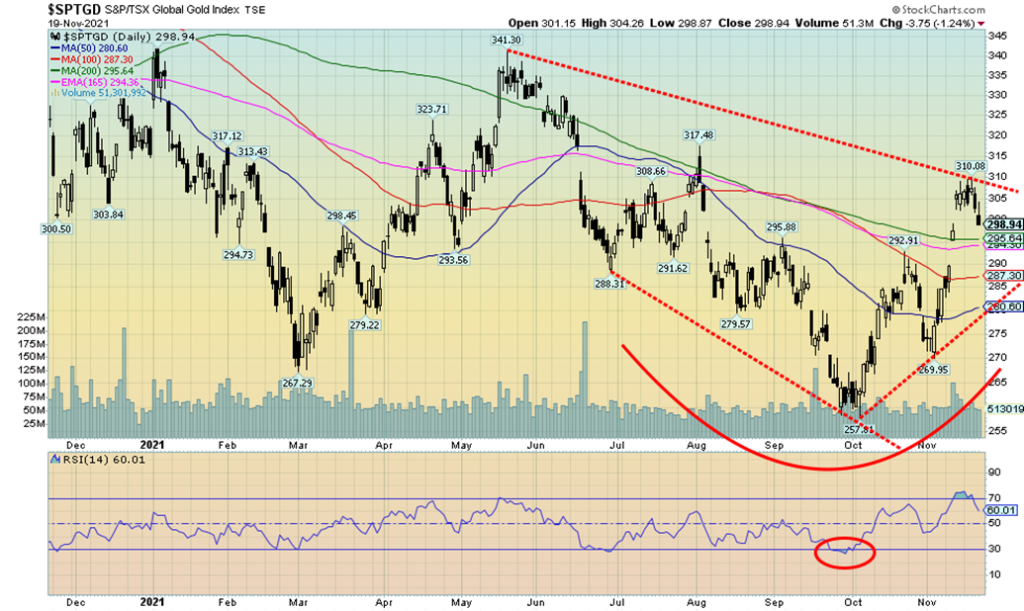
The previous week for the gold stocks was good as the two gold stock indices we follow both jumped over 7%. This past week turned into a “give some back” week. The TSX Gold Index (TGD) fell 2.3% on the week while the Gold Bugs Index (HUI) dropped 3.8%. All in all, the indices gave back a quarter to a third of the previous week’s gains. The TGD is now falling into the previous gap between 299 and 302 with its close at 299. Only a breakdown under 294/295 could signal more losses ahead. The level at 310 is now resistance. So far, we do not see any signs that we are making a major top here. Periodic drops like this are not unusual in the gold market as noted by the previous decline from October 22 to November 3 when the TGD fell, swiftly losing about 8%. The gold stock market remains small so movements can be exaggerated with swift ups and downs. The TGD remains down 28% from the high of August 2020 but up 72% from the March 2020 pandemic low. The current decline is removing some of the overbought levels seen in the indicators such as the RSI that had jumped over 70 for a week or so. That ended on November 16 when the RSI fell back under 70. A bit more decline and the RSI could reach a neutral 50 and present another possible entry point. The Gold Miners Bullish Percent Index (BPGDM) remains at a pretty neutral 46.67. A breakout for the TGD would occur over 310.
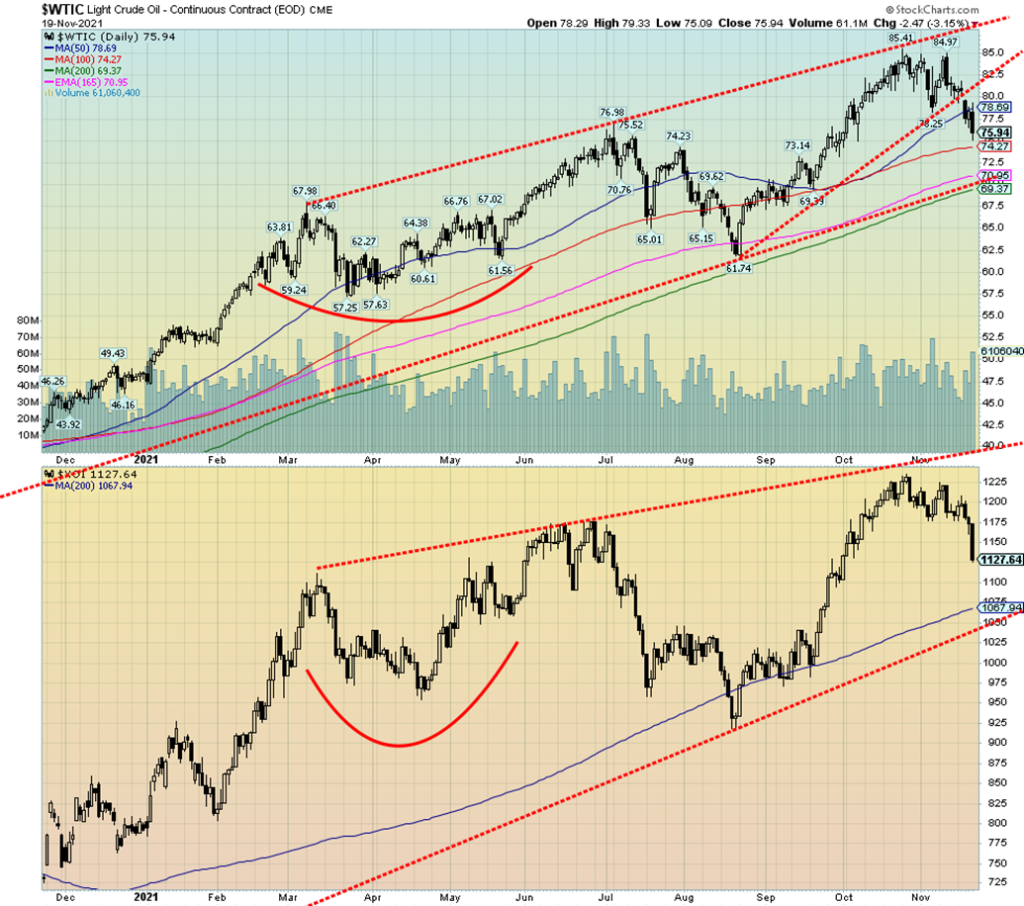
Last week we noted, given that WTI oil failed to make new highs and took out the last swing low at $78.25 made on November 4, oil prices could break and fall to about $71. That would largely coincide with the bottom of the channel. Well, WTI oil broke the swing low and the decline was swift. WTI oil fell 6.0% this past week to its lowest level since September. The bottom of the channel now looms. There is some interim support at $74–$74.50. Natural gas (NG) did not follow oil as the chaos of shut pipelines and more in B.C. sparked a 5.9% jump in NG prices on the week.
So, what happened? Shutdowns in the EU because of yet another outbreak of COVID are threatening to slow the economy, not just in the EU but elsewhere too. The U.S. dollar jumped to its highest level in months. Commodity prices including oil tend to move inversely to the U.S. dollar. As the U.S. dollar goes up, commodities including oil fall in price. Finally, China was joining the U.S. in the release of strategic reserves to help dampen price increases.
The fall in oil prices eventually translated in the energy indices taking a hit. The ARCA Oil & Gas Index (XOI) fell 4.7% on the week while the TSX Energy Index (TEN) was off only 2.9%. So, is this the end of the oil rally? We can’t say that yet. A solid break under $70 could suggest that the bull market in oil is over. We noted last week that the NG chart looked as if it were forming a significant top. We haven’t changed that thought despite the spike in NG prices this past week. A solid breakdown under $4.70 could target NG down to $3.00. The energy indices are rolling over but they too have not given us any major sell signal. The XOI breaks down under 1,000 while the TEN could break down under 130. The TEN at 160 has a way to go before reaching that level.
While the bottom of the channel near $71 appears to be a potential target and a breakdown gets underway under $70, the real breakdown and a major bear market doesn’t come until oil breaks under the August low of $61.74. The down pattern is negated if oil prices were able to regain above $85. In the interim, the short-term trend has turned down. And, despite the spike in NG prices, the short-term trend for NG also remains down.
__
(Featured image by sergeitokmakov via Pixabay)
DISCLAIMER: This article was written by a third party contributor and does not reflect the opinion of Born2Invest, its management, staff or its associates. Please review our disclaimer for more information.
This article may include forward-looking statements. These forward-looking statements generally are identified by the words “believe,” “project,” “estimate,” “become,” “plan,” “will,” and similar expressions. These forward-looking statements involve known and unknown risks as well as uncertainties, including those discussed in the following cautionary statements and elsewhere in this article and on this site. Although the Company may believe that its expectations are based on reasonable assumptions, the actual results that the Company may achieve may differ materially from any forward-looking statements, which reflect the opinions of the management of the Company only as of the date hereof. Additionally, please make sure to read these important disclosures.
David Chapman is not a registered advisory service and is not an exempt market dealer (EMD) nor a licensed financial advisor. He does not and cannot give individualised market advice. David Chapman has worked in the financial industry for over 40 years including large financial corporations, banks, and investment dealers. The information in this newsletter is intended only for informational and educational purposes. It should not be construed as an offer, a solicitation of an offer or sale of any security. Every effort is made to provide accurate and complete information. However, we cannot guarantee that there will be no errors. We make no claims, promises or guarantees about the accuracy, completeness, or adequacy of the contents of this commentary and expressly disclaim liability for errors and omissions in the contents of this commentary. David Chapman will always use his best efforts to ensure the accuracy and timeliness of all information. The reader assumes all risk when trading in securities and David Chapman advises consulting a licensed professional financial advisor or portfolio manager such as Enriched Investing Incorporated before proceeding with any trade or idea presented in this newsletter. David Chapman may own shares in companies mentioned in this newsletter. Before making an investment, prospective investors should review each security’s offering documents which summarize the objectives, fees, expenses and associated risks. David Chapman shares his ideas and opinions for informational and educational purposes only and expects the reader to perform due diligence before considering a position in any security. That includes consulting with your own licensed professional financial advisor such as Enriched Investing Incorporated. Performance is not guaranteed, values change frequently, and past performance may not be repeated.


Bitcoin Stalls Near $60K as Strategy Moves, ETFs Outflow, and EU MiCA Rules Take Effect
Bitcoin hovers near $60,000 with ETF outflows, while Strategy boosts reserves, sells BTC, and raises dividends to reassure investors. Ethereum...


Cannabis Dominates Global Drug Use: Trends, Risks, and Shifting Markets
Cannabis remains the world’s most widely used illicit drug, with 256 million users in 2024, surpassing all others combined. Growth...


Italy Approves First Hydrogen-Powered Train for National Rail Network
ANSFISA has approved Italy’s first hydrogen-powered train, the Alstom HMU214, for use on the Brescia–Iseo–Edolo line. Capable of 140 km/h,...


Cotton Market Weakness Persists Despite Brief Rebound
Cotton prices fell to new lows last week before a modest rebound. USDA data shows crop conditions remain worse than...


Eli Lilly Hits $1 Trillion Valuation Amid Strong Bullish Momentum
Eli Lilly stock hit a record high, surpassing $1 trillion market value after strong product demand. Shares surged over 7%,...
 |
|
 |  |
 |
|
-

 Crowdfunding2 weeks ago
Temotiva Launches Crowdfunding Campaign to Advance Preventive Mental Health
-

 Crypto7 days ago
Bitcoin Holds Steady as Microtransactions Surge and ETF Inflows Continue
-

 Biotech2 weeks ago
AseBio 2025 Report Highlights Growth and Future Potential of Spanish Biotechnology
-
 Cannabis5 days ago
Tilray (TLRY) Falls as Bearish Momentum Persists Despite Marketing Push