Business
The topping process continues, but some sectors such as gold and biotech benefit
It was barely noticeable but the Fed`s asset purchases may have slowed. This past week Fed assets actually went down $74 billion. Is the punch bowl being taken away? But the huge ramp up in bond purchases and liquidity provisions have seen the balance sheets of the Fed, the BOJ, the BOE, the ECB and the BofC soar. And the stock markets soared with it.

“What I’m looking at is not the day-to-day gyrations of the stock market, but the long-term ability for the United States and the entire world economy to regain its footing. And, you know, the stock market is sort of like a tracking poll in politics. It bobs up and down day to day, and if you spend all your time worrying about that, then you’re probably going to get the long-term strategy wrong. On the other hand, what you’re now seeing is profit and earning ratios are starting to get to the point where buying stocks is a potentially good deal if you’ve got a long-term perspective on it.” —Barack Hussein Obama II, 44th president of the United States, March 3, 2009; b. 1961
“I’m a strong believer in free enterprise, so my natural instinct is to oppose government intervention. I believe companies that make bad decisions should be allowed to go out of business. Under normal circumstances, I would have followed this course. But these are not normal circumstances. The market is not functioning properly. There has been a widespread loss of confidence, and major sectors of America’s financial system are at risk of shutting down. The government’s top economic experts warn that, without immediate action by Congress, America could slip into a financial panic and a distressing scenario would unfold. More banks could fail, including some in your community. The stock market would drop even more, which would reduce the value of your retirement account. The value of your home could plummet. Foreclosures would rise dramatically.” —George W. Bush, 43rd president of the United States, September 24, 2008; b. 1946
“It may be disappointing, but I think it is neither prudent nor appropriate for any president to comment on the hour-by-hour or the day-by-day movements of the market.” —William Jefferson Clinton, 42nd president of the United States, October 28, 1997; b. 1946
Clinton probably had it right. Apparently, Presidents Roosevelt, Hoover, and Truman avoided any mention of stock markets, especially in the wake of the 1929 stock market collapse and the Great Depression. President Reagan was predictably folksy about it after the 1987 stock market crash and President Carter, in his way, was more blunt about things, particularly after the sharp rise in oil prices in the mid to late 1970s. Predictably, President Obama was criticized for his remarks above about the stock market, with quips about his moving from being commander-in-chief to stockbroker-in-chief. We famously recall former Prime Minister Stephen Harper telling people that “good buying opportunities are opening up” during the height of the 2008 financial panic. That was on October 8, 2008. Afterward, the TSX Composite fell another 25%.
President Trump has taken a completely different tack from his predecessors. He tweets constantly about the economy and the stock market. He started on his first day in office and usually has a comment daily. That’s at least 1,245 tweets about the economy and the stock market. Some estimates have it as double or triple that number. He hangs his presidency on the performance of the stock market and the economy. No wonder there’s constant pressure on the Fed to lower interest rates and ramp up bond buying to help push up the stock market.
As we have consistently pointed, one can thank the Fed for this stock market rally. And, as an extension, one can thank the central banks of the major economies for their policies that have benefitted the stock market. So, it is the Fed, the BofC, the BOJ, the BOE, the ECB, and even PBOC we should thank. Without their largesse of bond-buying ramping up their balance sheets to unheard-of levels, the stock market today might be even lower than it was in March 2020. No wonder sudden stock market guru, founder of Barstools Sports Dave Portnoy quips that “stocks only go up.” Well, they do, until they don’t.
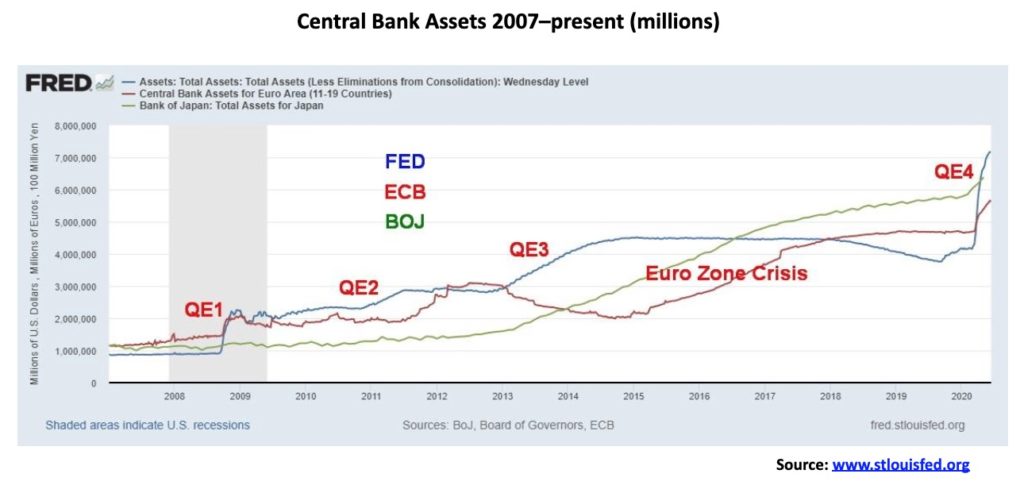
Since the beginning of March 2020, the central banks have seen their assets grow considerably. The Fed is up US$2.5 trillion, the European Central Bank (ECB) is up €1.0 trillion, and the Bank of Japan (BOJ) is up ¥0.5 trillion. During the same period, assets for the Bank of Canada (BofC) rose about Cdn$350 billion, almost tripling. And fiscal deficits have exploded as well. In the U.S., a record $3.5 trillion and heading higher. In Canada, $250 billion and probably headed higher.
Then it should be no surprise that the stock markets have responded. There is a direct correlation.
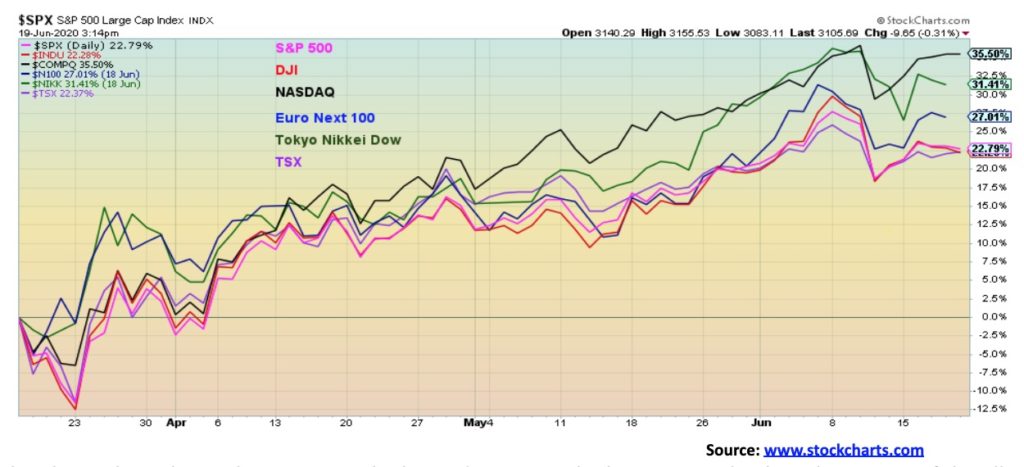
The above chart shows the return on the key indices since the lows in March when the impact of the all the monetary stimulus began to kick in. The TSX has gained 22.4%, the S&P 500 is up 22.8.0%, the Euro Next 100 jumped 27.0%, the Dow Jones Industrials (DJI) up 22.2%, the NASDAQ up 35.5%, and the Tokyo Nikkei Dow (TKN) has gained 31.4%. The Fed has said it will not be deterred from pursuing its mission just because the stock market is rallying. At the current rate, the Fed balance sheet could be at $10 trillion in a year or so, up from the current $7 trillion. And we have a president to re-elect, not that a connection could be made. While Fed Chairmen have fought with presidents indirectly, they are more often deferential to their wishes, again indirectly. Or as Trump has discovered the Fed refuses to take his bait and comment on the president`s wishes.
The Fed obviously doesn’t seem too concerned that they may be creating stock market bubbles. They are also creating another bubble in debt as corporations have scrambled to issue debt in 2020. The bulk of it has been high-grade corporate debt, but when one reads that bankrupt companies like Hertz were trying to raise between $500 million and $1 billion one knows that something is wrong. Hertz is a company already under $20 billion in debt and its inventory of cars is overpriced. The stock is probably worthless. Hertz failed in its attempt to raise cash but, overall, more than $1 trillion in new corporate debt has been issued in 2020 to either restructure debt, build cash reserves, or pay down bank lines for U.S. corporations.
Could the debt rush be creating zombie companies? We note that some of the biggest stock gainers since March have been airlines, cruise lines, and retailers and they have also raised fresh debt. Airline and cruise companies have seen their business collapse over 80%, yet, amazingly, in the recent rebound some of their stock was up 90%. The reality is they won’t be coming back any time soon and they will, no doubt, crash once again.
Zombie companies and zombie banks was usually something we thought of when referring to Japan or even China, but now zombie companies appear to have come to the U.S. Zombie companies are ones that continually need life support (i.e., debt/loans) to stay alive. Allowing them to collapse would be too devastating to the economy in terms of sharply rising unemployment, collapsing GDP, and debt defaults. The creation of zombie companies has been ongoing since the Great Recession and the massive bailouts by the TARP program.
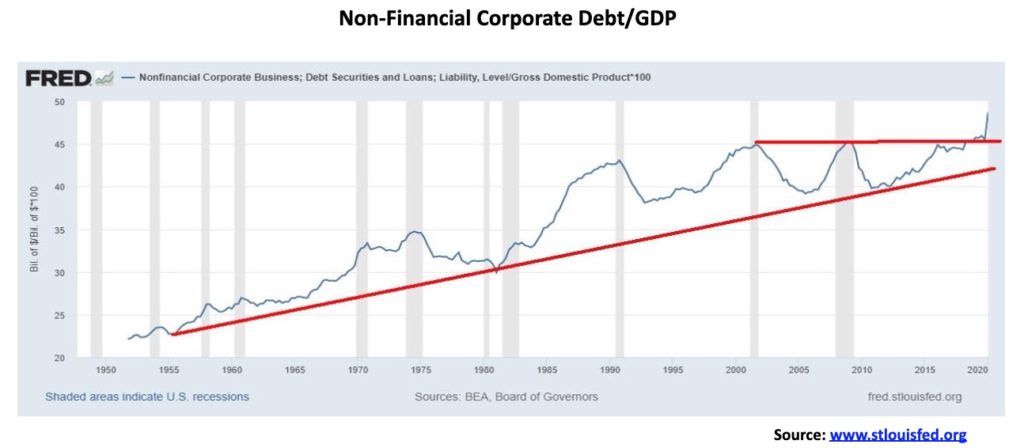
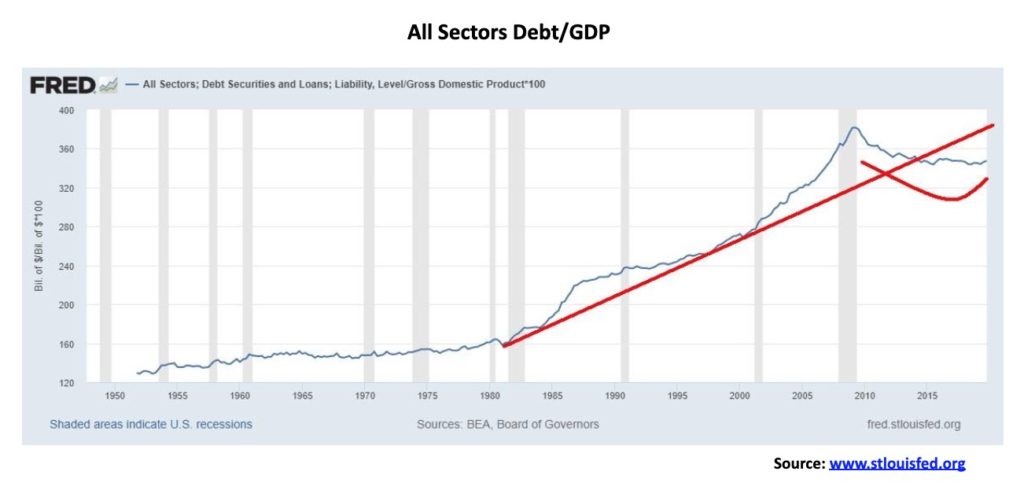
Nonfinancial corporate debt to GDP in the U.S. has soared from 45% to 50% in Q1 2020. This breaks out of a level that had been capped since the 2007–2009 recession. But it is not just corporate debt that is a problem. It is all debt. The chart below shows total U.S. debt (Government – Federal, State, Municipal; Corporate, both loans and securities – non financial, financial; Consumer – mortgage, credit cards, auto loans, student loans, credit lines) to GDP. Today, U.S. all-sectors debt sits at $79.5 trillion, a rise of $29.2 trillion or 37% since 2008. That’s almost 400% of GDP and the U.S. is not even the highest in the world. That honour for gross debt to GDP belongs to Japan, followed by the United Kingdom.
But the U.S. is the most indebted nation in the world, holding an estimated 30% or more of total global debt with less than 5% of the global population. Could there be such a thing as a zombie country? Maybe even two or three? No wonder in the U.S. it has taken $3.25 of new debt to purchase $1 of GDP since 2010. Actually, that was nothing. From 2000 to 2010 it took $5.50 of new debt to purchase $1 of GDP. But that was a period that saw corporations and the consumer pile on the debt. Over the past decade the debt binge has been led by the Federal government.
Zombie companies. Zombie consumers. Rising debt all against the backdrop of a pandemic, a depression, a deeply divided nation, protests and riots on the streets, and led by a dysfunctional president. And, lest we forget, the potentially negative effects of climate change still lurk in the background. Hopes for a V recovery seem to be just that—hope. More likely wishful thinking. Maybe it’ll look like a W, but really more like a w.
Ask Japan. They have been going through this for 30 years. The Western economies, which include North America, the eurozone, and Japan will limp along, only fitfully coming out of the current hole. One can only hope that the central banks continue their bond buying that helps keep the stock market afloat. While that certainly helps Wall Street it does almost nothing for Main Street. But just how big can they grow their balance sheets? And just how much inequality are we willing to endure? Is the sky really the limit? Probably not. And on a negative note we see that in the past week the Fed balance sheet actually fell $74 billion. Could the Fed be taking away the punch bowl? The stock market won`t like that.
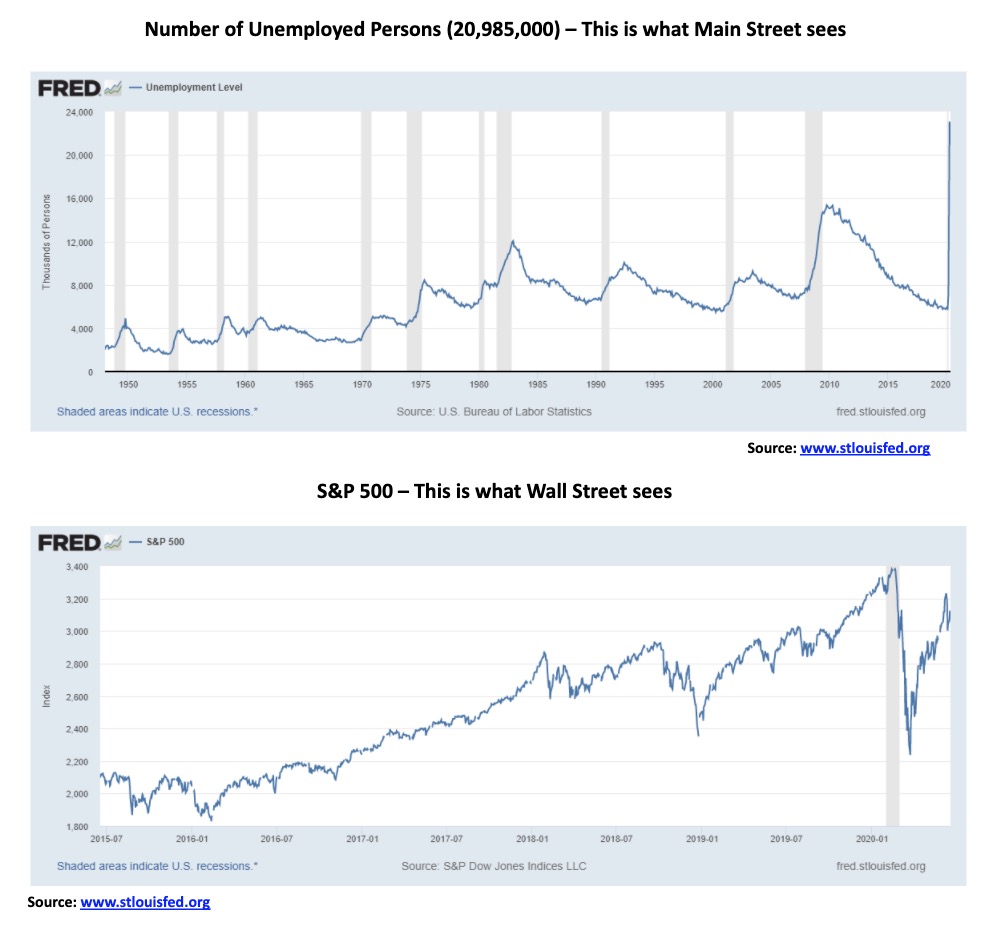
Main Street sees sharply rising unemployment and, we might add, falling job vacancies. Officially, it says it is 20 million unemployed. The reality is, it is more like 40 million unemployed. Thousands of small and medium sized businesses are closing their doors and will never come back. They are dodging not only the shutdown, but they are also dodging riots. There is just no precedence for what is going on. Wall Street sees a sharply climbing stock market. It is a divide that cannot be bridged by $600 (U.S.) or $2,000 (Canada) cheques that, in the end, have a time limit on them. What happens when the cheques run out and employment has not returned? If the situation remains that way beyond the end of the assistance cheques, there is some likelihood of even more social unrest, especially as the U.S. goes into the November election. This election is already a deeply divided one that could become and, in many instances, has already become a flashpoint for more unrest.
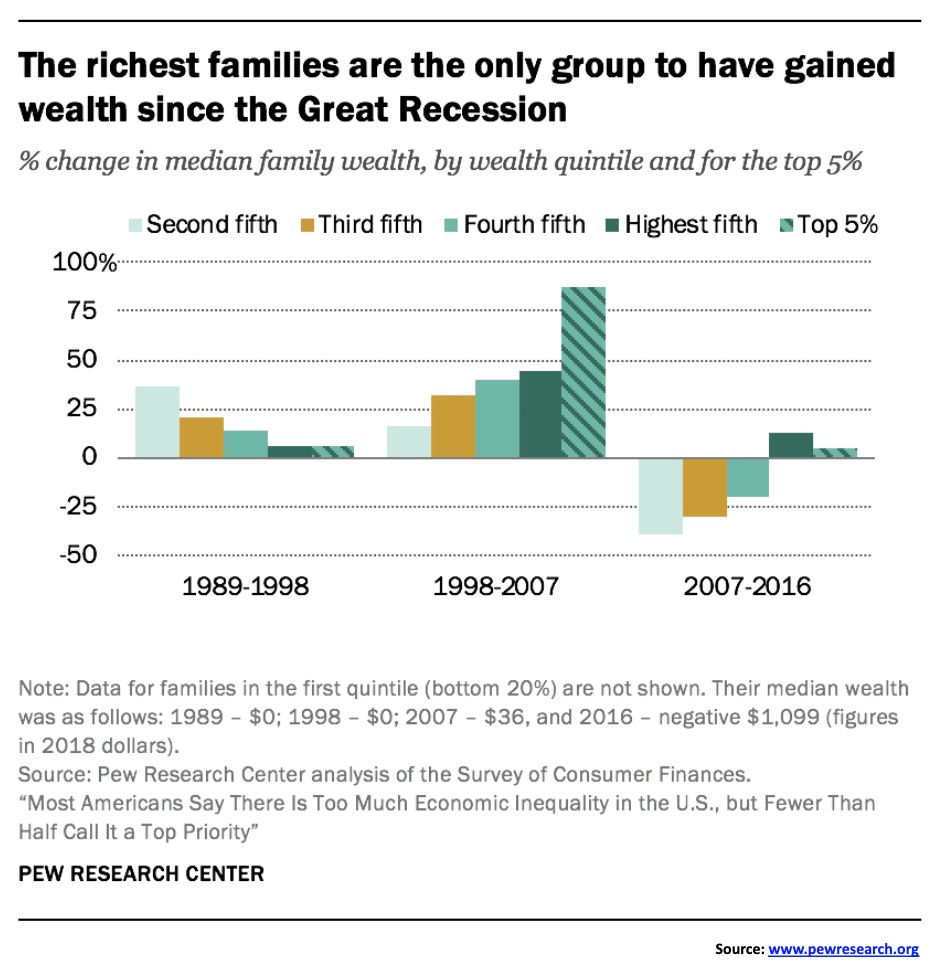
Herein lies the source of one of the major problems in the U.S. today. The chart only goes to 2016, but if it were updated it would show that it is even more skewed to the highest fifth and the top 5% than it was then. After the financial collapse of 2008, the benefits went primarily to those in the highest fifth and the top 5%. The bottom groups have been falling further and further behind. The share of the wealthiest fifth is higher than it has ever been in the U.S. and that plays out in many other countries as well, including Canada. Also, the wealthiest have much more say and influence in politics than they have ever had. In another time it took a Great Depression and a global war to level the playing field. Does history repeat itself? Or at least rhyme? Wall Street can only hope the Fed doesn’t pull away the punch bowl.
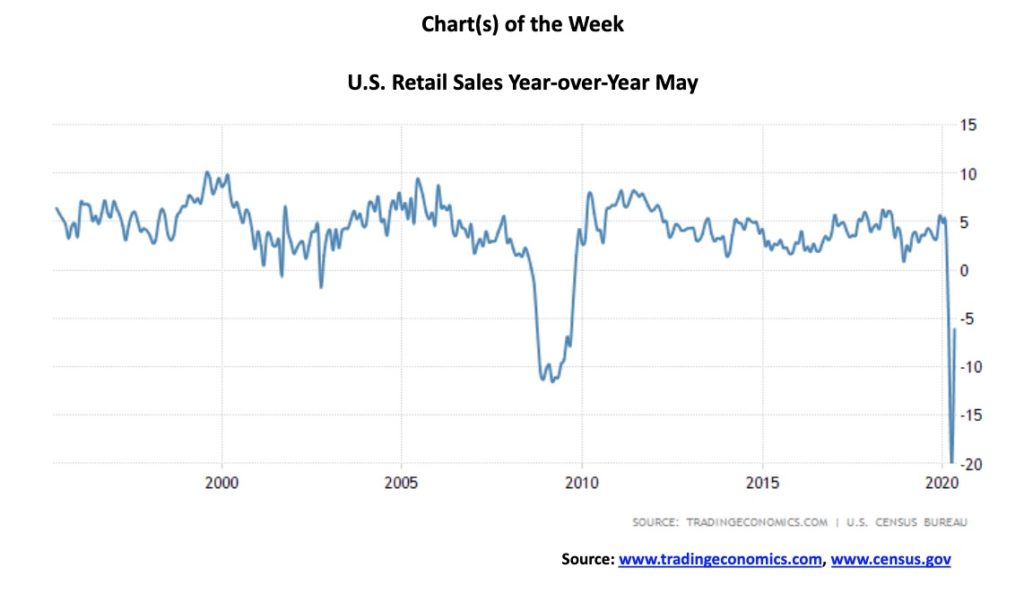
We will continue featuring recent economic reports as our chart(s) of the week. First up are U.S. retail sales. There was some excitement when it was announced retail sales jumped 17.7% in May over April, as the market had expected only an 8% gain. The previous month had seen retail sales plummet 14.7%. Despite the monthly gain, retail sales remained down 6.1% on a year-over-year basis. Still, that was quite an improvement from the year-over-year April decline of 19.9%. Despite the improvement, retail sales remained mired at levels that are worse than what was seen during the Great Recession in 2007–2009. Given that more states are opening up in June, retail sales are expected to see further improvement. But will it be enough to pull the year-over-year change into positive territory?
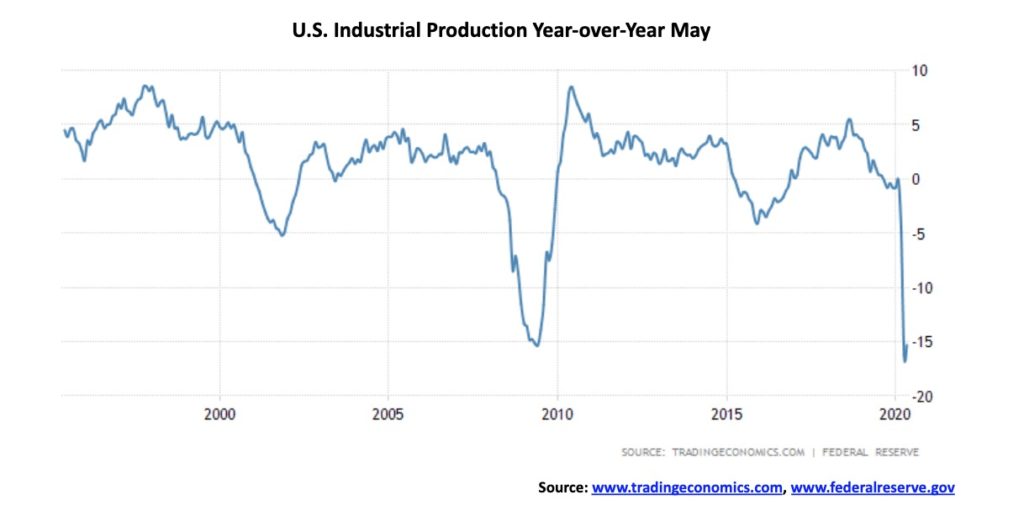
Industrial production plunged 15.3% in May over May 2019. This was a slight improvement on the upwardly revised 16.2% Y-o-Y April report. On a month-over-month basis May saw a 1.4% increase. However, the market was looking for a 2.9% increase. On a separate note, capacity utilization for May was 64.8%, up slightly from the record low 63.97% recorded in April. That number was below the forecast of 66.9%. The long run average 1972–2019 is 80.1%, so the current recordings are depression levels. Current capactity utilization levels are below the worst levels seen during the Great Recession of 2007–2009.
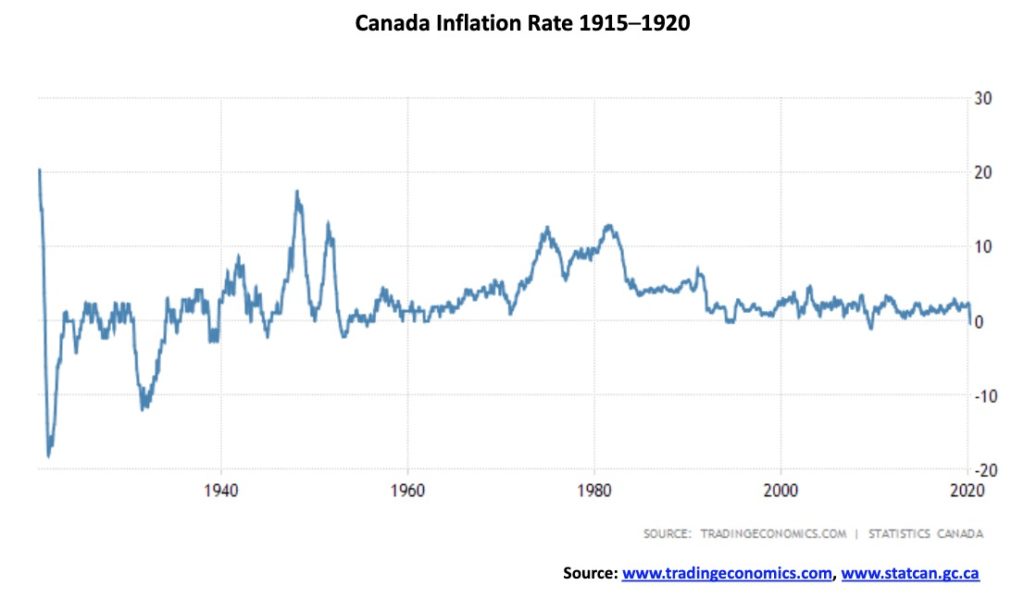
Canada’s inflation rate fell 0.4% year-on-year in May following a 0.2% fall the previous month. It was below market expecations of 0%. It was also the biggest decline since 2009. But, we note, this was not in the same league as the plunges seen during the Great Depression or what was seen during the depression of 1920–1921. The drop was primarily due to falling oil prices. Gasoline was down 29.8%.
Canada’s inflation rate fell 0.4% year-on-year in May following a 0.2% fall the previous month. It was below market expecations of 0%. It was also the biggest decline since 2009. But, we note, this was not in the same league as the plunges seen during the Great Depression or what was seen during the depression of 1920–1921. The drop was primarily due to falling oil prices. Gasoline was down 29.8%.
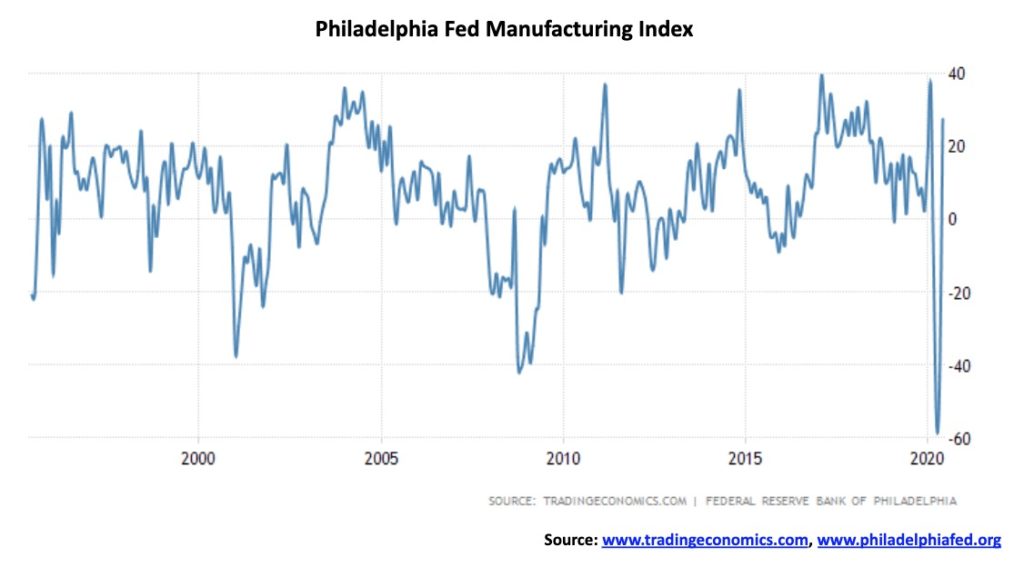
The Great Philly Hope? The Philadelphia Fed Manufacturing Index leaped an unexpected 27.5 in June. The market had expected a decline of 23. And it was a sharp improvement on the negative 43.1 recorded in May. It was the first positive report since February. The indicator can be volatile so we will watch carefully for the July Philly Fed. But, overall, it was a positive as firms are expecting a pick-up over the next 6 months.
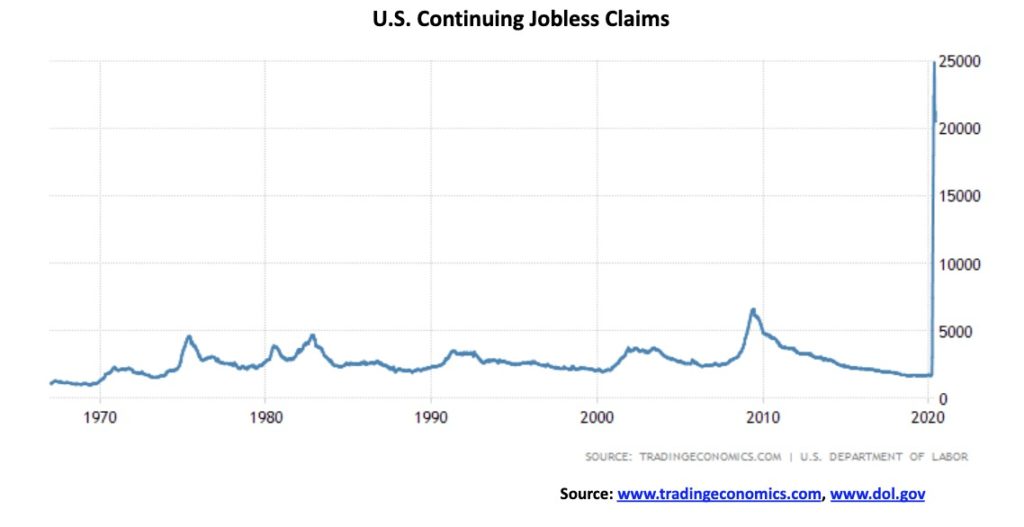
How do you show a big spike in continuing jobless claims? Well, exactly as you see. Continuing jobless claims remained highly elevated this past week at 20,544 thousand. That was a slight improvement from the previous week’s 20,606 thousand. Initial jobless claims came in at 1,508 thousand above the expected 1,300 thousand, showing that Americans are still losing jobs at a record pace. That’s 42.3 million since March. Unfortuantely, they had expected continuing jobless claims to fall to 19,800 thousand. The actual was well above expectations, showing how difficult it is going to be to get back to anywhere resembling normal. If you dig deeper, the job losses total almost 50 million in an economy that supposedly has a labour force of about 160 million. That’s almost a third of the labour force. Yet we have some declaring the recession is over.
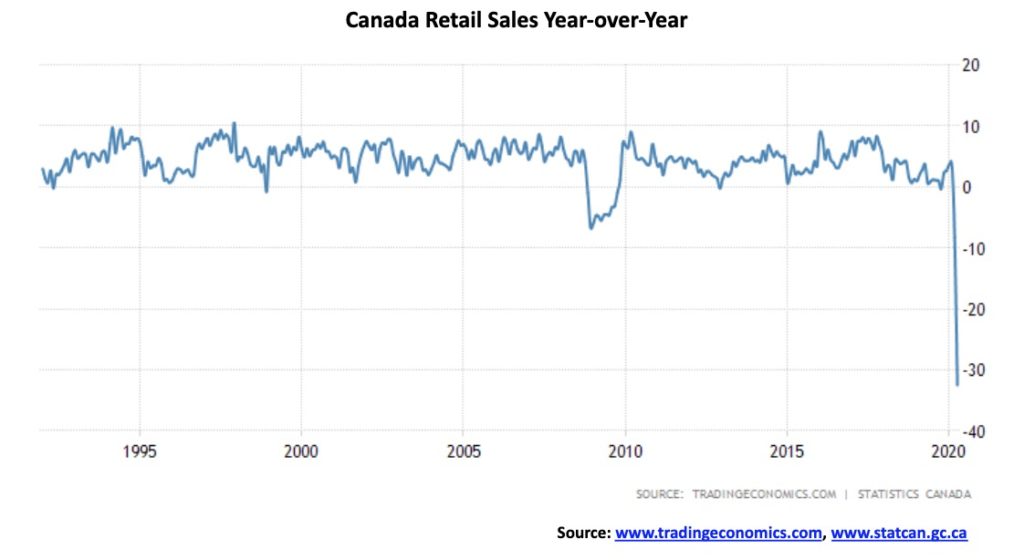
Yikes! Canada’s retail sales plunged year-over-year in April by 32.5%. We are bit behind in reporting, but we expect to see an improvement in the May report. The huge slump followed a downward revised 8.3% drop in March. On a month-over-month basis retail sales plunged 26.4%, well below the consensus decline of 15.1%. We can only guess that the message to Canadians is to get out there and buy. Buy something.
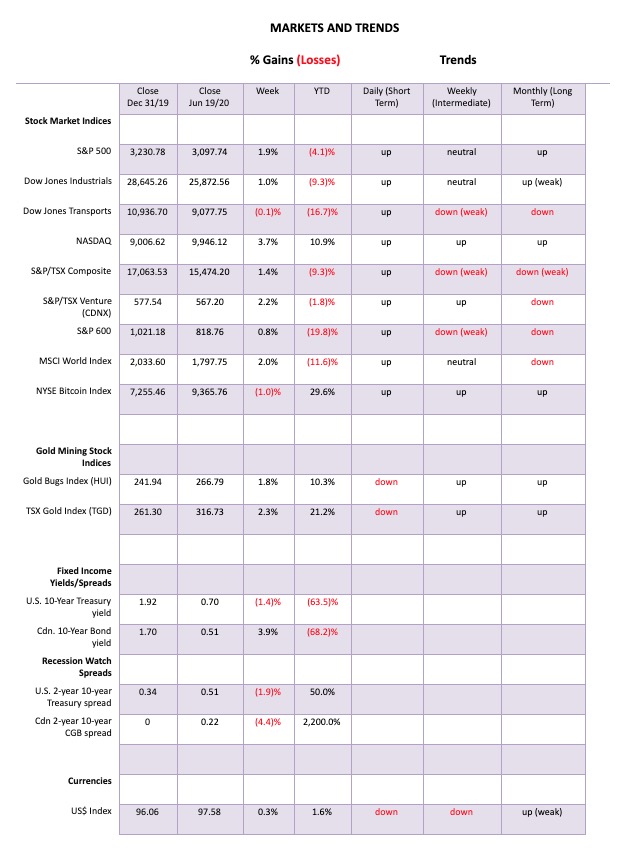
Bouyed by thoughts of a recovery, the stock markets recovered from the June 11 debacle and were up this past week. The S&P 500 gained 1.9%, the Dow Jones Industrials (DJI) was up 1.0%, the Dow Jones Transportations (DJT) was actually down but only a small 0.05%, while the NASDAQ continued to star, up 3.7%. The S&P 600 small cap was up 0.8%, lagging behind its big cap cousin. Here in Canada, the TSX Composite gained 1.4% while the TSX Venture Exchange (CDNX) was a little star, up 2.2%.
Overseas, the London FTSE gained 2.6%, the Paris CAC 40 was up 2.9%, and the German DAX gained 3.0%. In Asia, China’s Shanghai Index (SSEC) was up 1.6% and the Tokyo Nikkei Dow (TKN) was flat. The MSCI World Index gained 2.0% but we note that Bitcoin lost 1.0%.
There remains a high level of optimism that the worst is behind us. However, we are also sure that $3 trillion in QE from the Fed has helped goose the stock markets. All that money goes somewhere. But we are reminded that the coronavirus pandemic is not over and, given recent numbers, it is actually picking up with an alarming rise in cases in the U.S. Demand has fallen and ultimately that should result in a plethora of bankruptcies. The pandemic has hit the service industries the hardest with retail, travel, tourism, restaurants, and recreation (i.e., sports) badly hit. Given that there are continued demands for social-distancing and masks, these activities are not likely to recover very quickly. The service industries account for some 70% of employment and the economy. Global supply chains continue to undergo disruption and that is not going to be fixed overnight. You don’t just close your factory in one country and pop up in another overnight. Consumer demand, despite rising from the lows, is not going to return to 2019 levels anytime soon and that will act as a brake on economic recovery going forward.
The countries that have succeeded in controlling the spread of the coronavirus are the ones that put in place rapid lockdowns, contact tracing, masks, quarantines, and restrictions on movement. China, South Korea, Japan, Taiwan, and New Zealand all fall in that category to varying degrees. Others in Europe such as Spain and Italy did it as well, but belatedly. They are now finally bringing the coronavirus under control. Poorly organized countries or ones outright dismissive of the coronavirus are still suffering from elevated and/or rising cases. In that category are the U.S., Brazil, India, Pakistan, Russia, and, to a lesser extent, Mexico, Saudi Arabia, and Chile. Globally, the number of cases continues to rise with a record 181 thousand on June 19. Deaths hold steady but overall the world is on pace for at least 35 million cases by year-end and 1.5 million deaths. But, we note, it varies from country to country with some rising and others falling (i.e., Canada).
Against this backdrop we learn that Wall Street is expecting vaccines will appear before the election in order to help Trump’s chances. Most scientists don’t hold that view, predicting it will be 2021 before a vaccine is found. Overall, there is little reason to expect that we won’t be living with the coronavirus into 2021. There are 13 vaccines being worked on right now and well over a 100 in early-stage development. Two leading ones are AstraZeneca Plc (AZN-NYSE) and Moderna Inc. (MRNA-NASDAQ). They are leading the charge, driving biotech stocks higher.
Stocks reversed on Friday as coronavirus cases climbed in the U.S., particularly in the south (Texas, Florida, Arizona, California, Oklahoma) and Apple announced they were closing a raft of stores once again (Florida, Arizona, North & South Carolina). Trading was heavy on what was triple witching day Friday (stock index futures, stock index options, and stock options expiries). It was a wild day with the DJI at one point up well over 200 points, then down well over 200 points before closing down 208 points.
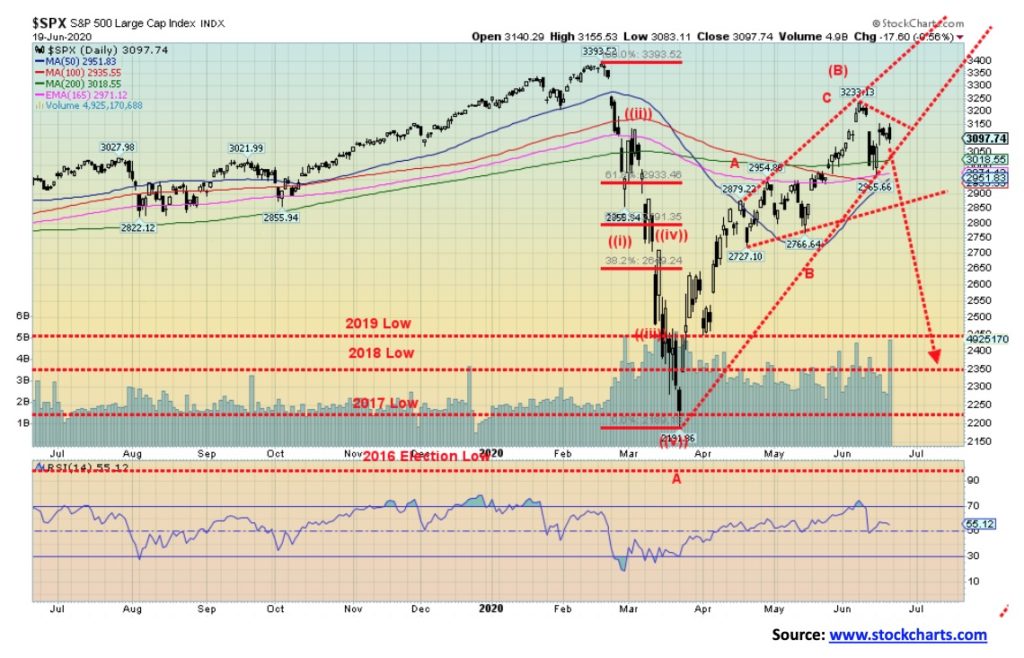
The S&P 500 has been trying to fill that gap left on June 11 but it may have fallen short. With a high on Friday of 3,155 it was short of the low of June 10 of 3,181. As well, the S&P 500 put in an outside day with a lower close, a negative sign. Besides triple witching, this weekend sees the summer solstice and an eclipse of the sun on June 21, the day of the summer solstice. These events often bring trend changes and volatility to markets.
All of this appears to point to lower prices this coming week. The breakdown point for the S&P 500 is at 2,965 although we prefer 2,950. Confirmation comes with a major breakdown under 2,850. The expectation is that we could see a return to the lows of March 2020, although it probably won’t be a straight down affair but one with many twists. The big break may not come until the fall.
The market appears to have completed a possible ABC-type correction from the March lows. Speculative intensity has reached a bit of a fever pitch with Robinhood traders and others. As noted, volume was quite high on Friday. If the market can fill that gap and move to new highs, then the advance should continue. Otherwise, our suspicion is a top is in.
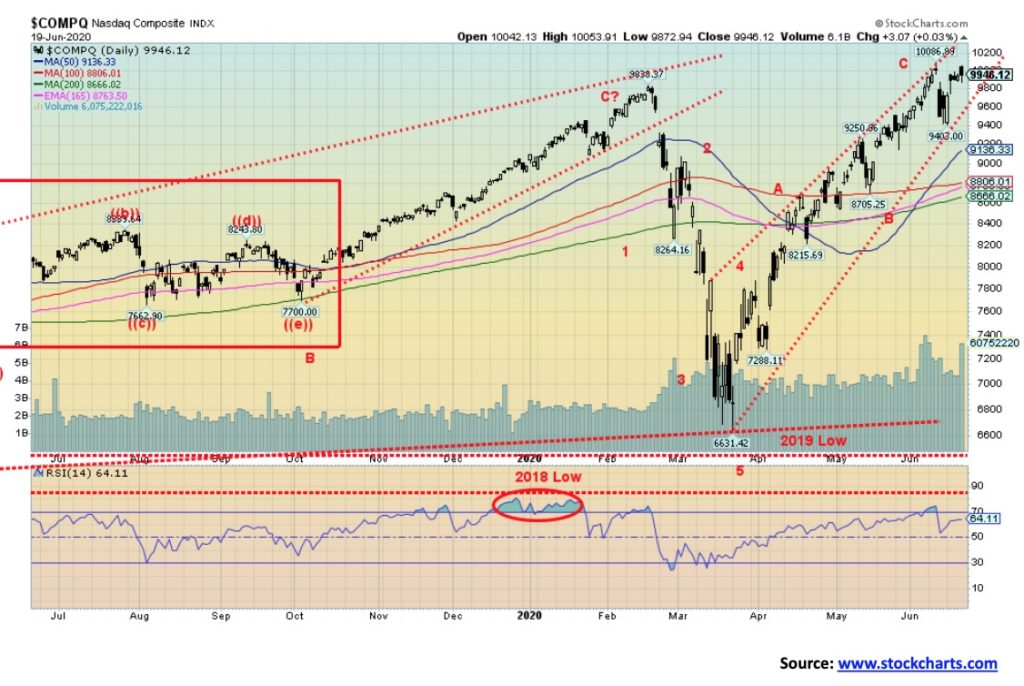
The NASDAQ continues to be the only major index that moved to new all-time highs on this current rally. The NASDAQ might even continue to outperform because of high-tech stocks and biotech stocks that we believe are places to be. The NASDAQ, like the others, fell sharply on June 11 but it did not leave an island reversal on the charts like the others. It also closed most of the gap down from June 11. Still, the NASDAQ reversed on Friday with the others but still managed to close up ever so slightly on Friday, unlike the S&P 500 and the DJI both who closed down on the day. The NASDAQ continues to diverge with the others. The NASDAQ breaks down under 9,400 and the breakdown is confirmed under 9,100. However, the NASDAQ does not enter a bear market again until it breaks down under 8,600. New highs could change that scenario.
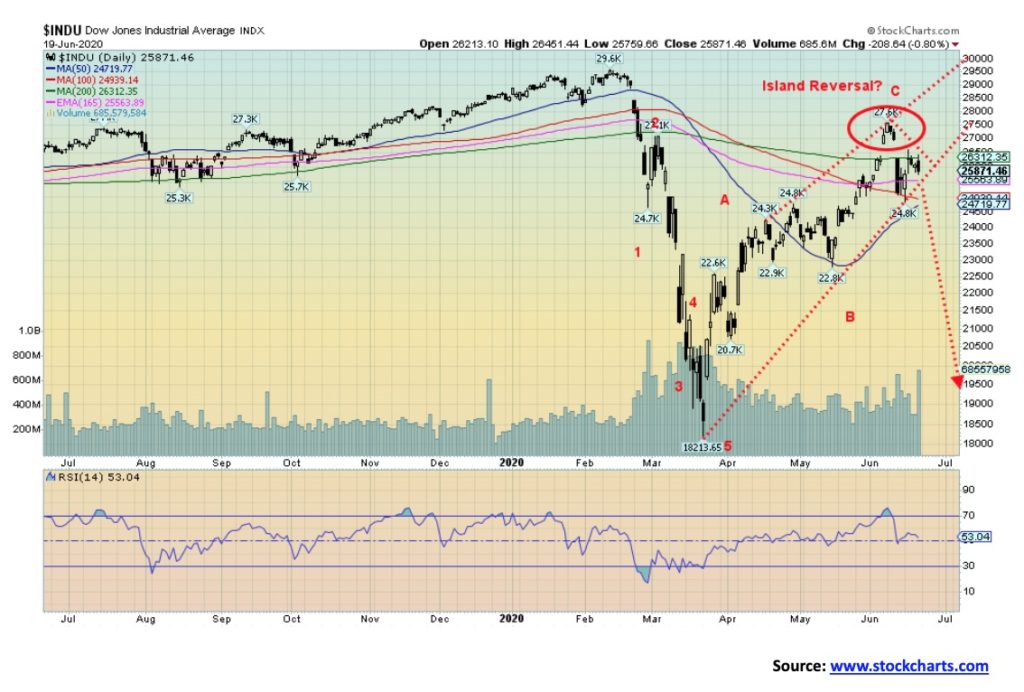
The DJI has underperformed recently and may be leading the way down. Actually, the DJT has been worse. The DJI did break out over the 200-day MA, but the DJT failed to do the same, a non-confirmation divergence. The DJI left a potential island reversal on the charts and, this past week, the DJI failed to close the gap, a negative sign. We managed to stay above 25,750 this past week, a level where we could consider the DJI to be breaking down. Confirmation of a breakdown would be seen under 24,700. But the weak closing on Friday, coupled with an outside reversal day, suggests to us that the next move is down.
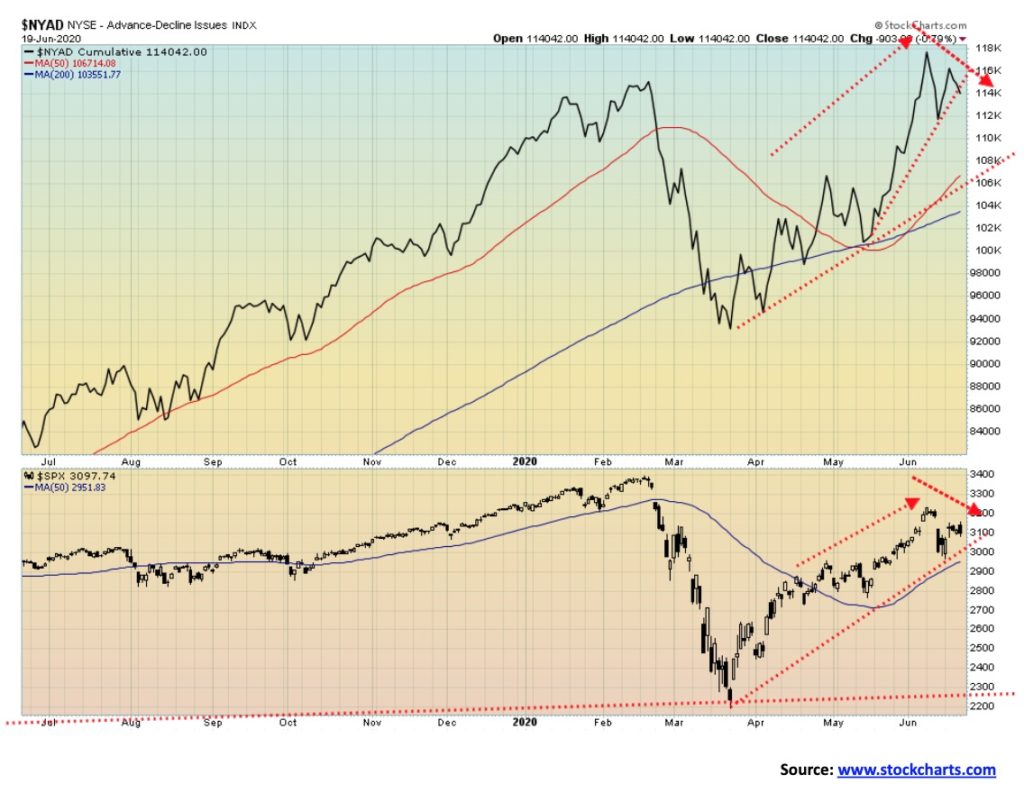
The bulls’ great hope remains the NYSE advance-decline line. It still appears to be bullish, having made new all-time highs and remaining well above its 200-day MA. The S&P 500 climbed over its 200-day MA but it has not been a huge move over. Nor did the S&P 500 make new highs along with the AD line. That’s a divergence. The bulls say it is bullish. We’ll see.
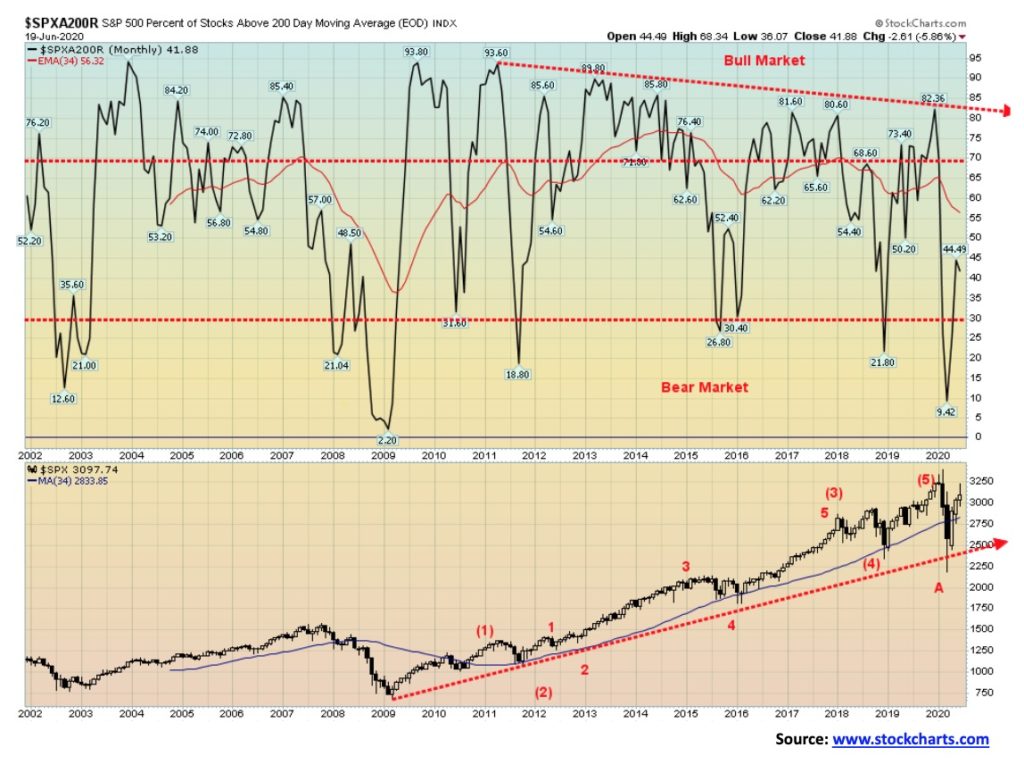
While this is a monthly indicator, the S&P 500 percent of stocks trading above their 200-day MA is not what we would call robust. We have consistently noted that the recent rally was led by a few, primarily the FAANGs and Microsoft. At 41.9% it is not exactly robust. The S&P 500 managed to regain its 34-month MA but the % index has failed to achieve that level. This is more indicative of a bear market bounce than the start of a new bull market. The 34-month MA is currently at 2,833 for the S&P 500 so a breakdown under 2,800 would signal problems.
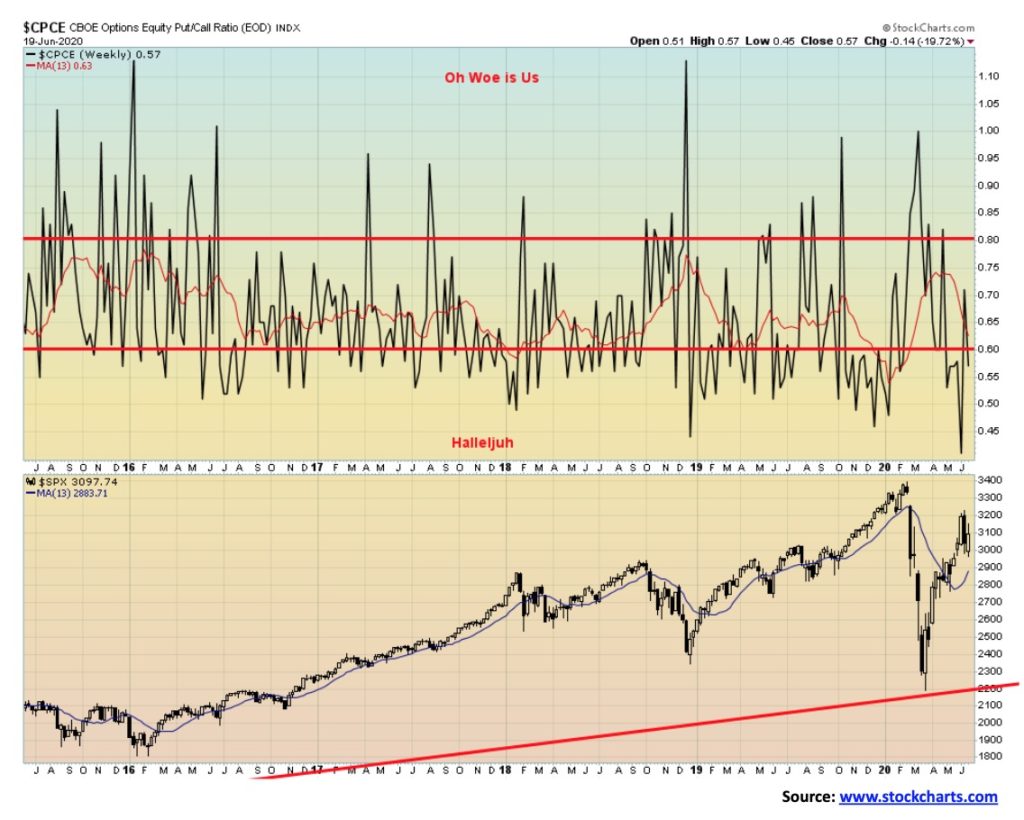
Surprisingly, or maybe not so surprisingly, the amount of call option buying jumped again as the S&P 500 recovered from the initial plunge seen back on June 11. The CBOE put/call ratio fell to 0.57 back in “hallelujah” territory. In other words, the market became quite bullish once again. Given what we are seeing, that response is probably premature. Potential buying opportunities don’t show up until the indicator is back in “oh, woe is us” territory, meaning bear territory with far more puts than calls outstanding. That starts to come when the indicator climbs over 0.80. Back on June 8 the CBOE put/call ratio hit 0.37, a record low. The bulls were rampaging.
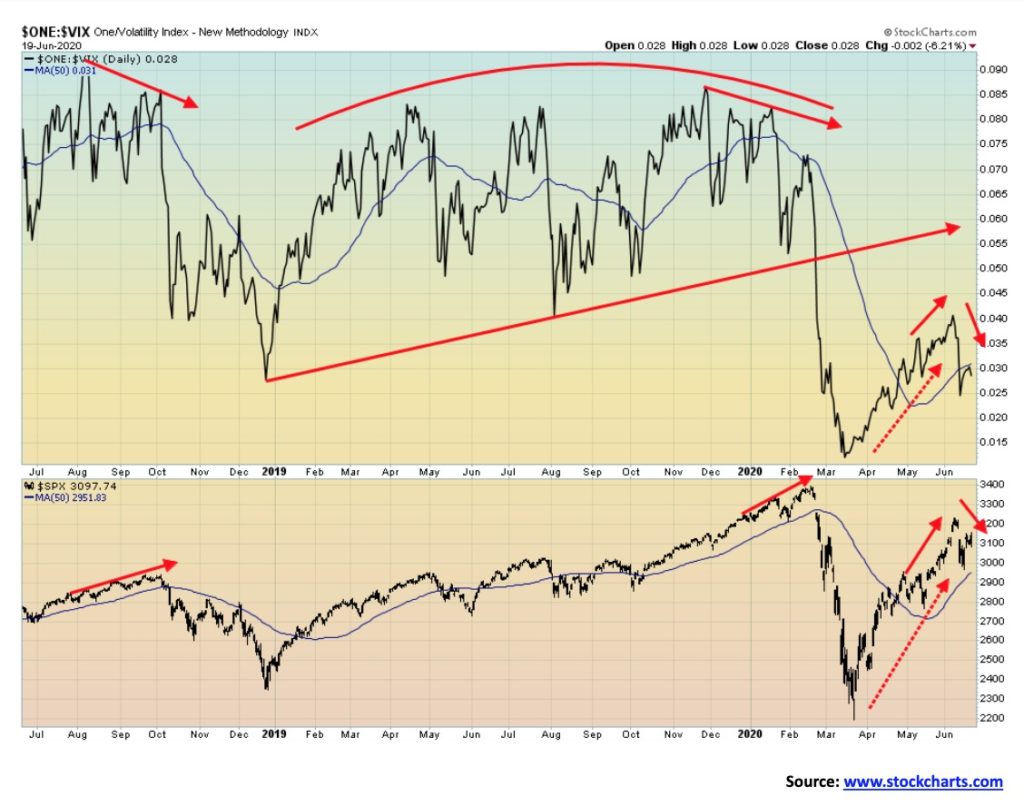
The VIX Volatility Index (inverted) has fallen back to 0.028, down from a recent peak of 0.0408. It has fallen under the 50-day MA and it has breeched levels seen in May 2020. The S&P 500 has not yet fallen under the 50-day MA nor has it breeched the levels seen in May 2020. So, there is a bit of a divergence between the two. We suspect the VIX is leading and, if that’s correct, then the S&P 500 should follow to the downside. As we have noted, we believe a top is in. The S&P 500 breaks down under 2,950.
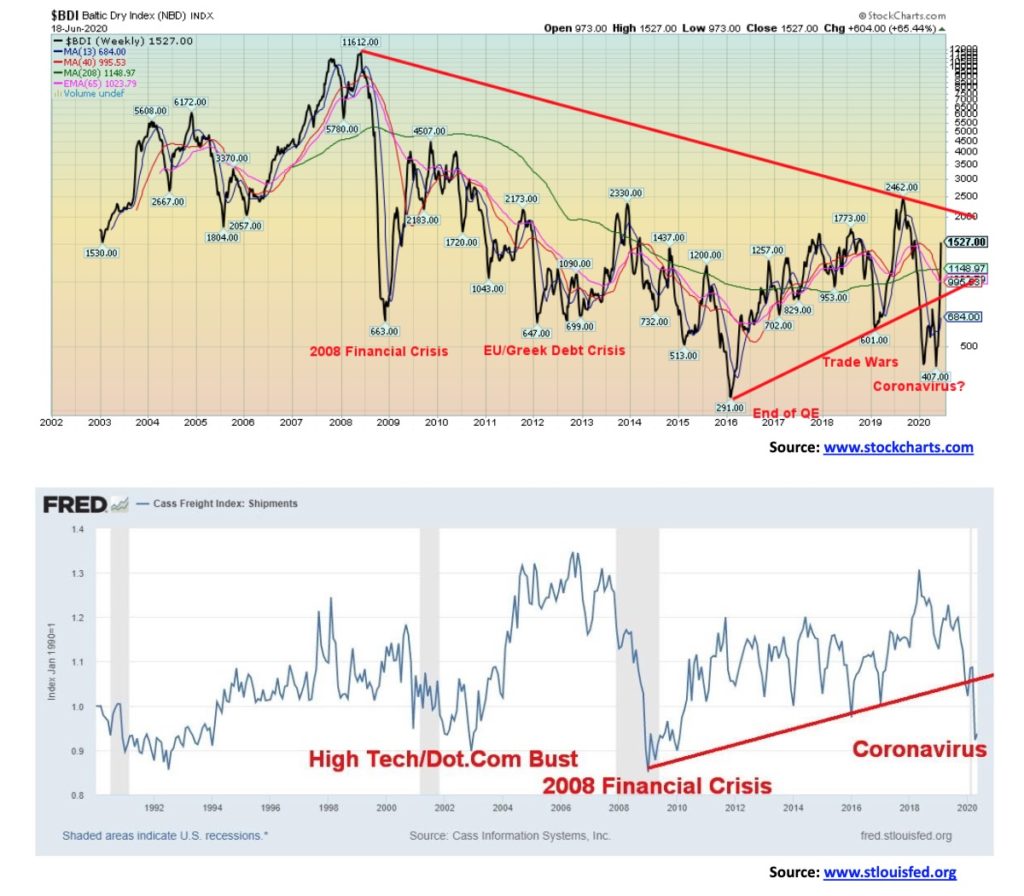
Above are two charts. One is the Baltic Dry Index (BDI), a proxy for dry bulk shipping stocks and a general shipping market bellwether. The other is the Cass Freight Index, a measurement of monthly freight shipping in North America and an economic indicator measuring economic trends. The BDI is now at its highest level in months and above 1,000 for the first time since December. There appears to be increased activity in shipping as lockdown measures are loosened. Previously it fell as a result of the lockdowns and decreased activity, due to falling demand and the movement of freight.
The Cass Freight index has fallen 11% in 2020 and is down 28% from a peak in May 2018. So far, it is not giving any indication of a pickup as economic activity remains weak. And, given the sharp increased levels of the coronavirus in the U.S., it may not improve anytime soon. It is fast approaching the levels last seen during the 2008 financial crisis.
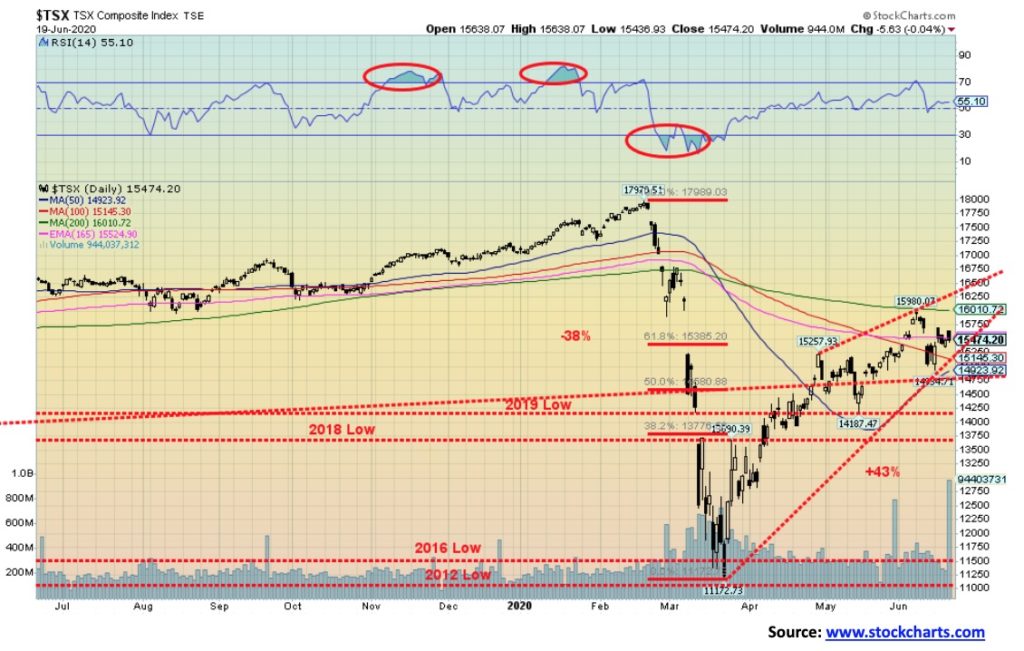
The TSX Composite rose 1.4% this past week, but like other indices reversed and fell back on Friday on high volume. As with the others, it signals a potential top. After spending the past four days trying to fill the gap left on June 11, it is possible the index, like the others, is failing and signaling that the next move will be down, not up. The TSX Venture Exchange (CDNX) could be doing the opposite as it gained 2.2% on the week and is now down only 1.8% on the year, making it one of the better performing indices we follow regularly. The CDNX, currently at 567 would break out above 600. Targets could then be up to 1,000. The CDNX is made up of over 50% junior mining stocks, predominantly gold miners.
Nine of the fourteen sub-indices were up on the week. Leading the way to the downside was the TSX Energy Index (TEN), off 4.2%. Other losers that investors should be mindful of were Consumer Discretionary (TCD) down 1.8%, Real Estate (TRE) off 1.4%, Telecommunications (TTS) down 0.6%, and Metals & Mining (TGM) off 0.1%. Of that group, only the Metals & Mining group appears to be a buy to us. Leading the way to the upside was Health Care (THC), gaining 5.1%. Golds (TGD) were up 2.3%, Materials (TMT) +2.2%, Utilities (TUT) +2.1%, and Consumer Staples (TCS) +2.9% were the strongest. TCS was strong on the heels of the giant grocery chains reporting record revenues. But the big winner on the week was Information Technology (TTK), jumping 4.9%. Of the TSX sub-indices, our favourites remain Golds, Materials, Metals & Mining, Information Technology and Biotech. Staples should continue to do okay and we have always thought Health Care should be doing better, but then long-term care homes are in the category. However, there might be select biotech stocks that should fare well if they are connected to finding solutions for the coronavirus.
The TSX has support down to 14,450, but below that level a breakdown could get underway. Below that, support could be seen at 14,250 and 13,750. Only new highs above 16,000 would change this scenario.
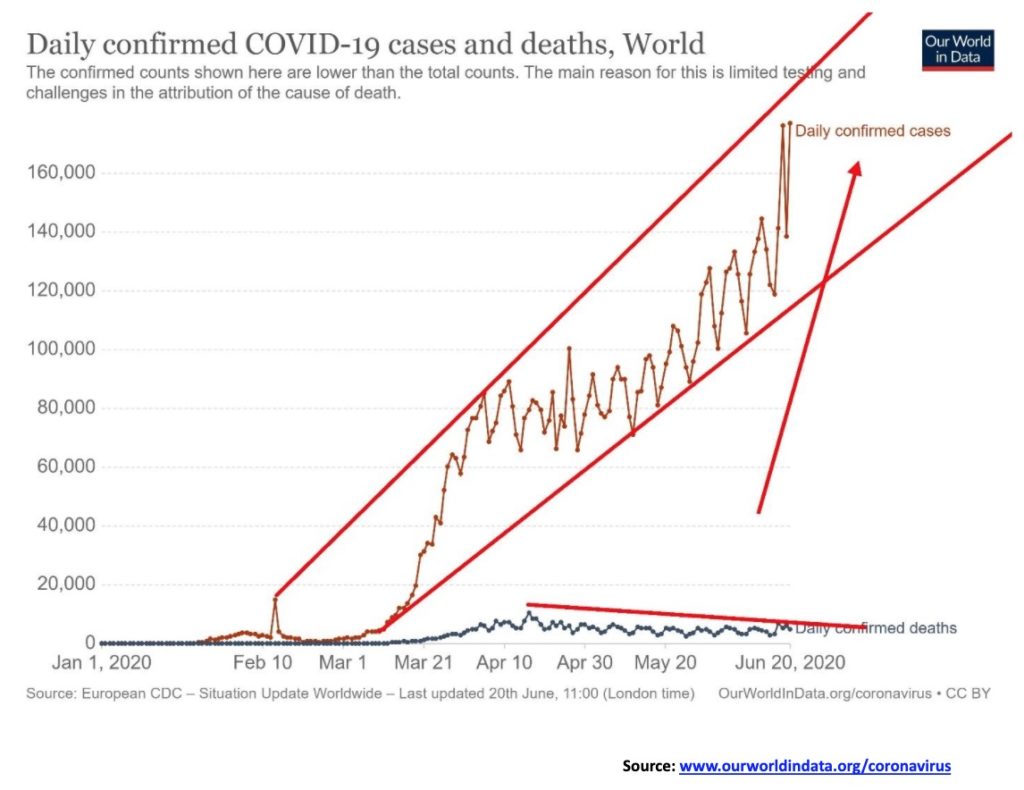
The number of coronavirus cases keep on rising globally. The surge is led by the U.S., Brazil, Russia, and India. Others seeing a surge are Chile, Mexico, Peru, Pakistan, Bangladesh, and, Saudi Arabia. A record 181 thousand cases were recorded on June 18. The number of cases globally is poised to surge through nine million. Meanwhile deaths remain somewhat static despite the sharp rise in cases. That`s the good news. The number of cases in the U.S. has soared past two million. Brazil has now soared past one million while Russia is well over 500,000. India is fast approaching 500,000 cases and most likely many are not properly recorded. The U.K. is over 400,000. The U.S. still leads in deaths but Brazil is now second with over 50,000. Interesting that both the U.S. and Brazil are number one and two given the dismissiveness of the coronavirus by their respective presidents. Could there be a correlation?
June 21, 2020, 16:02 GMT
Number of Cases: 8,972,140
Number of Deaths: 467,786
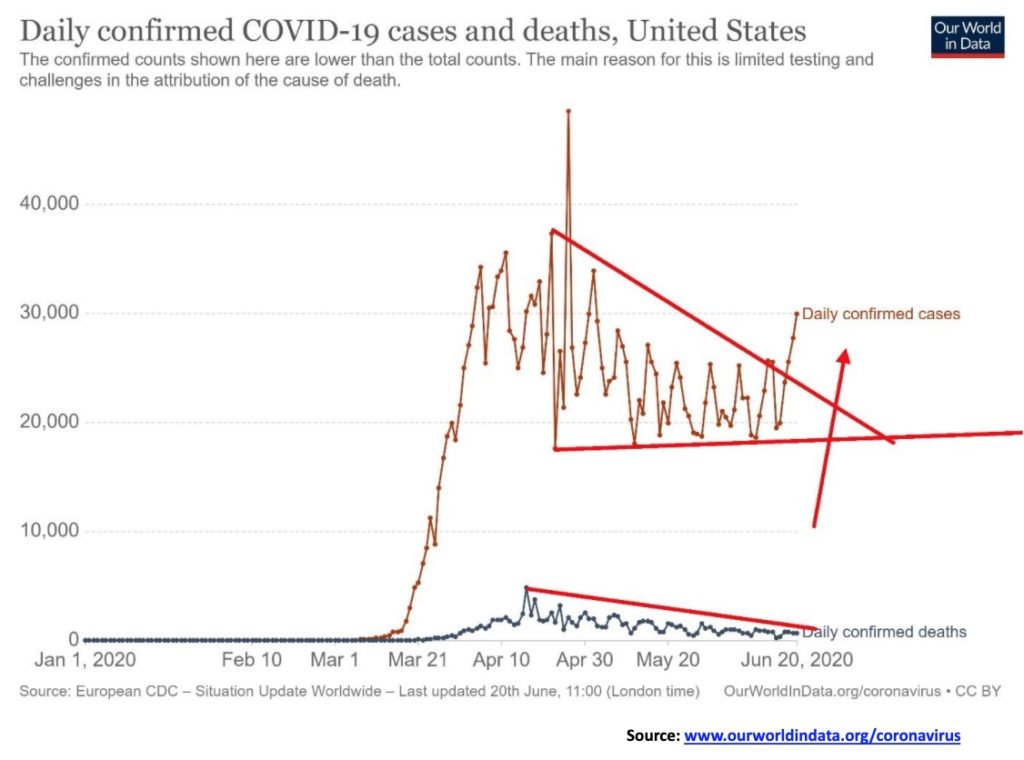
The U.S. is opening up and possibly to no ones surprise the number of cases is rising as well. Especially in southern states such as Florida, Texas, Oklahoma, and others. These states were more dismissive of the coronavirus and opened up too soon according to some. The U.S. cases broke out of a triangle to the upside. This bodes poorly. We expect to see the U.S. remain elevated for sometime. But the number of deaths has been generally on a downward trajectory.
June 21, 2020, 16:02 GMT
Number of Cases: 2,339,603
Number of Deaths: 122,049
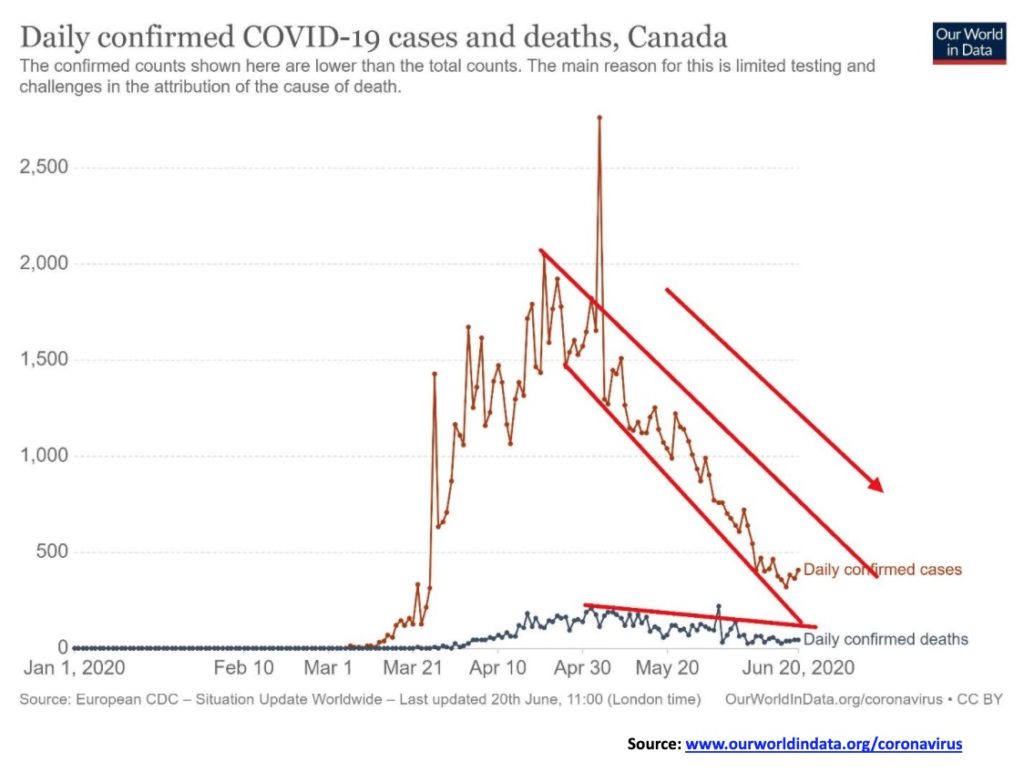
Does Canada have the coronavirus under control? The downward trajectory of cases and deaths would appear to support that argument. No Canada is not yet down to daily levels seen in China or South Korea. Nor are we anywhere near Taiwan, a country of 25 million on an island where the bulk of the population lives on the eastern 1/3rd of the island as the western 2/3rds is quite mountainous (no not Rocky Mountain mountainous). The number of cases since the pandemic outbreak is no more than what Canada now records on a normal day. Quarantines, contact tracing, mandatory masks and others are normal in Taiwan. Life is quite normal even if somewhat constricted with rules.
June 21, 2020, 16:02 GMT
Number of Cases: 101,286
Number of Deaths: 8,430
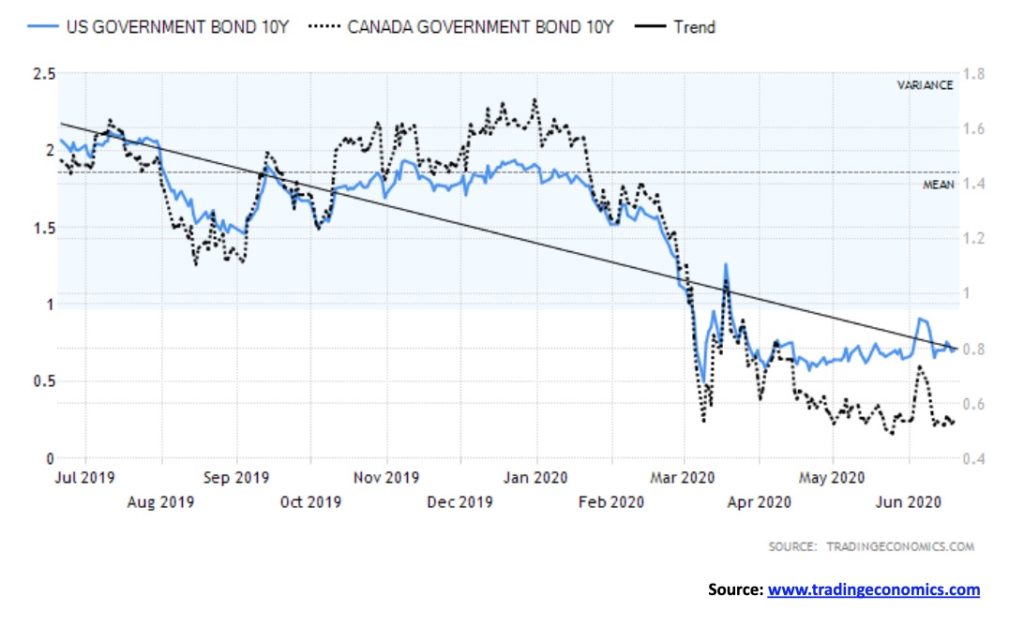
There is not a lot to say about interest rates this past week as both the U.S. 10-year treasury note and the 10-year Government of Canada bond (CGB) both remained steady with the 10-year U.S. slipping 1 bp to 0.70% and the 10-year CGB up 2 bp to 0.54%. The 2–10 spreads were also steady with the U.S. 2–10 at 0.51% and the Canadian 2-10 at 0.22%. With no expectation of any policy change by the Fed in terms of interest rates and, knowing they are keeping them at zero–0.25% until at least 2022, there is little incentive for interest rates to rise. Of course, the Fed could take away the punch bowl of bond buying (is that starting as we noted the drop of roughly $74 billion this past week in Fed assets) but really, we don’t see that happening anytime soon despite the drop this week. At best, they might fluctuate up or down but generally our expectation is that they continue to trade in a narrow range with occasional blips up (mostly) or even down.
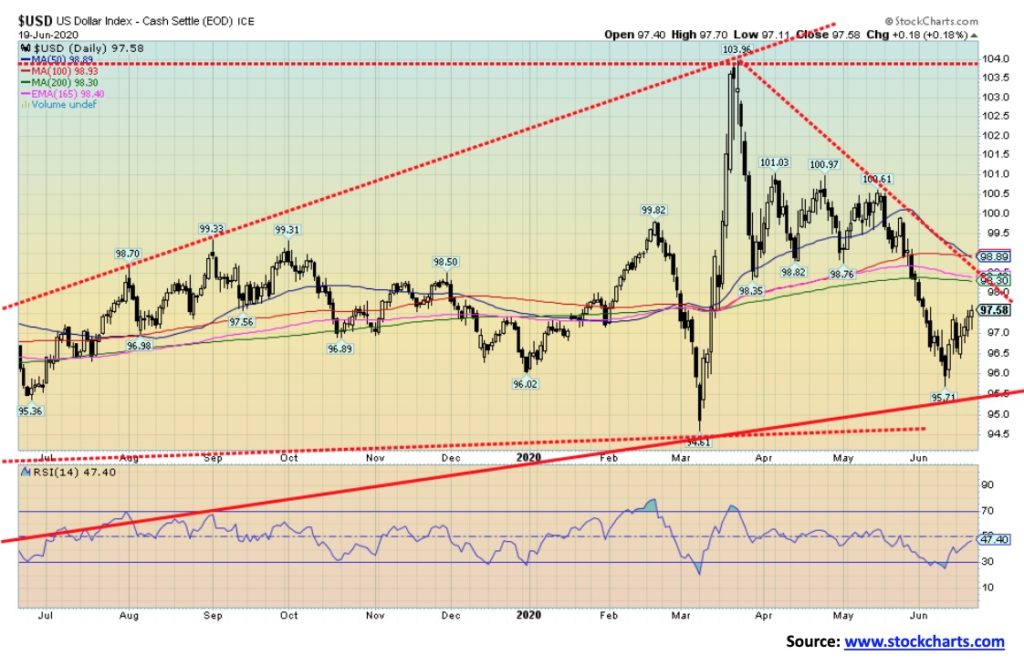
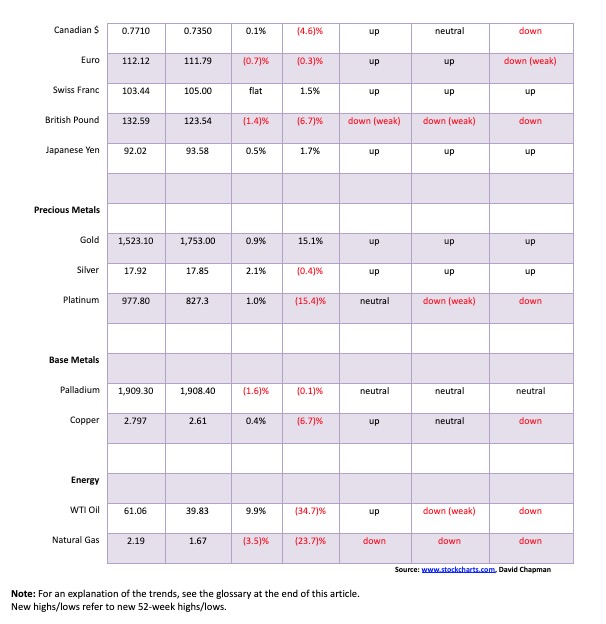
The US$ Index improved again this past week, rising by a small 0.3%. The euro was down 0.7% while the pound sterling lost 1.4% as the U.K. once again became Brexit-challenged. On the winning side—well, at least not losing—was the Swiss franc that was flat on the week, while the Japanese yen gained 0.5% and the Canadian dollar was up a small 0.1%. As we have noted, if there are any currencies one should own, the Swiss franc and the Japanese yen appear to be the best choices. Although as a currency our top choice is gold. Yes, gold is a currency, even if not officially so. Gold has a 3,000-year-old history of being money. Silver as well.

Yes, the first gold coins were not really gold at all but electrum, a natural alloy of gold and silver. Above is one of the earliest from Lydia, an iron-age kingdom in Asia Minor, now Turkey. Lydian coins were not large, often weighing as little as 0.006 troy ounces and maybe up to a half-ounce. This is a gorgeous specimen pictured with the head of a lion and a ram. Bulls were also common on the coins. These coins are prized by collectors. Ancient China also had gold coins dating back to the 7th century BC.
The US$ Index has resistance up to 98.30/98.90. Above 99 the US$ Index could rise further. We continue to view this as a corrective wave and not the start of a new up phase, although a breakout over 99 would start to change our mind. Major support is seen at 95.50.
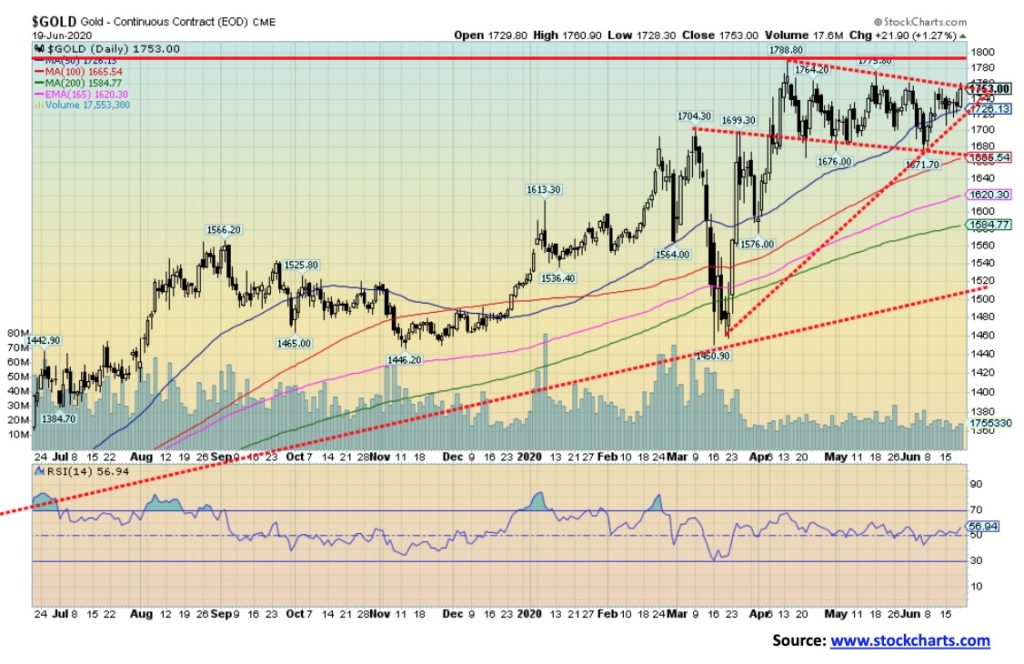
Gold prices rose about $16 this past week or about 0.9%. That potentially puts gold on the cusp of a breakout from the long flag pattern that appears to have been forming over the past several weeks. During what we would call a seasonally weak period for gold, gold prices have held in, not wavering much. Breakdown remains at $1,670/$1,675 and breakout is at $1,760. Breaking above $1,760 could come this week and that could set gold on its way to $1,800. Above $1,800, we continue to have potential targets up to $1,935/$1,950. The flag pattern suggests a move to at least $1,875.
Precious metals prices were positive this past week with silver rising 2.1% and platinum up 1.0%. Of the industrial metals, palladium remains soft, falling 1.6% but copper prices rose 0.4%. Both the gold stock indices were positive on the week.
We couldn’t help but note that Goldman Sachs has hiked its 12-month target for gold to $2,000. Recall that Bank of America (Merrill Lynch) has a target of up to $3,000. Other analysts have targets up to $5,000. Goldman believes that currency debasement remains the number one reason for gold’s rise. Economic uncertainty due to the coronavirus also remains at the top of the list. Despite there appearing to be no inflation, there are some concerns at the large investment houses of a revival of inflation above the Fed’s target of 2%. Even if that were to happen it is unlikely, as the Fed would respond with higher interest rates. That would be positive for gold. If, as we have noted for the stock market, the Fed pulled away the punch bowl, that could also be negative for gold as a considerable amount has been flowing into gold over the past few months. Goldman also has targets for silver up to $21/$22. All these targets are fairly consistent with our own assessment.
We were wondering if, given the plethora of trading accounts that have opened — and especially with the so-called Robinhood traders who tend to follow the momentum— could they then pile into gold and gold stocks? As we have noted, it is a pretty small market so a rush of funds into the sector could spark sharp moves to the upside. Gold is not overbought at these levels and bullish consensus is also not at levels that would send warning signals. The corrective pattern of the past several weeks has helped ease bullish consensus. But that pattern appears to be coming to an end and a breakout to the upside could be imminent.
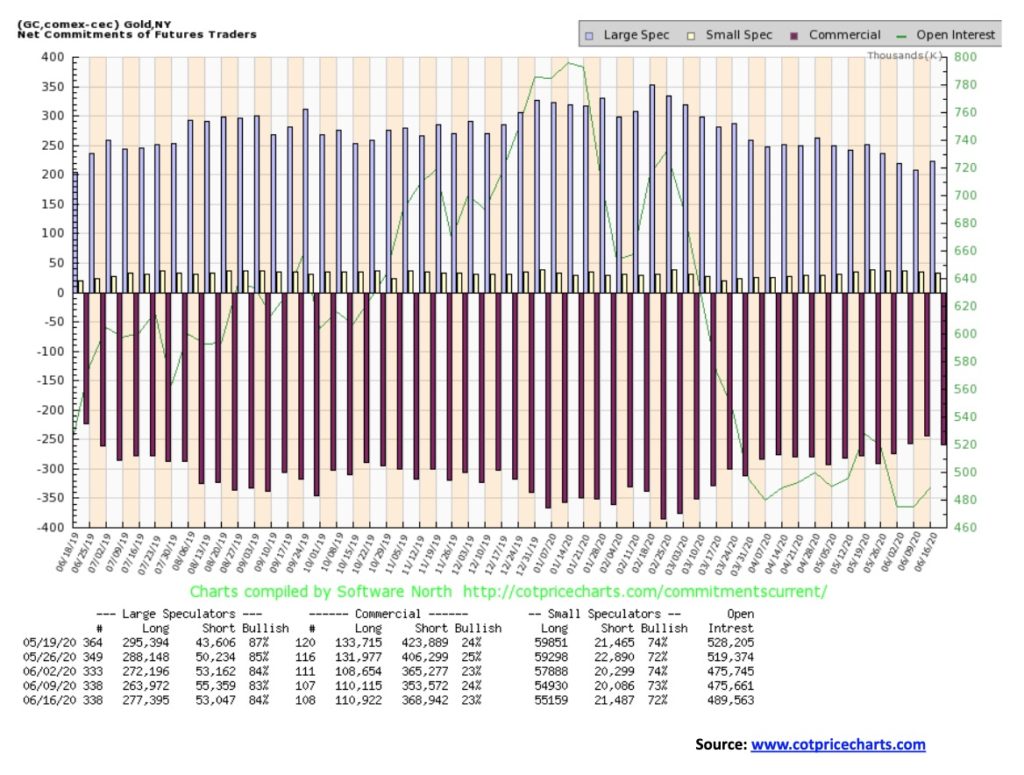
The gold commercial COT slipped slightly this week to 23% from 24% the previous week. Long open interest was up a marginal 800 contracts while short open interest rose roughly 15,000 contracts. The large speculators COT (hedge funds, managed futures, etc.) rose slightly to 84% from 83% as they increased their long open interest by roughly 14,000 contracts while cutting their short open interest by over 2,000 contracts. Overall, open interest rose on a week that gold prices rose. That’s positive, even if the gold COT remains somewhat bearish. Except we note that the gold commercial COT has been in this state now for months and gold prices have not collapsed.
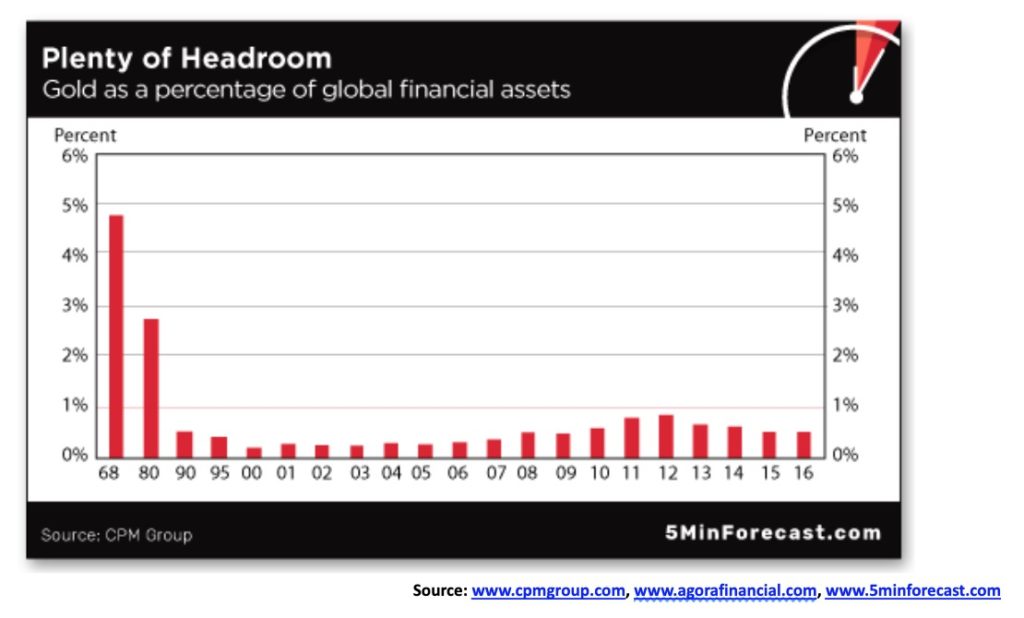
It seems global wealth management advisors are advising their clients to up their gold holdings; that means we might see gold as percentage of global financial assets start to rise. Apparently, these high wealth advisors are advising clients to up their gold holdings to around 10%. These private wealth advisors hold upwards of $6 trillion in assets. Right now, gold as a percentage of global financial assets is pretty small (> 4%). There is an estimated market of at least $200 trillion in bonds and stocks and all the gold in the world is only about $7.5 trillion. In other words, it is a pretty small market and at least 20% of it is out of commission in the world’s central banks and a big chunk of the rest dangles on arms or around necks. So, if they moved 10% of their holdings into gold, well, that’s $6 billion and just that small amount could push gold prices sharply higher. It is a small market. As to gold stocks, Amazon or Apple would have no problem buying all of the gold stocks in the world and still have plenty left over. Just a small amount shifted into gold and gold stocks could move that market very quickly.
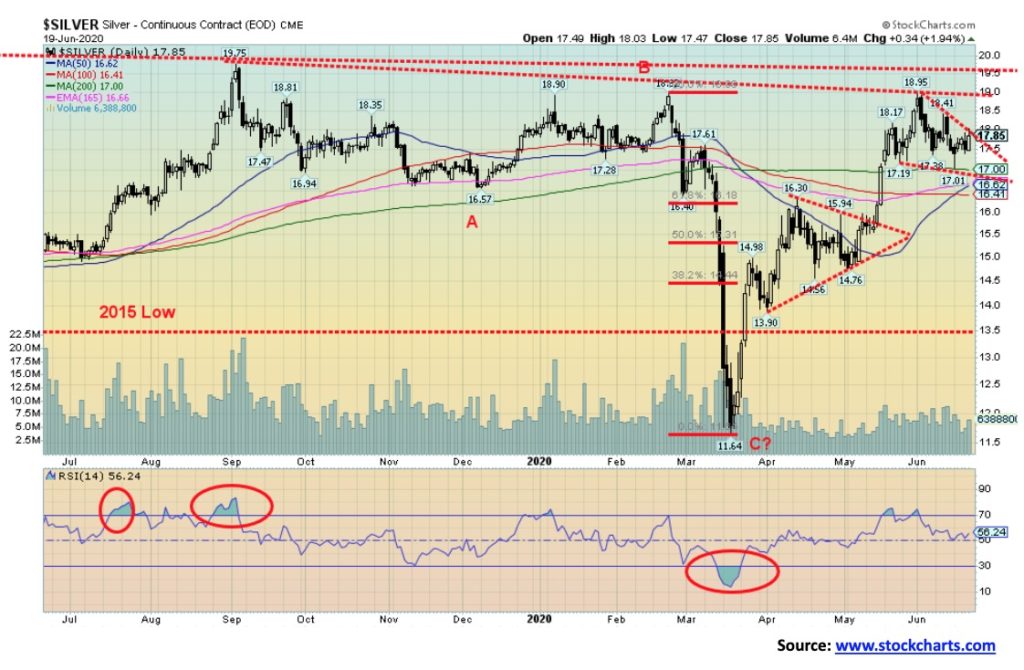
Silver prices rose 2.1% this past week to $17.85. We need to break out over $18.35 for starters to suggest a move towards $19. Over $19 we could start a move to $20/$21. Silver appears to be forming what appears as a pennant formation, with the breakout just above at $18. The pennant suggests a move to $19.95. In the event of a breakdown (which is less likely now), support is at $17 and under that level silver could fall to $15. Under $16.95 would be considered a breakdown and under $16.40 would confirm a breakdown. The chart pattern suggests the next move should be up, not down, but until it starts breaking out one has to remain mindful of downside risk.
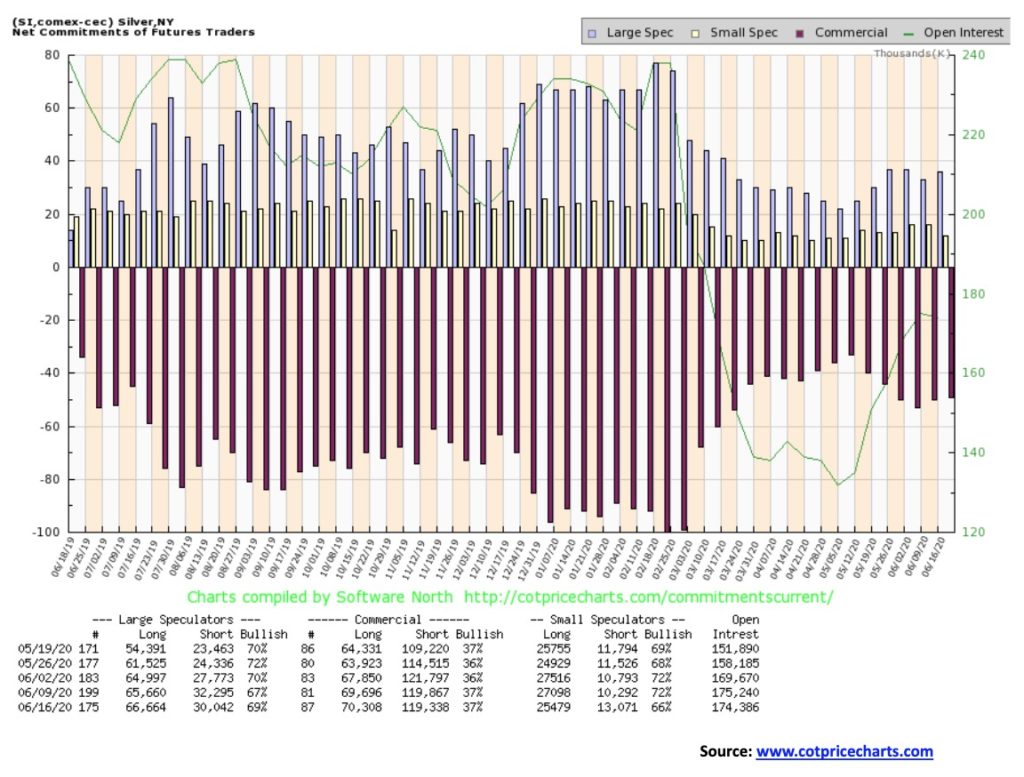
The silver commercial COT remained steady this past week at 37%. There was little change in either long or short open interest. The large speculators did increase their long holdings by roughly 1,000 contracts and dropped their short holdings by roughly 2,000 contracts, thus increasing their bullish consensus to 69% from 67%. With little change in the silver COT, it remains about as a bullish as it is going to get for now.
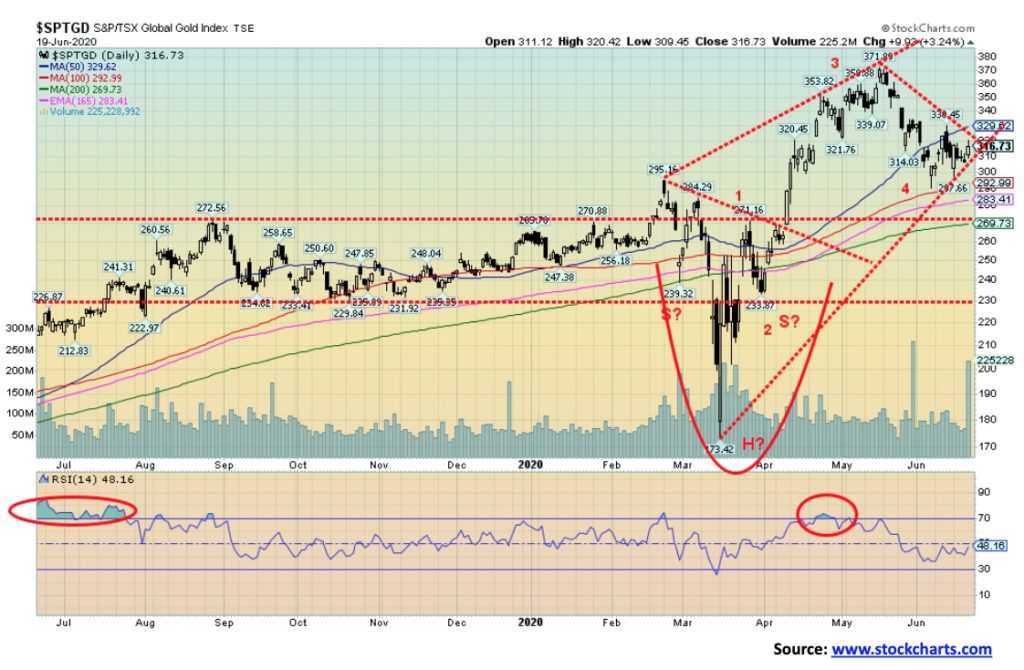
The TSX Gold Index (TGD) gained 2.3% this past week while the Gold Bugs Index (HUI) was up 1.8%. Based on the week’s action and given no new lows, the TGD could be poised to break out over 330 and start a new run up towards the May highs (372). It might even surpass that level. We never fulfilled the head and shoulders target of 385; however, the target remains viable. In a best-case scenario, the TGD charging to new highs above 372 could target the index up to 445/450. We note the 2011 high for the TGD was at 455. The HUI, on the other hand, currently at 267, is well off its all-time high in 2011 of 639. While the TGD would be on shakier ground if it broke under 293 there is considerable support down to 270. We note the high volume of the past week, suggesting that higher prices could be ahead. Sentiment is high but not at levels we would call extremes. So that bodes positively for further gains. The RSI is turning up as are other indicators. The RSI at 46 has considerable room to rise before it would become overbought over 70.
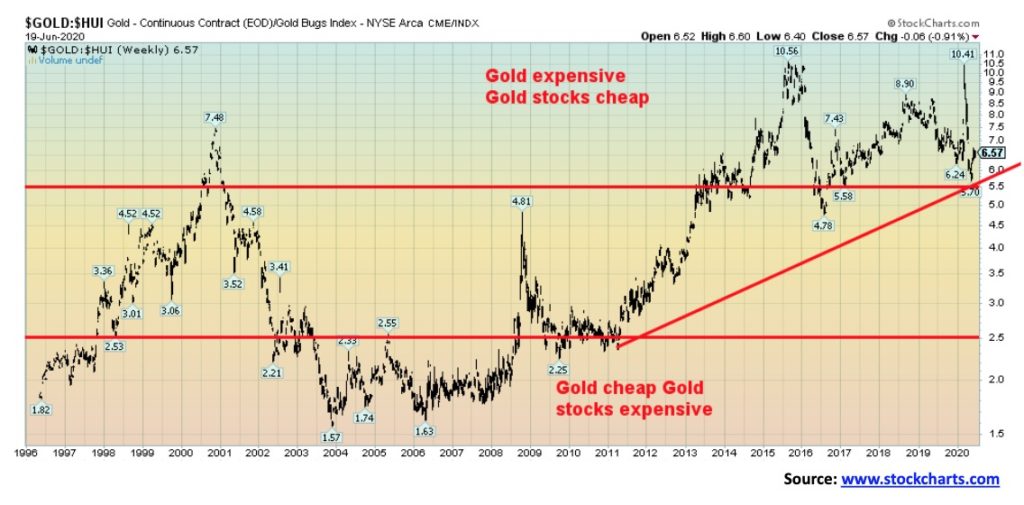
Despite some recent improvement, gold stocks remain cheap to the price of gold. The Gold/HUI ratio has fallen to 6.57, down from its peak of 10.41 but it still has a long way to go before the gold stocks could be considered expensive. Under 5.5 would be a positive development, but then the ratio would need to fall under the 2016 low of 4.78 to suggest further declines. It is a long way off to declaring gold stocks expensive, suggesting that even at current levels the gold stocks remain bargains.
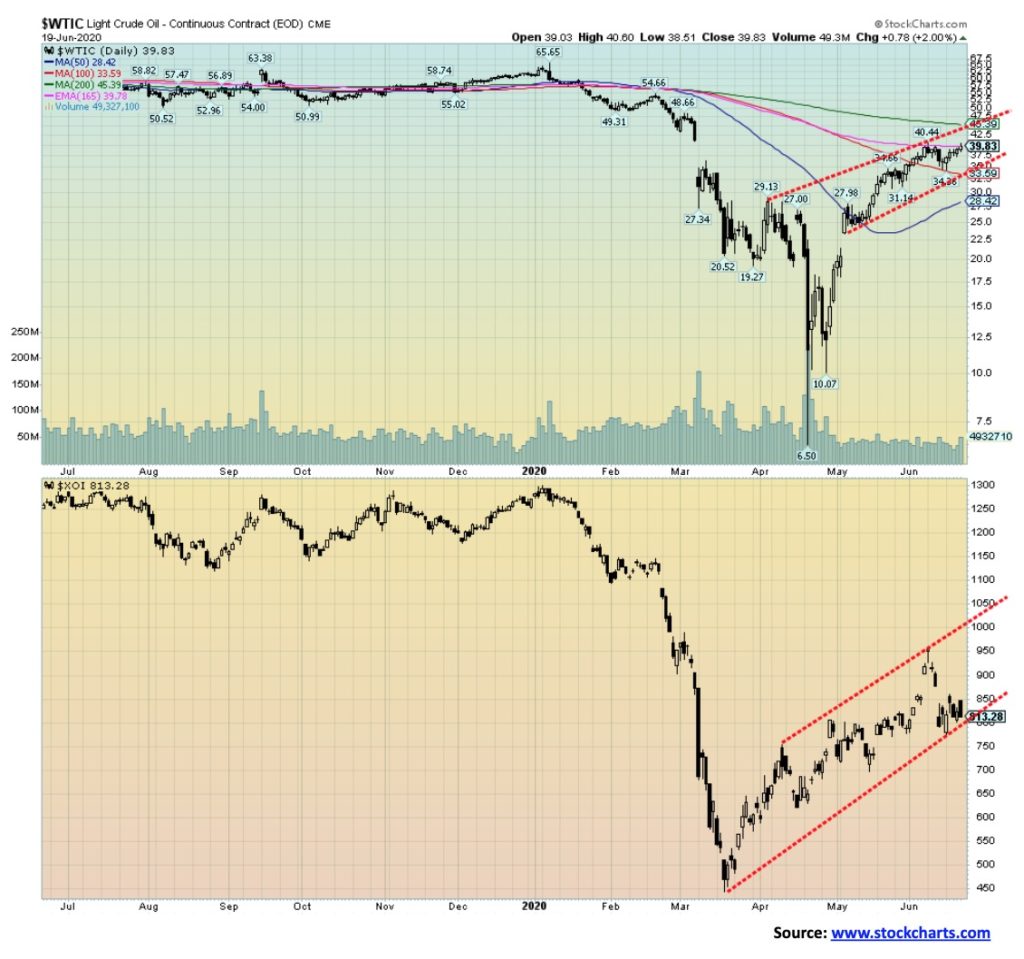
A second wave of COVID-19? Piffle. OPEC cooperating. Wow! The two combined to give WTI oil a 9.9% boost this past week or $3.57. Too bad that didn’t translate elsewhere. Oversupplied natural gas (NG) fell again, losing 3.5% and remains mired in its own depression. Energy stocks didn’t perform at all as the ARCA Oil & Gas Index (XOI) lost 0.7% while Canada’s TSX Energy Index (TEN) fell a sharp 4.2%. With oil prices heading one way and NG and the energy stocks heading the other way, our assessment says that the oil rally won’t last and odds favour the next move to be down.
WTI oil continues to trade under the 200-day MA and just under the 165-day EMA. It also rose, slipped back, and rose again this past week, falling just short of the previous high. A turn down now could leave a small double top on the charts. The breakdown point is at $34.50 and could project down to $28.50. There would be interim support at $30/$31, but below that level the break could become even sharper. As long as oil prices remain above $19 WTI oil could then begin to form what may be an interesting bottom pattern.
Helping oil this past week was seeming cooperation amongst OPEC members in keeping supplies on a leash. Two of the malcontents about supply constraints—Iraq and Kazakhstan—were presenting plans on how they would increase their compliance with the group. The two were holdouts when it came to cutting supply.
Elsewhere, we learned the sanctioning nation—the U.S.—had put sanctions on a Mexican oil trading company, Libre Abordo SA de CV, for buying Venezuelan oil. Saudi Aramco, the world’s third largest oil company, announced they were cutting hundreds of jobs to reduce costs.
There are fears that U.S. shale production could fall by over 50% over the next year because of a sharp drop in rig count. That in turn could drop U.S. oil production to under 8 mb/d, the lowest level in years. A large shale producer, Chisholm Oil & Gas Operating LCC, declared bankruptcy. Companies continue to have major problems as Schlumberger (SLB) took a massive $1.4 billion write-down, BP (BP) took a $17.5 billion write-down, and Chesapeake Energy (CHK) skipped an interest payment. CHK has some $9 billion in debt and insufficient cash.
We suppose that the Vatican advising Catholics to divest themselves of investments in the oil and gas industry was not helpful. Instead, the Vatican was recommending they go Green.
The battle over Keystone XL has heightened with the Trump administration taking it to the Supreme Court to revive the permit so that the pipeline can get built. Regardless of the ruling, those against the pipeline are sure to dig in their heels for a bloodier fight.
Despite some recent improvement in the price of oil, the sector remains buried in a depression and is unlikely to come out of it anytime soon. The energy stocks appear to have completed a corrective wave to the upside and appear poised to return to the downside. Breakdown for the XOI is under 750 and for the TEN under 67. For oil, only firmly breaking above $45 could suggest a run towards to $60. Otherwise, as noted, a breakdown under $34.50 could trigger further declines.
—
(Featured image by Lukas via Pexels)
DISCLAIMER: This article was written by a third party contributor and does not reflect the opinion of Born2Invest, its management, staff or its associates. Please review our disclaimer for more information.
This article may include forward-looking statements. These forward-looking statements generally are identified by the words “believe,” “project,” “estimate,” “become,” “plan,” “will,” and similar expressions. These forward-looking statements involve known and unknown risks as well as uncertainties, including those discussed in the following cautionary statements and elsewhere in this article and on this site. Although the Company may believe that its expectations are based on reasonable assumptions, the actual results that the Company may achieve may differ materially from any forward-looking statements, which reflect the opinions of the management of the Company only as of the date hereof. Additionally, please make sure to read these important disclosures.


The TopRanked.io Weekly Affiliate Marketing Digest [The Top VPN Affiliate Programs Roundup]
Want to be let in on a little secret about two massive affiliate opportunities you can take advantage of today?...


Sustainable Finance Faces Hurdles as Green Asset Ratio Reforms Fall Short of Full Transparency
The Green Asset Ratio (GAR) measures banks' alignment with the EU Taxonomy but remains low due to methodological flaws and...


XRP Hits New All-Time High Amid U.S. Crypto Policy Shift and Ripple’s Expansion
XRP surged past its 2018 all-time high, reaching $3.65 amid renewed political support for crypto in the U.S. under Trump....


Germany Moves to Curb Medical Cannabis Abuse, Sparking Access Concerns
Medical cannabis imports in Germany have surged, but health insurance-covered prescriptions remain low. Easy online access raises concerns about abuse...


JPMorgan’s Data Fees Shake Fintech: PayPal Takes a Hit
JPMorgan Chase will charge fintechs for customer data, threatening business models reliant on free access. PayPal’s stock plunged 5.7% after...
 |
|
 |  |
 |
|
-

 Crowdfunding1 week ago
PMG Empowers Italian SMEs with Performance Marketing and Investor-Friendly Crowdfunding
-

 Markets5 days ago
Markets Wobble After Highs as Tariffs Rise and Commodities Soar
-
 Markets2 weeks ago
The Big Beautiful Bill: Market Highs Mask Debt and Divergence
-

 Africa2 days ago
ORA Technologies Secures $7.5M from Local Investors, Boosting Morocco’s Tech Independence